Iznik Airbnb Market Analysis 2026: Short Term Rental Data & Vacation Rental Statistics in Bursa, Turkey
Is Airbnb profitable in Iznik in 2026? Explore comprehensive Airbnb analytics for Iznik, Bursa, Turkey to uncover income potential. This 2026 STR market report for Iznik, based on AirROI data from February 2025 to January 2026, reveals key trends in the niche market of 19 active listings.
Whether you're considering an Airbnb investment in Iznik, optimizing your existing vacation rental, or exploring rental arbitrage opportunities, understanding the Iznik Airbnb data is crucial. Navigating the high regulation landscape is key to maximizing your short term rental income potential. Let's dive into the specifics.
Key Iznik Airbnb Performance Metrics Overview
Monthly Airbnb Revenue Variations & Income Potential in Iznik (2026)
Understanding the monthly revenue variations for Airbnb listings in Iznik is key to maximizing your short term rental income potential. Seasonality significantly impacts earnings. Our analysis, based on data from the past 12 months, shows that the peak revenue month for STRs in Iznik is typically August, while December often presents the lowest earnings, highlighting opportunities for strategic pricing adjustments during shoulder and low seasons. Explore the typical Airbnb income in Iznik across different performance tiers:
- Best-in-class properties (Top 10%) achieve $2,217+ monthly, often utilizing dynamic pricing and superior guest experiences.
- Strong performing properties (Top 25%) earn $1,379 or more, indicating effective management and desirable locations/amenities.
- Typical properties (Median) generate around $787 per month, representing the average market performance.
- Entry-level properties (Bottom 25%) see earnings around $317, often with potential for optimization.
Average Monthly Airbnb Earnings Trend in Iznik
Iznik Airbnb Occupancy Rate Trends (2026)
Maximize your bookings by understanding the Iznik STR occupancy trends. Seasonal demand shifts significantly influence how often properties are booked. Typically, Augustsees the highest demand (peak season occupancy), while December experiences the lowest (low season). Effective strategies, like adjusting minimum stays or offering promotions, can boost occupancy during slower periods. Here's how different property tiers perform in Iznik:
- Best-in-class properties (Top 10%) achieve 45%+ occupancy, indicating high desirability and potentially optimized availability.
- Strong performing properties (Top 25%) maintain 26% or higher occupancy, suggesting good market fit and guest satisfaction.
- Typical properties (Median) have an occupancy rate around 16%.
- Entry-level properties (Bottom 25%) average 7% occupancy, potentially facing higher vacancy.
Average Monthly Occupancy Rate Trend in Iznik
Average Daily Rate (ADR) Airbnb Trends in Iznik (2026)
Effective short term rental pricing strategy in Iznik involves understanding monthly ADR fluctuations. The Average Daily Rate (ADR) for Airbnb in Iznik typically peaks in June and dips lowest during January. Leveraging Airbnb dynamic pricing tools or strategies based on this seasonality can significantly boost revenue. Here's a look at the typical nightly rates achieved:
- Best-in-class properties (Top 10%) command rates of $272+ per night, often due to premium features or locations.
- Strong performing properties (Top 25%) achieve nightly rates of $194 or more.
- Typical properties (Median) charge around $135 per night.
- Entry-level properties (Bottom 25%) earn around $91 per night.
Average Daily Rate (ADR) Trend by Month in Iznik
Get Live Iznik Market Intelligence 👇

Explore Real-time Analytics
Airbnb Seasonality Analysis & Trends in Iznik (2026)
Peak Season (August, July, February)
- Revenue averages $2,040 per month
- Occupancy rates average 33.8%
- Daily rates average $191
Shoulder Season
- Revenue averages $871 per month
- Occupancy maintains around 18.4%
- Daily rates hold near $178
Low Season (October, November, December)
- Revenue drops to average $516 per month
- Occupancy decreases to average 10.2%
- Daily rates adjust to average $153
Seasonality Insights for Iznik
- The Airbnb seasonality in Iznik shows highly seasonal trends requiring careful strategy. While the sections above show seasonal averages, it's also insightful to look at the extremes:
- During the high season, the absolute peak month showcases Iznik's highest earning potential, with monthly revenues capable of climbing to $2,654, occupancy reaching a high of 35.8%, and ADRs peaking at $194.
- Conversely, the slowest single month of the year, typically falling within the low season, marks the market's lowest point. In this month, revenue might dip to $441, occupancy could drop to 8.9%, and ADRs may adjust down to $151.
- Understanding both the seasonal averages and these monthly peaks and troughs in revenue, occupancy, and ADR is crucial for maximizing your Airbnb profit potential in Iznik.
Seasonal Strategies for Maximizing Profit
- Peak Season: Maximize revenue through premium pricing and potentially longer minimum stays. Ensure high availability.
- Low Season: Offer competitive pricing, special promotions (e.g., extended stay discounts), and flexible cancellation policies. Target off-season travelers like remote workers or budget-conscious guests.
- Shoulder Seasons: Implement dynamic pricing that balances peak and low rates. Target weekend travelers or specific events. Offer slightly more flexible terms than peak season.
- Regularly analyze your own performance against these Iznik seasonality benchmarks and adjust your pricing and availability strategy accordingly.
Best Areas for Airbnb Investment in Iznik (2026)
Exploring the top neighborhoods for short-term rentals in Iznik? This section highlights key areas, outlining why they are attractive for hosts and guests, along with notable local attractions. Consider these locations based on your target guest profile and investment strategy.
| Neighborhood / Area | Why Host Here? (Target Guests & Appeal) | Key Attractions & Landmarks |
|---|---|---|
| Historical Center | The heart of Iznik known for its rich history and ancient architecture. Attracts tourists interested in exploring historical sites and museums, making it a prime location for Airbnb hosting. | Iznik Museum, Green Mosque (Yesil Camii), Iznik Tiles Workshops, Ancient City Walls, St. Sophia Church, Bishop's Palace |
| Lake Iznik Waterfront | Scenic area along the lake offering breathtaking views and leisure activities. Popular among families and nature lovers looking for a serene retreat. | Iznik Lake, Water sports activities, Picnic areas, Walking trails, Fishing spots |
| Iznik Archaeological Site | A must-visit for history enthusiasts, this area features significant archaeological remains. Ideal for tourists who appreciate culture and history. | Suyolu Ancient City, Roman Theater Ruins, Ancient Church Remains |
| Orhan Gazi Park | A peaceful park offering green space and family-friendly activities. Appeals to those seeking relaxation and outdoor fun. | Walking trails, Playgrounds, Picnic spots |
| Cultural District | Vibrant area featuring local crafts, traditional shops, and food markets. Great for travelers interested in the local culture and experiences. | Local markets, Artisan shops, Cafés and restaurants |
| Bursa Road | Main access road with numerous dining and shopping options. Attracts visitors looking for convenience and modern amenities. | Shopping centers, Restaurants, Cafés |
| Public Beach | Family-friendly beach area with safe swimming and recreational activities. A popular spot for tourists seeking beach fun. | Swimming, Beach volleyball, Sunbathing |
| Local Vineyards | Famous for its wines, the vineyards are a beautiful location attracting wine enthusiasts and tourists looking for unique tastings. | Vineyard tours, Wine tasting events, Scenic views |
Understanding Airbnb License Requirements & STR Laws in Iznik (2026)
Yes, Iznik, Bursa, Turkey enforces high STR regulations. Obtaining a license and ensuring compliance is almost certainly required according to current 2026 STR laws. Always verify the latest short term rental regulations and Airbnb license requirements directly with local government authorities for Iznik to ensure full compliance before hosting.
(Source: AirROI data, 2026, based on 74% licensed listings)
Top Performing Airbnb Properties in Iznik (2026)
Benchmark your potential! Explore examples of top-performing Airbnb properties in Iznikbased on Trailing Twelve Month (TTM) revenue. Analyze their characteristics, revenue, occupancy rate, and ADR to understand what drives success in this market.

Antique House Iznik Heated Pool
Entire Place • 3 bedrooms

Antique Tiny House With Heated Pool
Entire Place • 1 bedroom

Small chalet with a terrace overlooking the valley and the lake
Entire Place • 1 bedroom
Tiny House Village | Maple House
Entire Place • 1 bedroom
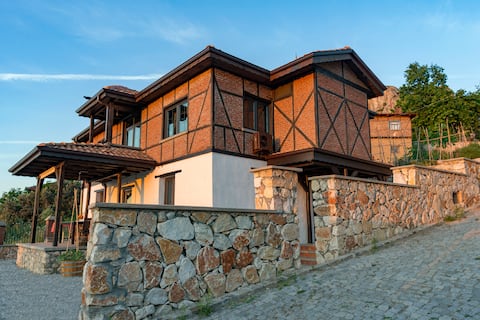
Enjoy the stunning lake view at Korpus Guest House
Entire Place • 3 bedrooms

Tiny House Village | Olive | Tiny house w/jakuzzi
Entire Place • 1 bedroom
Note: Performance varies based on location, size, amenities, seasonality, and management quality. Data reflects the past 12 months.
Top Performing Airbnb Hosts in Iznik (2026)
Learn from the best! This table showcases top-performing Airbnb hosts in Iznik based on the number of properties managed and estimated total revenue over the past year. Analyze their scale and performance metrics.
| Host Name | Properties | Grossing Revenue | Stay Reviews | Avg Rating |
|---|---|---|---|---|
| Oğuzhan | 5 | $47,407 | 149 | 4.93/5.0 |
| Orhan | 2 | $47,076 | 32 | 4.92/5.0 |
| Ayşe Gülay | 1 | $14,160 | 43 | 5.00/5.0 |
| Çağla | 1 | $9,774 | 120 | 4.98/5.0 |
| Ahşap Ev İznik | 2 | $8,376 | 66 | 4.87/5.0 |
| Erdoğan | 2 | $7,571 | 171 | 4.98/5.0 |
| Şenol | 1 | $4,707 | 45 | 4.98/5.0 |
| Ceylan | 1 | $2,736 | 4 | 4.50/5.0 |
| Seda | 1 | $1,788 | 5 | 5.00/5.0 |
| Mustafa | 1 | $1,604 | 30 | 4.80/5.0 |
Analyzing the strategies of top hosts, such as their property selection, pricing, and guest communication, can offer valuable lessons for optimizing your own Airbnb operations in Iznik.
Dive Deeper: Advanced Iznik STR Market Data (2026)
Ready to unlock more insights? AirROI provides access to advanced metrics and comprehensive Airbnb data for Iznik. Explore detailed analytics beyond this report to refine your investment strategy, optimize pricing, and maximize your vacation rental profits.
Explore Advanced MetricsIznik Short-Term Rental Market Composition (2026): Property & Room Types
Room Type Distribution
Property Type Distribution
Market Composition Insights for Iznik
- The Iznik Airbnb market composition is heavily skewed towards Entire Home/Apt listings, which make up 94.7% of the 19 active rentals. This indicates strong guest preference for privacy and space.
- Looking at the property type distribution in Iznik, House properties are the most common (68.4%), reflecting the local real estate landscape.
- Houses represent a significant 68.4% portion, catering likely to families or larger groups.
- The presence of 10.5% Hotel/Boutique listings indicates integration with traditional hospitality.
Iznik Airbnb Room Capacity Analysis (2026): Bedroom Distribution
Distribution of Listings by Number of Bedrooms
Room Capacity Insights for Iznik
- The dominant room capacity in Iznik is 1 bedroom listings, making up 52.6% of the market. This suggests a strong demand for properties suitable for couples or solo travelers.
- Together, 1 bedroom and 3 bedrooms properties represent 78.9% of the active Airbnb listings in Iznik, indicating a high concentration in these sizes.
- With over half the market (52.6%) consisting of studios or 1-bedroom units, Iznik is particularly well-suited for individuals or couples.
- A significant 26.3% of listings offer 3+ bedrooms, catering to larger groups and families seeking more space in Iznik.
Iznik Vacation Rental Guest Capacity Trends (2026)
Distribution of Listings by Guest Capacity
Guest Capacity Insights for Iznik
- The most common guest capacity trend in Iznik vacation rentals is listings accommodating 5 guests (21.1%). This suggests the primary traveler segment is likely larger groups.
- Properties designed for 5 guests and 8+ guests dominate the Iznik STR market, accounting for 36.9% of listings.
- 31.6% of properties accommodate 6+ guests, serving the market segment for larger families or group travel in Iznik.
- On average, properties in Iznik are equipped to host 4.7 guests.
Iznik Airbnb Booking Patterns (2026): Available vs. Booked Days
Available Days Distribution
Booked Days Distribution
Booking Pattern Insights for Iznik
- The most common availability pattern in Iznik falls within the 271-366 days range, representing 94.7% of listings. This suggests many properties have significant open periods on their calendars.
- Approximately 100.0% of listings show high availability (181+ days open annually), indicating potential for increased bookings or specific owner usage patterns.
- For booked days, the 31-90 days range is most frequent in Iznik (63.2%), reflecting common guest stay durations or potential owner blocking patterns.
Iznik Airbnb Minimum Stay Requirements Analysis
Distribution of Listings by Minimum Night Requirement
1 Night
7 listings
36.8% of total
2 Nights
1 listings
5.3% of total
30+ Nights
11 listings
57.9% of total
Key Insights
- The most prevalent minimum stay requirement in Iznik is 30+ Nights, adopted by 57.9% of listings. This highlights the market's preference for longer commitments.
- A significant segment (57.9%) caters to monthly stays (30+ nights) in Iznik, pointing to opportunities in the extended-stay market.
Recommendations
- Align with the market by considering a 30+ Nights minimum stay, as 57.9% of Iznik hosts use this setting.
- Explore offering discounts for stays of 30+ nights to attract the 57.9% of the market seeking extended stays.
- Adjust minimum nights based on seasonality – potentially shorter during low season and longer during peak demand periods in Iznik.
Iznik Airbnb Cancellation Policy Trends Analysis (2026)
Flexible
6 listings
31.6% of total
Moderate
10 listings
52.6% of total
Firm
3 listings
15.8% of total
Cancellation Policy Insights for Iznik
- The prevailing Airbnb cancellation policy trend in Iznik is Moderate, used by 52.6% of listings.
- The market strongly favors guest-friendly terms, with 84.2% of listings offering Flexible or Moderate policies. This suggests guests in Iznik may expect booking flexibility.
Recommendations for Hosts
- Consider adopting a Moderate policy to align with the 52.6% market standard in Iznik.
- Regularly review your cancellation policy against competitors and market demand shifts in Iznik.
Iznik STR Booking Lead Time Analysis (2026)
Average Booking Lead Time by Month
Booking Lead Time Insights for Iznik
- The overall average booking lead time for vacation rentals in Iznik is 17 days.
- Guests book furthest in advance for stays during December (average 33 days), likely coinciding with peak travel demand or local events.
- The shortest booking windows occur for stays in November (average 8 days), indicating more last-minute travel plans during this time.
- Seasonally, Winter (23 days avg.) sees the longest lead times, while Fall (14 days avg.) has the shortest, reflecting typical travel planning cycles.
Recommendations for Hosts
- Use the overall average lead time (17 days) as a baseline for your pricing and availability strategy in Iznik.
- For December stays, consider implementing length-of-stay discounts or slightly higher rates for bookings made less than 33 days out to capitalize on advance planning.
- During November, focus on last-minute booking availability and promotions, as guests book with very short notice (8 days avg.).
- Target marketing efforts for the Winter season well in advance (at least 23 days) to capture early planners.
- Monitor your own booking lead times against these Iznik averages to identify opportunities for dynamic pricing adjustments.
Popular & Essential Airbnb Amenities in Iznik (2026)
Amenity Prevalence
Amenity Insights for Iznik
- Essential amenities in Iznik that guests expect include: Outdoor dining area. Lacking these (this) could significantly impact bookings.
- Popular amenities like Kitchen, Dishes and silverware, Hair dryer are common but not universal. Offering these can provide a competitive edge.
Recommendations for Hosts
- Ensure your listing includes all essential amenities for Iznik: Outdoor dining area.
- Consider adding popular differentiators like Kitchen or Dishes and silverware to increase appeal.
- Highlight unique or less common amenities you offer (e.g., hot tub, dedicated workspace, EV charger) in your listing description and photos.
- Regularly check competitor amenities in Iznik to stay competitive.
Iznik Airbnb Guest Demographics & Profile Analysis (2026)
Guest Profile Summary for Iznik
- The typical guest profile for Airbnb in Iznik consists of a mix of domestic (45%) and international guests, with top international origins including Türkiye, typically belonging to the Post-2000s (Gen Z/Alpha) group (50%), primarily speaking English or Turkish.
- Domestic travelers account for 45.2% of guests.
- Key international markets include Turkey (45.2%) and Türkiye (26.2%).
- Top languages spoken are English (45.5%) followed by Turkish (38.2%).
- A significant demographic segment is the Post-2000s (Gen Z/Alpha) group, representing 50% of guests.
Recommendations for Hosts
- Balance marketing efforts between domestic and international channels based on the guest mix.
- Tailor amenities and listing descriptions to appeal to the dominant Post-2000s (Gen Z/Alpha) demographic (e.g., highlight fast WiFi, smart home features, local guides).
- Highlight unique local experiences or amenities relevant to the primary guest profile.
- Consider seasonal promotions aligned with peak travel times for key origin markets.
Nearby Short-Term Rental Market Comparison
How does the Iznik Airbnb market stack up against its neighbors? Compare key performance metrics like average monthly revenue, ADR, and occupancy rates in surrounding areas to understand the broader regional STR landscape.
| Market | Active Properties | Monthly Revenue | Daily Rate | Avg. Occupancy |
|---|---|---|---|---|
| Arifiye | 10 | $2,646 | $276.27 | 36% |
| Sapanca | 1,014 | $1,564 | $237.71 | 27% |
| Başiskele | 12 | $1,560 | $194.37 | 32% |
| Mudanya | 12 | $1,430 | $298.09 | 20% |
| Serdivan | 16 | $1,423 | $233.88 | 23% |
| Silivri | 13 | $1,351 | $287.24 | 27% |
| Beykoz | 36 | $1,320 | $248.20 | 27% |
| Kartepe | 153 | $1,255 | $217.05 | 24% |
| Büyükçekmece | 44 | $1,223 | $157.86 | 33% |
| Prince Islands | 152 | $1,190 | $176.95 | 27% |