Konak Airbnb Market Analysis 2026: Short Term Rental Data & Vacation Rental Statistics in Izmir, Turkey
Is Airbnb profitable in Konak in 2026? Explore comprehensive Airbnb analytics for Konak, Izmir, Turkey to uncover income potential. This 2026 STR market report for Konak, based on AirROI data from February 2025 to January 2026, reveals key trends in the market of 335 active listings.
Whether you're considering an Airbnb investment in Konak, optimizing your existing vacation rental, or exploring rental arbitrage opportunities, understanding the Konak Airbnb data is crucial. Navigating the high regulation landscape is key to maximizing your short term rental income potential. Let's dive into the specifics.
Key Konak Airbnb Performance Metrics Overview
Monthly Airbnb Revenue Variations & Income Potential in Konak (2026)
Understanding the monthly revenue variations for Airbnb listings in Konak is key to maximizing your short term rental income potential. Seasonality significantly impacts earnings. Our analysis, based on data from the past 12 months, shows that the peak revenue month for STRs in Konak is typically July, while December often presents the lowest earnings, highlighting opportunities for strategic pricing adjustments during shoulder and low seasons. Explore the typical Airbnb income in Konak across different performance tiers:
- Best-in-class properties (Top 10%) achieve $1,934+ monthly, often utilizing dynamic pricing and superior guest experiences.
- Strong performing properties (Top 25%) earn $1,319 or more, indicating effective management and desirable locations/amenities.
- Typical properties (Median) generate around $684 per month, representing the average market performance.
- Entry-level properties (Bottom 25%) see earnings around $273, often with potential for optimization.
Average Monthly Airbnb Earnings Trend in Konak
Konak Airbnb Occupancy Rate Trends (2026)
Maximize your bookings by understanding the Konak STR occupancy trends. Seasonal demand shifts significantly influence how often properties are booked. Typically, Aprilsees the highest demand (peak season occupancy), while December experiences the lowest (low season). Effective strategies, like adjusting minimum stays or offering promotions, can boost occupancy during slower periods. Here's how different property tiers perform in Konak:
- Best-in-class properties (Top 10%) achieve 73%+ occupancy, indicating high desirability and potentially optimized availability.
- Strong performing properties (Top 25%) maintain 54% or higher occupancy, suggesting good market fit and guest satisfaction.
- Typical properties (Median) have an occupancy rate around 31%.
- Entry-level properties (Bottom 25%) average 14% occupancy, potentially facing higher vacancy.
Average Monthly Occupancy Rate Trend in Konak
Average Daily Rate (ADR) Airbnb Trends in Konak (2026)
Effective short term rental pricing strategy in Konak involves understanding monthly ADR fluctuations. The Average Daily Rate (ADR) for Airbnb in Konak typically peaks in September and dips lowest during March. Leveraging Airbnb dynamic pricing tools or strategies based on this seasonality can significantly boost revenue. Here's a look at the typical nightly rates achieved:
- Best-in-class properties (Top 10%) command rates of $116+ per night, often due to premium features or locations.
- Strong performing properties (Top 25%) achieve nightly rates of $86 or more.
- Typical properties (Median) charge around $60 per night.
- Entry-level properties (Bottom 25%) earn around $44 per night.
Average Daily Rate (ADR) Trend by Month in Konak
Get Live Konak Market Intelligence 👇

Explore Real-time Analytics
Airbnb Seasonality Analysis & Trends in Konak (2026)
Peak Season (July, August, April)
- Revenue averages $1,107 per month
- Occupancy rates average 42.8%
- Daily rates average $70
Shoulder Season
- Revenue averages $869 per month
- Occupancy maintains around 36.5%
- Daily rates hold near $70
Low Season (January, October, December)
- Revenue drops to average $654 per month
- Occupancy decreases to average 25.3%
- Daily rates adjust to average $70
Seasonality Insights for Konak
- The Airbnb seasonality in Konak shows moderate seasonality with distinct peak and low periods. While the sections above show seasonal averages, it's also insightful to look at the extremes:
- During the high season, the absolute peak month showcases Konak's highest earning potential, with monthly revenues capable of climbing to $1,186, occupancy reaching a high of 46.4%, and ADRs peaking at $72.
- Conversely, the slowest single month of the year, typically falling within the low season, marks the market's lowest point. In this month, revenue might dip to $622, occupancy could drop to 23.5%, and ADRs may adjust down to $69.
- Understanding both the seasonal averages and these monthly peaks and troughs in revenue, occupancy, and ADR is crucial for maximizing your Airbnb profit potential in Konak.
Seasonal Strategies for Maximizing Profit
- Peak Season: Maximize revenue through premium pricing and potentially longer minimum stays. Ensure high availability.
- Low Season: Offer competitive pricing, special promotions (e.g., extended stay discounts), and flexible cancellation policies. Target off-season travelers like remote workers or budget-conscious guests.
- Shoulder Seasons: Implement dynamic pricing that balances peak and low rates. Target weekend travelers or specific events. Offer slightly more flexible terms than peak season.
- Regularly analyze your own performance against these Konak seasonality benchmarks and adjust your pricing and availability strategy accordingly.
Best Areas for Airbnb Investment in Konak (2026)
Exploring the top neighborhoods for short-term rentals in Konak? This section highlights key areas, outlining why they are attractive for hosts and guests, along with notable local attractions. Consider these locations based on your target guest profile and investment strategy.
| Neighborhood / Area | Why Host Here? (Target Guests & Appeal) | Key Attractions & Landmarks |
|---|---|---|
| Alsancak | Vibrant urban area known for its lively atmosphere, restaurants, and nightlife. A popular choice for tourists seeking the local lifestyle and culture, with a proximity to the waterfront. | Kordon Boyu, Alsancak Mahallesi, Café Street, Kucuk Park, Alsancak Station |
| Karataş | A serene neighborhood with stunning views of the sea and proximity to natural parks. Ideal for travelers looking for a peaceful retreat while being close to the city center. | Karataş Beach, Natural Park, Güzelbahçe, Eski İzmir Park, Çiğli Air Base Museum |
| Buca | A dynamic district known for its rich history and cultural sites. Great for visitors interested in exploring Izmir's historical significance and vibrant community. | Buca Fortress, Buca Municipality Park, Menderes Botanical Garden, Buca House of Culture, Buca Activity Center |
| Bornova | A developing area with growing investment potential, featuring educational institutions and modern amenities. Appealing to students and young professionals. | Ege University, Bornova Metro Station, Forum Bornova Shopping Center, İzmir Fair Grounds, Park Bornova |
| Göztepe | Popular locality with a mix of residential areas and entertainment options, making it a great spot for families and young adults alike. | Göztepe 60th Year Park, İzmir Sailing Club, Göztepe Sports Complex, Mavi Bahçe Shopping Center, Local cafes and restaurants |
| Konak | The central district of Izmir with rich history and landmarks, perfect for tourists wanting to explore traditional markets and local culture. | Konak Square, Kemeraltı Bazaar, Izmir Clock Tower, Historical Support Buildings, Agora Open Air Museum |
| Balçova | Known for its thermal springs and wellness facilities. An attractive option for those looking to relax and rejuvenate while visiting Izmir. | Balçova Thermal Springs, Teleferik (Cable Car), Zeki Müren Arts Museum, Balçova Shopping Center, Çiğli River Park |
| Fahrettin Altay | A residential area with growing popularity due to public transport access and local amenities, suited for long-term rentals and tourists needing convenience. | Fahrettin Altay Metro Station, Local markets and shops, Community parks, Nearby beach access, Cafes and eateries |
Understanding Airbnb License Requirements & STR Laws in Konak (2026)
Yes, Konak, Izmir, Turkey enforces high STR regulations. Obtaining a license and ensuring compliance is almost certainly required according to current 2026 STR laws. Always verify the latest short term rental regulations and Airbnb license requirements directly with local government authorities for Konak to ensure full compliance before hosting.
(Source: AirROI data, 2026, based on 71% licensed listings)
Top Performing Airbnb Properties in Konak (2026)
Benchmark your potential! Explore examples of top-performing Airbnb properties in Konakbased on Trailing Twelve Month (TTM) revenue. Analyze their characteristics, revenue, occupancy rate, and ADR to understand what drives success in this market.
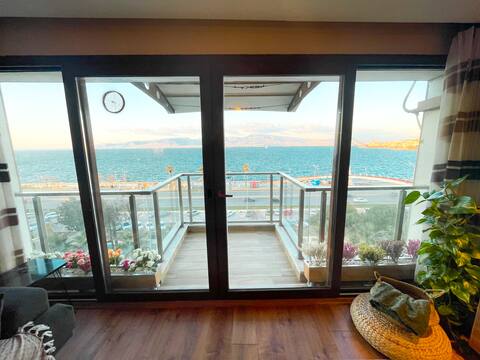
Amazing Sea View in Center with Special Parking
Entire Place • 2 bedrooms

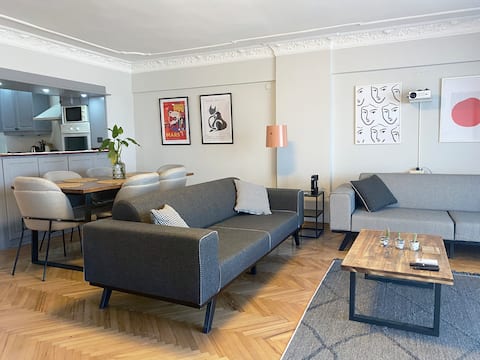
Stylish Triplex Apartment in The Heart of Izmir
Entire Place • 2 bedrooms

Terrace with Sea View - Historical Detached House
Entire Place • 3 bedrooms

Maris Alsancak @ Greek House City Center
Entire Place • 5 bedrooms

Private Central 2BR/2BA House w Patio&Terrace
Entire Place • 3 bedrooms
stylish apartment with sea view . . .
Entire Place • 3 bedrooms
Note: Performance varies based on location, size, amenities, seasonality, and management quality. Data reflects the past 12 months.
Top Performing Airbnb Hosts in Konak (2026)
Learn from the best! This table showcases top-performing Airbnb hosts in Konak based on the number of properties managed and estimated total revenue over the past year. Analyze their scale and performance metrics.
| Host Name | Properties | Grossing Revenue | Stay Reviews | Avg Rating |
|---|---|---|---|---|
| Demet | 9 | $116,715 | 721 | 4.83/5.0 |
| Taner | 12 | $113,879 | 1802 | 4.79/5.0 |
| Murat | 6 | $77,784 | 1923 | 4.89/5.0 |
| Mythic Travels | 4 | $77,471 | 438 | 4.98/5.0 |
| Cozys Houses | 3 | $63,657 | 569 | 4.90/5.0 |
| Boris | 7 | $48,114 | 200 | 4.71/5.0 |
| Umut | 3 | $45,223 | 82 | 4.56/5.0 |
| Turgut | 3 | $44,568 | 378 | 4.88/5.0 |
| Bulut | 8 | $44,556 | 340 | 4.86/5.0 |
| Doa | 8 | $40,639 | 311 | 4.88/5.0 |
Analyzing the strategies of top hosts, such as their property selection, pricing, and guest communication, can offer valuable lessons for optimizing your own Airbnb operations in Konak.
Dive Deeper: Advanced Konak STR Market Data (2026)
Ready to unlock more insights? AirROI provides access to advanced metrics and comprehensive Airbnb data for Konak. Explore detailed analytics beyond this report to refine your investment strategy, optimize pricing, and maximize your vacation rental profits.
Explore Advanced MetricsKonak Short-Term Rental Market Composition (2026): Property & Room Types
Room Type Distribution
Property Type Distribution
Market Composition Insights for Konak
- The Konak Airbnb market composition is heavily skewed towards Entire Home/Apt listings, which make up 78.2% of the 335 active rentals. This indicates strong guest preference for privacy and space.
- Looking at the property type distribution in Konak, Apartment/Condo properties are the most common (62.4%), reflecting the local real estate landscape.
- Houses represent a significant 21.8% portion, catering likely to families or larger groups.
- The presence of 14% Hotel/Boutique listings indicates integration with traditional hospitality.
- Smaller segments like outdoor/unique, others, unique stays (combined 1.8%) offer potential for unique stay experiences.
Konak Airbnb Room Capacity Analysis (2026): Bedroom Distribution
Distribution of Listings by Number of Bedrooms
Room Capacity Insights for Konak
- The dominant room capacity in Konak is 1 bedroom listings, making up 49.3% of the market. This suggests a strong demand for properties suitable for couples or solo travelers.
- Together, 1 bedroom and 2 bedrooms properties represent 80.9% of the active Airbnb listings in Konak, indicating a high concentration in these sizes.
Konak Vacation Rental Guest Capacity Trends (2026)
Distribution of Listings by Guest Capacity
Guest Capacity Insights for Konak
- The most common guest capacity trend in Konak vacation rentals is listings accommodating 2 guests (29.6%). This suggests the primary traveler segment is likely couples or solo travelers.
- Properties designed for 2 guests and 4 guests dominate the Konak STR market, accounting for 54.4% of listings.
- 15.3% of properties accommodate 6+ guests, serving the market segment for larger families or group travel in Konak.
- On average, properties in Konak are equipped to host 3.5 guests.
Konak Airbnb Booking Patterns (2026): Available vs. Booked Days
Available Days Distribution
Booked Days Distribution
Booking Pattern Insights for Konak
- The most common availability pattern in Konak falls within the 271-366 days range, representing 65.7% of listings. This suggests many properties have significant open periods on their calendars.
- Approximately 92.6% of listings show high availability (181+ days open annually), indicating potential for increased bookings or specific owner usage patterns.
- For booked days, the 1-30 days range is most frequent in Konak (34%), reflecting common guest stay durations or potential owner blocking patterns.
- A notable 8.1% of properties secure long booking periods (181+ days booked per year), highlighting successful long-term rental strategies or significant owner usage.
Konak Airbnb Minimum Stay Requirements Analysis
Distribution of Listings by Minimum Night Requirement
1 Night
79 listings
23.6% of total
2 Nights
68 listings
20.3% of total
3 Nights
13 listings
3.9% of total
4-6 Nights
15 listings
4.5% of total
7-29 Nights
28 listings
8.4% of total
30+ Nights
132 listings
39.4% of total
Key Insights
- The most prevalent minimum stay requirement in Konak is 30+ Nights, adopted by 39.4% of listings. This highlights the market's preference for longer commitments.
- A significant segment (39.4%) caters to monthly stays (30+ nights) in Konak, pointing to opportunities in the extended-stay market.
Recommendations
- Align with the market by considering a 30+ Nights minimum stay, as 39.4% of Konak hosts use this setting.
- If feasible, allowing 1-night stays, especially midweek or during low season, could capture last-minute bookings, as only 23.6% currently do.
- Explore offering discounts for stays of 30+ nights to attract the 39.4% of the market seeking extended stays.
- Adjust minimum nights based on seasonality – potentially shorter during low season and longer during peak demand periods in Konak.
Konak Airbnb Cancellation Policy Trends Analysis (2026)
Refundable
1 listings
0.3% of total
Limited
12 listings
3.6% of total
Flexible
104 listings
31.1% of total
Moderate
80 listings
24% of total
Firm
93 listings
27.8% of total
Strict
44 listings
13.2% of total
Cancellation Policy Insights for Konak
- The prevailing Airbnb cancellation policy trend in Konak is Flexible, used by 31.1% of listings.
- There's a relatively balanced mix between guest-friendly (55.1%) and stricter (41.0%) policies, offering choices for different guest needs.
Recommendations for Hosts
- Consider adopting a Flexible policy to align with the 31.1% market standard in Konak.
- Using a Strict policy might deter some guests, as only 13.2% of listings use it. Evaluate if potential revenue protection outweighs possible lower booking rates.
- Regularly review your cancellation policy against competitors and market demand shifts in Konak.
Konak STR Booking Lead Time Analysis (2026)
Average Booking Lead Time by Month
Booking Lead Time Insights for Konak
- The overall average booking lead time for vacation rentals in Konak is 28 days.
- Guests book furthest in advance for stays during October (average 109 days), likely coinciding with peak travel demand or local events.
- The shortest booking windows occur for stays in February (average 13 days), indicating more last-minute travel plans during this time.
- Seasonally, Fall (101 days avg.) sees the longest lead times, while Winter (15 days avg.) has the shortest, reflecting typical travel planning cycles.
Recommendations for Hosts
- Use the overall average lead time (28 days) as a baseline for your pricing and availability strategy in Konak.
- For October stays, consider implementing length-of-stay discounts or slightly higher rates for bookings made less than 109 days out to capitalize on advance planning.
- During February, focus on last-minute booking availability and promotions, as guests book with very short notice (13 days avg.).
- Target marketing efforts for the Fall season well in advance (at least 101 days) to capture early planners.
- Monitor your own booking lead times against these Konak averages to identify opportunities for dynamic pricing adjustments.
Popular & Essential Airbnb Amenities in Konak (2026)
Amenity Prevalence
Amenity Insights for Konak
- Essential amenities in Konak that guests expect include: Wifi, Air conditioning. Lacking these (any) could significantly impact bookings.
- Popular amenities like Washer, TV, Kitchen are common but not universal. Offering these can provide a competitive edge.
Recommendations for Hosts
- Ensure your listing includes all essential amenities for Konak: Wifi, Air conditioning.
- Prioritize adding missing essentials: Wifi, Air conditioning.
- Consider adding popular differentiators like Washer or TV to increase appeal.
- Highlight unique or less common amenities you offer (e.g., hot tub, dedicated workspace, EV charger) in your listing description and photos.
- Regularly check competitor amenities in Konak to stay competitive.
Konak Airbnb Guest Demographics & Profile Analysis (2026)
Guest Profile Summary for Konak
- The typical guest profile for Airbnb in Konak consists of predominantly international visitors (90%), with top international origins including United States, typically belonging to the Post-2000s (Gen Z/Alpha) group (50%), primarily speaking English or Turkish.
- Domestic travelers account for 10.1% of guests.
- Key international markets include Türkiye (13%) and United States (12.6%).
- Top languages spoken are English (39.7%) followed by Turkish (15.3%).
- A significant demographic segment is the Post-2000s (Gen Z/Alpha) group, representing 50% of guests.
Recommendations for Hosts
- Focus marketing internationally, particularly towards travelers from United States.
- Tailor amenities and listing descriptions to appeal to the dominant Post-2000s (Gen Z/Alpha) demographic (e.g., highlight fast WiFi, smart home features, local guides).
- Highlight unique local experiences or amenities relevant to the primary guest profile.
- Consider seasonal promotions aligned with peak travel times for key origin markets.
Nearby Short-Term Rental Market Comparison
How does the Konak Airbnb market stack up against its neighbors? Compare key performance metrics like average monthly revenue, ADR, and occupancy rates in surrounding areas to understand the broader regional STR landscape.
| Market | Active Properties | Monthly Revenue | Daily Rate | Avg. Occupancy |
|---|---|---|---|---|
| Güzelbahçe | 13 | $1,669 | $172.78 | 38% |
| Patmos | 37 | $1,577 | $364.86 | 39% |
| Grigos | 35 | $1,461 | $305.01 | 39% |
| Municipality of Kalymnos | 54 | $1,354 | $211.43 | 44% |
| Bodrum | 1,240 | $1,294 | $272.61 | 31% |
| Skala | 117 | $1,049 | $259.39 | 39% |
| Foça | 124 | $994 | $157.95 | 29% |
| Çeşme | 1,045 | $991 | $210.81 | 29% |
| Kato Raches | 24 | $971 | $119.91 | 44% |
| Municipal Unit of Pythagoreio | 139 | $929 | $123.54 | 43% |