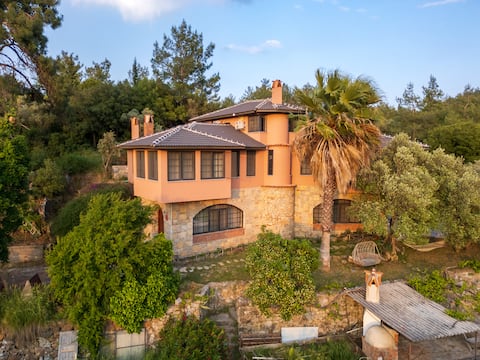
Ula Airbnb Market Analysis 2026: Short Term Rental Data & Vacation Rental Statistics in Muğla, Turkey
Is Airbnb profitable in Ula in 2026? Explore comprehensive Airbnb analytics for Ula, Muğla, Turkey to uncover income potential. This 2026 STR market report for Ula, based on AirROI data from February 2025 to January 2026, reveals key trends in the niche market of 186 active listings.
Whether you're considering an Airbnb investment in Ula, optimizing your existing vacation rental, or exploring rental arbitrage opportunities, understanding the Ula Airbnb data is crucial. Navigating the high regulation landscape is key to maximizing your short term rental income potential. Let's dive into the specifics.
Key Ula Airbnb Performance Metrics Overview
Monthly Airbnb Revenue Variations & Income Potential in Ula (2026)
Understanding the monthly revenue variations for Airbnb listings in Ula is key to maximizing your short term rental income potential. Seasonality significantly impacts earnings. Our analysis, based on data from the past 12 months, shows that the peak revenue month for STRs in Ula is typically August, while December often presents the lowest earnings, highlighting opportunities for strategic pricing adjustments during shoulder and low seasons. Explore the typical Airbnb income in Ula across different performance tiers:
- Best-in-class properties (Top 10%) achieve $3,098+ monthly, often utilizing dynamic pricing and superior guest experiences.
- Strong performing properties (Top 25%) earn $1,917 or more, indicating effective management and desirable locations/amenities.
- Typical properties (Median) generate around $1,028 per month, representing the average market performance.
- Entry-level properties (Bottom 25%) see earnings around $440, often with potential for optimization.
Average Monthly Airbnb Earnings Trend in Ula
Ula Airbnb Occupancy Rate Trends (2026)
Maximize your bookings by understanding the Ula STR occupancy trends. Seasonal demand shifts significantly influence how often properties are booked. Typically, Augustsees the highest demand (peak season occupancy), while December experiences the lowest (low season). Effective strategies, like adjusting minimum stays or offering promotions, can boost occupancy during slower periods. Here's how different property tiers perform in Ula:
- Best-in-class properties (Top 10%) achieve 64%+ occupancy, indicating high desirability and potentially optimized availability.
- Strong performing properties (Top 25%) maintain 40% or higher occupancy, suggesting good market fit and guest satisfaction.
- Typical properties (Median) have an occupancy rate around 23%.
- Entry-level properties (Bottom 25%) average 10% occupancy, potentially facing higher vacancy.
Average Monthly Occupancy Rate Trend in Ula
Average Daily Rate (ADR) Airbnb Trends in Ula (2026)
Effective short term rental pricing strategy in Ula involves understanding monthly ADR fluctuations. The Average Daily Rate (ADR) for Airbnb in Ula typically peaks in April and dips lowest during February. Leveraging Airbnb dynamic pricing tools or strategies based on this seasonality can significantly boost revenue. Here's a look at the typical nightly rates achieved:
- Best-in-class properties (Top 10%) command rates of $267+ per night, often due to premium features or locations.
- Strong performing properties (Top 25%) achieve nightly rates of $180 or more.
- Typical properties (Median) charge around $116 per night.
- Entry-level properties (Bottom 25%) earn around $78 per night.
Average Daily Rate (ADR) Trend by Month in Ula
Get Live Ula Market Intelligence 👇

Explore Real-time Analytics
Airbnb Seasonality Analysis & Trends in Ula (2026)
Peak Season (August, July, September)
- Revenue averages $2,851 per month
- Occupancy rates average 43.9%
- Daily rates average $160
Shoulder Season
- Revenue averages $1,169 per month
- Occupancy maintains around 25.4%
- Daily rates hold near $145
Low Season (January, February, December)
- Revenue drops to average $540 per month
- Occupancy decreases to average 19.8%
- Daily rates adjust to average $125
Seasonality Insights for Ula
- The Airbnb seasonality in Ula shows highly seasonal trends requiring careful strategy. While the sections above show seasonal averages, it's also insightful to look at the extremes:
- During the high season, the absolute peak month showcases Ula's highest earning potential, with monthly revenues capable of climbing to $3,658, occupancy reaching a high of 52.0%, and ADRs peaking at $180.
- Conversely, the slowest single month of the year, typically falling within the low season, marks the market's lowest point. In this month, revenue might dip to $464, occupancy could drop to 16.3%, and ADRs may adjust down to $120.
- Understanding both the seasonal averages and these monthly peaks and troughs in revenue, occupancy, and ADR is crucial for maximizing your Airbnb profit potential in Ula.
Seasonal Strategies for Maximizing Profit
- Peak Season: Maximize revenue through premium pricing and potentially longer minimum stays. Ensure high availability.
- Low Season: Offer competitive pricing, special promotions (e.g., extended stay discounts), and flexible cancellation policies. Target off-season travelers like remote workers or budget-conscious guests.
- Shoulder Seasons: Implement dynamic pricing that balances peak and low rates. Target weekend travelers or specific events. Offer slightly more flexible terms than peak season.
- Regularly analyze your own performance against these Ula seasonality benchmarks and adjust your pricing and availability strategy accordingly.
Best Areas for Airbnb Investment in Ula (2026)
Exploring the top neighborhoods for short-term rentals in Ula? This section highlights key areas, outlining why they are attractive for hosts and guests, along with notable local attractions. Consider these locations based on your target guest profile and investment strategy.
| Neighborhood / Area | Why Host Here? (Target Guests & Appeal) | Key Attractions & Landmarks |
|---|---|---|
| Ula Town Center | The heart of Ula, offering a mix of traditional and modern amenities. It's perfect for guests looking to explore the local culture while having easy access to shops and restaurants. | Ula Market, Local cafes, Historic sites, Nearby parks |
| Akyaka | A charming coastal village known for its stunning beach and unique architecture. Akyaka is popular among tourists seeking a relaxing getaway with plenty of natural beauty. | Akyaka Beach, Azmak River, Kite surfing, Nature trails, Restaurants by the river |
| Gökova Bay | Famous for its picturesque scenery and sailing opportunities. Akyaka's proximity to Gökova Bay makes it a sought-after spot for tourists who love outdoor activities and nature. | Gökova National Park, Sailing tours, Crystal-clear waters, Beaches, Hiking trails |
| Karacasöğüt | Known for its serene environment and beautiful nature, Karacasöğüt attracts those looking for tranquility and scenic views, perfect for a peaceful retreat. | Karacasöğüt Beach, Nature walks, Local restaurants, Cozy cafes, Breathtaking views |
| Ovacık | A peaceful residential area with easy access to beaches and nature. It appeals to families and groups seeking a relaxing holiday atmosphere. | Nearby beaches, Mountain views, Nature parks, Local dining options |
| Ula Nature Park | Ideal for eco-tourism and nature lovers, offering opportunities for hiking and exploring flora and fauna. It attracts guests looking for outdoor adventures. | Hiking trails, Picnic areas, Wildlife watching, Natural beauty |
| Çınaraltı | A scenic area along the coastline with beautiful views of the sea, perfect for romantic getaways and sunset views. | Coastal views, Quiet beaches, Local eateries, Sunset spots |
| Marmaris (nearby) | A bustling tourist hotspot known for its vibrant nightlife and beautiful marina. A popular choice for visitors looking for a mix of relaxation and entertainment. | Marmaris Marina, Nightclubs and bars, Shopping areas, Water sports, Boat trips |
Understanding Airbnb License Requirements & STR Laws in Ula (2026)
Yes, Ula, Muğla, Turkey enforces high STR regulations. Obtaining a license and ensuring compliance is almost certainly required according to current 2026 STR laws. Always verify the latest short term rental regulations and Airbnb license requirements directly with local government authorities for Ula to ensure full compliance before hosting.
(Source: AirROI data, 2026, based on 88% licensed listings)
Top Performing Airbnb Properties in Ula (2026)
Benchmark your potential! Explore examples of top-performing Airbnb properties in Ulabased on Trailing Twelve Month (TTM) revenue. Analyze their characteristics, revenue, occupancy rate, and ADR to understand what drives success in this market.
Villa on the hill
Entire Place • 4 bedrooms

Villa with Pool in Akyaka Şirinköy
Entire Place • 2 bedrooms

AKYAKA DREAM🎄
Entire Place • 4 bedrooms
Stone villa with sea view and private pool in Akyaka
Entire Place • 2 bedrooms

PINEHILL406 GROUND FLOOR 1+1 APARTMENT WITH GARDEN VIEW
Entire Place • 1 bedroom

The Fairy tale in Orange Garden (jacuzzi inside)
Entire Place • 1 bedroom
Note: Performance varies based on location, size, amenities, seasonality, and management quality. Data reflects the past 12 months.
Top Performing Airbnb Hosts in Ula (2026)
Learn from the best! This table showcases top-performing Airbnb hosts in Ula based on the number of properties managed and estimated total revenue over the past year. Analyze their scale and performance metrics.
| Host Name | Properties | Grossing Revenue | Stay Reviews | Avg Rating |
|---|---|---|---|---|
| Alpsuites | 23 | $266,877 | 351 | 4.80/5.0 |
| Verde Suites Akyaka | 11 | $242,088 | 519 | 4.83/5.0 |
| Tarık & Oksana | 3 | $82,879 | 495 | 4.95/5.0 |
| Gülnihal | 5 | $76,760 | 131 | 4.87/5.0 |
| Muammer | 2 | $61,101 | 91 | 5.00/5.0 |
| Belgin | 2 | $53,969 | 50 | 4.96/5.0 |
| Sefa | 2 | $52,751 | 85 | 4.96/5.0 |
| Vural | 1 | $52,071 | 47 | 4.85/5.0 |
| Arzu | 8 | $47,676 | 236 | 4.78/5.0 |
| Şeyda | 2 | $47,017 | 31 | 4.81/5.0 |
Analyzing the strategies of top hosts, such as their property selection, pricing, and guest communication, can offer valuable lessons for optimizing your own Airbnb operations in Ula.
Dive Deeper: Advanced Ula STR Market Data (2026)
Ready to unlock more insights? AirROI provides access to advanced metrics and comprehensive Airbnb data for Ula. Explore detailed analytics beyond this report to refine your investment strategy, optimize pricing, and maximize your vacation rental profits.
Explore Advanced MetricsUla Short-Term Rental Market Composition (2026): Property & Room Types
Room Type Distribution
Property Type Distribution
Market Composition Insights for Ula
- The Ula Airbnb market composition is heavily skewed towards Entire Home/Apt listings, which make up 89.2% of the 186 active rentals. This indicates strong guest preference for privacy and space.
- Looking at the property type distribution in Ula, House properties are the most common (54.3%), reflecting the local real estate landscape.
- Houses represent a significant 54.3% portion, catering likely to families or larger groups.
- The presence of 7% Hotel/Boutique listings indicates integration with traditional hospitality.
- Smaller segments like outdoor/unique, unique stays, others (combined 4.4%) offer potential for unique stay experiences.
Ula Airbnb Room Capacity Analysis (2026): Bedroom Distribution
Distribution of Listings by Number of Bedrooms
Room Capacity Insights for Ula
- The dominant room capacity in Ula is 1 bedroom listings, making up 33.9% of the market. This suggests a strong demand for properties suitable for couples or solo travelers.
- Together, 1 bedroom and 2 bedrooms properties represent 67.8% of the active Airbnb listings in Ula, indicating a high concentration in these sizes.
- A significant 28.5% of listings offer 3+ bedrooms, catering to larger groups and families seeking more space in Ula.
Ula Vacation Rental Guest Capacity Trends (2026)
Distribution of Listings by Guest Capacity
Guest Capacity Insights for Ula
- The most common guest capacity trend in Ula vacation rentals is listings accommodating 6 guests (20.4%). This suggests the primary traveler segment is likely larger groups.
- Properties designed for 6 guests and 4 guests dominate the Ula STR market, accounting for 38.1% of listings.
- 42.0% of properties accommodate 6+ guests, serving the market segment for larger families or group travel in Ula.
- On average, properties in Ula are equipped to host 4.8 guests.
Ula Airbnb Booking Patterns (2026): Available vs. Booked Days
Available Days Distribution
Booked Days Distribution
Booking Pattern Insights for Ula
- The most common availability pattern in Ula falls within the 271-366 days range, representing 83.9% of listings. This suggests many properties have significant open periods on their calendars.
- Approximately 96.8% of listings show high availability (181+ days open annually), indicating potential for increased bookings or specific owner usage patterns.
- For booked days, the 31-90 days range is most frequent in Ula (50%), reflecting common guest stay durations or potential owner blocking patterns.
- A notable 3.3% of properties secure long booking periods (181+ days booked per year), highlighting successful long-term rental strategies or significant owner usage.
Ula Airbnb Minimum Stay Requirements Analysis
Distribution of Listings by Minimum Night Requirement
1 Night
28 listings
15.1% of total
2 Nights
13 listings
7% of total
3 Nights
7 listings
3.8% of total
4-6 Nights
12 listings
6.5% of total
7-29 Nights
13 listings
7% of total
30+ Nights
113 listings
60.8% of total
Key Insights
- The most prevalent minimum stay requirement in Ula is 30+ Nights, adopted by 60.8% of listings. This highlights the market's preference for longer commitments.
- A significant segment (60.8%) caters to monthly stays (30+ nights) in Ula, pointing to opportunities in the extended-stay market.
Recommendations
- Align with the market by considering a 30+ Nights minimum stay, as 60.8% of Ula hosts use this setting.
- If feasible, allowing 1-night stays, especially midweek or during low season, could capture last-minute bookings, as only 15.1% currently do.
- Explore offering discounts for stays of 30+ nights to attract the 60.8% of the market seeking extended stays.
- Adjust minimum nights based on seasonality – potentially shorter during low season and longer during peak demand periods in Ula.
Ula Airbnb Cancellation Policy Trends Analysis (2026)
Limited
7 listings
3.8% of total
Flexible
37 listings
19.9% of total
Moderate
28 listings
15.1% of total
Firm
78 listings
41.9% of total
Strict
36 listings
19.4% of total
Cancellation Policy Insights for Ula
- The prevailing Airbnb cancellation policy trend in Ula is Firm, used by 41.9% of listings.
- A majority (61.3%) of hosts in Ula utilize Firm or Strict policies, indicating a market where hosts prioritize booking security.
Recommendations for Hosts
- Consider adopting a Firm policy to align with the 41.9% market standard in Ula.
- Regularly review your cancellation policy against competitors and market demand shifts in Ula.
Ula STR Booking Lead Time Analysis (2026)
Average Booking Lead Time by Month
Booking Lead Time Insights for Ula
- The overall average booking lead time for vacation rentals in Ula is 33 days.
- Guests book furthest in advance for stays during August (average 43 days), likely coinciding with peak travel demand or local events.
- The shortest booking windows occur for stays in March (average 9 days), indicating more last-minute travel plans during this time.
- Seasonally, Summer (40 days avg.) sees the longest lead times, while Winter (15 days avg.) has the shortest, reflecting typical travel planning cycles.
Recommendations for Hosts
- Use the overall average lead time (33 days) as a baseline for your pricing and availability strategy in Ula.
- During March, focus on last-minute booking availability and promotions, as guests book with very short notice (9 days avg.).
- Target marketing efforts for the Summer season well in advance (at least 40 days) to capture early planners.
- Monitor your own booking lead times against these Ula averages to identify opportunities for dynamic pricing adjustments.
Popular & Essential Airbnb Amenities in Ula (2026)
Amenity Prevalence
Amenity Insights for Ula
- Essential amenities in Ula that guests expect include: Air conditioning. Lacking these (this) could significantly impact bookings.
- Popular amenities like Wifi, TV, Kitchen are common but not universal. Offering these can provide a competitive edge.
- Warning: Wifi is not universally provided but is considered essential globally. Ensure reliable Wifi is offered.
Recommendations for Hosts
- Ensure your listing includes all essential amenities for Ula: Air conditioning.
- Prioritize adding missing essentials: Air conditioning.
- Consider adding popular differentiators like Wifi or TV to increase appeal.
- Highlight unique or less common amenities you offer (e.g., hot tub, dedicated workspace, EV charger) in your listing description and photos.
- Regularly check competitor amenities in Ula to stay competitive.
Ula Airbnb Guest Demographics & Profile Analysis (2026)
Guest Profile Summary for Ula
- The typical guest profile for Airbnb in Ula consists of predominantly international visitors (68%), with top international origins including Türkiye, typically belonging to the Post-2000s (Gen Z/Alpha) group (50%), primarily speaking English or Turkish.
- Domestic travelers account for 32.4% of guests.
- Key international markets include Turkey (32.4%) and Türkiye (31.2%).
- Top languages spoken are English (41.8%) followed by Turkish (34.9%).
- A significant demographic segment is the Post-2000s (Gen Z/Alpha) group, representing 50% of guests.
Recommendations for Hosts
- Focus marketing internationally, particularly towards travelers from Türkiye.
- Tailor amenities and listing descriptions to appeal to the dominant Post-2000s (Gen Z/Alpha) demographic (e.g., highlight fast WiFi, smart home features, local guides).
- Highlight unique local experiences or amenities relevant to the primary guest profile.
- Consider seasonal promotions aligned with peak travel times for key origin markets.
Nearby Short-Term Rental Market Comparison
How does the Ula Airbnb market stack up against its neighbors? Compare key performance metrics like average monthly revenue, ADR, and occupancy rates in surrounding areas to understand the broader regional STR landscape.
| Market | Active Properties | Monthly Revenue | Daily Rate | Avg. Occupancy |
|---|---|---|---|---|
| Μάσαρη | 23 | $2,949 | $260.24 | 50% |
| Kalathos | 53 | $2,908 | $304.93 | 50% |
| Municipality of Rhodes | 440 | $2,455 | $280.73 | 46% |
| Lagoudi | 11 | $2,368 | $213.89 | 48% |
| Μαριτσά | 12 | $2,358 | $252.72 | 45% |
| Fanes | 24 | $2,255 | $252.48 | 41% |
| Lardos | 25 | $2,180 | $274.26 | 45% |
| Kolymbia | 134 | $2,156 | $236.46 | 48% |
| Lindos | 272 | $2,147 | $276.11 | 47% |
| Soroni | 32 | $1,995 | $210.73 | 54% |