Bishopston Airbnb Market Analysis 2026: Short Term Rental Data & Vacation Rental Statistics in Wales, United Kingdom
Is Airbnb profitable in Bishopston in 2026? Explore comprehensive Airbnb analytics for Bishopston, Wales, United Kingdom to uncover income potential. This 2026 STR market report for Bishopston, based on AirROI data from February 2025 to January 2026, reveals key trends in the niche market of 19 active listings.
Whether you're considering an Airbnb investment in Bishopston, optimizing your existing vacation rental, or exploring rental arbitrage opportunities, understanding the Bishopston Airbnb data is crucial. Leveraging the low regulation environment is key to maximizing your short term rental income potential. Let's dive into the specifics.
Key Bishopston Airbnb Performance Metrics Overview
Monthly Airbnb Revenue Variations & Income Potential in Bishopston (2026)
Understanding the monthly revenue variations for Airbnb listings in Bishopston is key to maximizing your short term rental income potential. Seasonality significantly impacts earnings. Our analysis, based on data from the past 12 months, shows that the peak revenue month for STRs in Bishopston is typically August, while January often presents the lowest earnings, highlighting opportunities for strategic pricing adjustments during shoulder and low seasons. Explore the typical Airbnb income in Bishopston across different performance tiers:
- Best-in-class properties (Top 10%) achieve $5,500+ monthly, often utilizing dynamic pricing and superior guest experiences.
- Strong performing properties (Top 25%) earn $2,891 or more, indicating effective management and desirable locations/amenities.
- Typical properties (Median) generate around $1,643 per month, representing the average market performance.
- Entry-level properties (Bottom 25%) see earnings around $674, often with potential for optimization.
Average Monthly Airbnb Earnings Trend in Bishopston
Bishopston Airbnb Occupancy Rate Trends (2026)
Maximize your bookings by understanding the Bishopston STR occupancy trends. Seasonal demand shifts significantly influence how often properties are booked. Typically, Augustsees the highest demand (peak season occupancy), while January experiences the lowest (low season). Effective strategies, like adjusting minimum stays or offering promotions, can boost occupancy during slower periods. Here's how different property tiers perform in Bishopston:
- Best-in-class properties (Top 10%) achieve 67%+ occupancy, indicating high desirability and potentially optimized availability.
- Strong performing properties (Top 25%) maintain 51% or higher occupancy, suggesting good market fit and guest satisfaction.
- Typical properties (Median) have an occupancy rate around 31%.
- Entry-level properties (Bottom 25%) average 16% occupancy, potentially facing higher vacancy.
Average Monthly Occupancy Rate Trend in Bishopston
Average Daily Rate (ADR) Airbnb Trends in Bishopston (2026)
Effective short term rental pricing strategy in Bishopston involves understanding monthly ADR fluctuations. The Average Daily Rate (ADR) for Airbnb in Bishopston typically peaks in July and dips lowest during March. Leveraging Airbnb dynamic pricing tools or strategies based on this seasonality can significantly boost revenue. Here's a look at the typical nightly rates achieved:
- Best-in-class properties (Top 10%) command rates of $321+ per night, often due to premium features or locations.
- Strong performing properties (Top 25%) achieve nightly rates of $253 or more.
- Typical properties (Median) charge around $140 per night.
- Entry-level properties (Bottom 25%) earn around $107 per night.
Average Daily Rate (ADR) Trend by Month in Bishopston
Get Live Bishopston Market Intelligence 👇
Explore Real-time Analytics
Airbnb Seasonality Analysis & Trends in Bishopston (2026)
Peak Season (August, July, September)
- Revenue averages $3,789 per month
- Occupancy rates average 52.5%
- Daily rates average $194
Shoulder Season
- Revenue averages $1,989 per month
- Occupancy maintains around 33.2%
- Daily rates hold near $191
Low Season (January, February, November)
- Revenue drops to average $1,113 per month
- Occupancy decreases to average 22.9%
- Daily rates adjust to average $186
Seasonality Insights for Bishopston
- The Airbnb seasonality in Bishopston shows highly seasonal trends requiring careful strategy. While the sections above show seasonal averages, it's also insightful to look at the extremes:
- During the high season, the absolute peak month showcases Bishopston's highest earning potential, with monthly revenues capable of climbing to $4,726, occupancy reaching a high of 63.3%, and ADRs peaking at $211.
- Conversely, the slowest single month of the year, typically falling within the low season, marks the market's lowest point. In this month, revenue might dip to $867, occupancy could drop to 13.8%, and ADRs may adjust down to $178.
- Understanding both the seasonal averages and these monthly peaks and troughs in revenue, occupancy, and ADR is crucial for maximizing your Airbnb profit potential in Bishopston.
Seasonal Strategies for Maximizing Profit
- Peak Season: Maximize revenue through premium pricing and potentially longer minimum stays. Ensure high availability.
- Low Season: Offer competitive pricing, special promotions (e.g., extended stay discounts), and flexible cancellation policies. Target off-season travelers like remote workers or budget-conscious guests.
- Shoulder Seasons: Implement dynamic pricing that balances peak and low rates. Target weekend travelers or specific events. Offer slightly more flexible terms than peak season.
- Regularly analyze your own performance against these Bishopston seasonality benchmarks and adjust your pricing and availability strategy accordingly.
Best Areas for Airbnb Investment in Bishopston (2026)
Exploring the top neighborhoods for short-term rentals in Bishopston? This section highlights key areas, outlining why they are attractive for hosts and guests, along with notable local attractions. Consider these locations based on your target guest profile and investment strategy.
| Neighborhood / Area | Why Host Here? (Target Guests & Appeal) | Key Attractions & Landmarks |
|---|---|---|
| Gloucester Road | A bustling street known for its shops, cafes, and restaurants, making it a prime location for both tourists and locals. Easy access to public transport and nearby attractions. | Bishopston Library, The Bristol Lido, Local boutiques, Cafés and eateries, Public parks |
| Bishopston Beach | A stunning beach area that attracts tourists looking for a seaside experience. Great for families and beach lovers, providing a relaxing getaway. | Bishopston Promenade, Beachside cafes, Coastal walks, Water sports, Sand dunes |
| Cleveland Pools | An historic bathing site that's popular with both locals and visitors. It's a unique attraction that adds a cultural touch to any stay in the area. | Historic swimming pool, Natural setting, Walking trails, Picnic areas, Local wildlife |
| St. Andrews Park | A beautiful park that provides a great space for relaxation and activities. It's near local shops and cafes, making it an attractive area for both visitors and residents. | Green spaces, Playgrounds, Wooden sculptures, Community events, Walking paths |
| Thornbury Road | A quieter residential area that's close to the city center. It's ideal for guests looking for a peaceful yet convenient base while visiting Bristol. | Local shops, Cafés, Community center, Play areas, Public transport links |
| Clifton Village | A picturesque area known for its stunning architecture and proximity to the iconic Clifton Suspension Bridge. It's well-loved by tourists and provides numerous leisurely activities. | Clifton Suspension Bridge, The Observatory, Cafes and restaurants, Shopping streets, Art galleries |
| Bristol Zoo Gardens | A family-friendly area with a focus on wildlife and conservation. It attracts family visitors and is a fun place for all ages. | Bristol Zoo, Gardens, Animal encounters, Kids play area, Educational programs |
| Whiteladies Road | A vibrant street with a mix of shops, cafes, and bars, popular among students and young professionals. It's a lively area that attracts both locals and visitors. | Diverse eateries, Live music venues, Boutique shops, Cinema, Local events |
Understanding Airbnb License Requirements & STR Laws in Bishopston (2026)
While Bishopston, Wales, United Kingdom currently shows low STR regulations, specific Airbnb license requirements might still exist or change. Always verify the latest short term rental regulations and Airbnb license requirements directly with local government authorities for Bishopston to ensure full compliance before hosting.
(Source: AirROI data, 2026, finding no licensed listings among those analyzed)
Top Performing Airbnb Properties in Bishopston (2026)
Benchmark your potential! Explore examples of top-performing Airbnb properties in Bishopstonbased on Trailing Twelve Month (TTM) revenue. Analyze their characteristics, revenue, occupancy rate, and ADR to understand what drives success in this market.
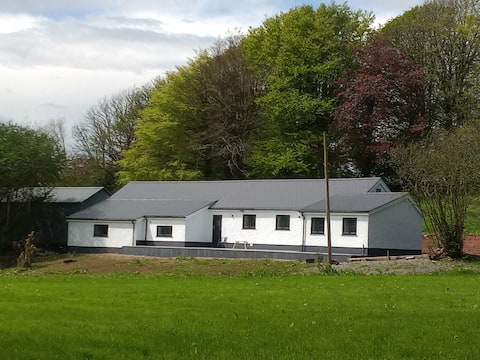
Vineyard Barns - The Dairy
Entire Place • 5 bedrooms

Lovely Gower home, close to beaches
Entire Place • 3 bedrooms

3 Bed in Bishopston (oc-b31136)
Entire Place • 3 bedrooms

Ortari @70, Bishopston, Gower, Swansea
Entire Place • 1 bedroom

“Brandy Cwtch” Self-contained bungalow.
Entire Place • 1 bedroom

Gorgeous Gower Bungalow. Beautiful beaches nearby.
Entire Place • 3 bedrooms
Note: Performance varies based on location, size, amenities, seasonality, and management quality. Data reflects the past 12 months.
Top Performing Airbnb Hosts in Bishopston (2026)
Learn from the best! This table showcases top-performing Airbnb hosts in Bishopston based on the number of properties managed and estimated total revenue over the past year. Analyze their scale and performance metrics.
| Host Name | Properties | Grossing Revenue | Stay Reviews | Avg Rating |
|---|---|---|---|---|
| Shell | 2 | $77,558 | 11 | 4.90/5.0 |
| Sonja | 1 | $48,685 | 140 | 4.90/5.0 |
| Stay Gower | 2 | $29,652 | 23 | 4.48/5.0 |
| Wales Cottage Holidays | 1 | $26,749 | 2 | Not Rated |
| David | 1 | $25,686 | 158 | 4.95/5.0 |
| Home From Home | 2 | $24,605 | 3 | Not Rated |
| Rachel | 1 | $24,395 | 152 | 4.94/5.0 |
| Aimee | 1 | $23,201 | 51 | 4.71/5.0 |
| Lisa | 1 | $17,970 | 64 | 4.95/5.0 |
| Peter | 2 | $13,219 | 17 | 5.00/5.0 |
Analyzing the strategies of top hosts, such as their property selection, pricing, and guest communication, can offer valuable lessons for optimizing your own Airbnb operations in Bishopston.
Dive Deeper: Advanced Bishopston STR Market Data (2026)
Ready to unlock more insights? AirROI provides access to advanced metrics and comprehensive Airbnb data for Bishopston. Explore detailed analytics beyond this report to refine your investment strategy, optimize pricing, and maximize your vacation rental profits.
Explore Advanced MetricsBishopston Short-Term Rental Market Composition (2026): Property & Room Types
Room Type Distribution
Property Type Distribution
Market Composition Insights for Bishopston
- The Bishopston Airbnb market composition is heavily skewed towards Entire Home/Apt listings, which make up 78.9% of the 19 active rentals. This indicates strong guest preference for privacy and space.
- Looking at the property type distribution in Bishopston, House properties are the most common (57.9%), reflecting the local real estate landscape.
- Houses represent a significant 57.9% portion, catering likely to families or larger groups.
Bishopston Airbnb Room Capacity Analysis (2026): Bedroom Distribution
Distribution of Listings by Number of Bedrooms
Room Capacity Insights for Bishopston
- The dominant room capacity in Bishopston is 3 bedrooms listings, making up 26.3% of the market. This suggests a strong demand for properties suitable for families or small groups.
- Together, 3 bedrooms and 1 bedroom properties represent 52.6% of the active Airbnb listings in Bishopston, indicating a high concentration in these sizes.
- A significant 36.9% of listings offer 3+ bedrooms, catering to larger groups and families seeking more space in Bishopston.
Bishopston Vacation Rental Guest Capacity Trends (2026)
Distribution of Listings by Guest Capacity
Guest Capacity Insights for Bishopston
- The most common guest capacity trend in Bishopston vacation rentals is listings accommodating 2 guests (26.3%). This suggests the primary traveler segment is likely couples or solo travelers.
- Properties designed for 2 guests and 4 guests dominate the Bishopston STR market, accounting for 42.1% of listings.
- 26.4% of properties accommodate 6+ guests, serving the market segment for larger families or group travel in Bishopston.
- On average, properties in Bishopston are equipped to host 3.3 guests.
Bishopston Airbnb Booking Patterns (2026): Available vs. Booked Days
Available Days Distribution
Booked Days Distribution
Booking Pattern Insights for Bishopston
- The most common availability pattern in Bishopston falls within the 271-366 days range, representing 73.7% of listings. This suggests many properties have significant open periods on their calendars.
- Approximately 84.2% of listings show high availability (181+ days open annually), indicating potential for increased bookings or specific owner usage patterns.
- For booked days, the 31-90 days range is most frequent in Bishopston (57.9%), reflecting common guest stay durations or potential owner blocking patterns.
- A notable 15.8% of properties secure long booking periods (181+ days booked per year), highlighting successful long-term rental strategies or significant owner usage.
Bishopston Airbnb Minimum Stay Requirements Analysis
Distribution of Listings by Minimum Night Requirement
1 Night
2 listings
10.5% of total
2 Nights
2 listings
10.5% of total
3 Nights
4 listings
21.1% of total
7-29 Nights
3 listings
15.8% of total
30+ Nights
8 listings
42.1% of total
Key Insights
- The most prevalent minimum stay requirement in Bishopston is 30+ Nights, adopted by 42.1% of listings. This highlights the market's preference for longer commitments.
- A significant segment (42.1%) caters to monthly stays (30+ nights) in Bishopston, pointing to opportunities in the extended-stay market.
Recommendations
- Align with the market by considering a 30+ Nights minimum stay, as 42.1% of Bishopston hosts use this setting.
- If feasible, allowing 1-night stays, especially midweek or during low season, could capture last-minute bookings, as only 10.5% currently do.
- Explore offering discounts for stays of 30+ nights to attract the 42.1% of the market seeking extended stays.
- Adjust minimum nights based on seasonality – potentially shorter during low season and longer during peak demand periods in Bishopston.
Bishopston Airbnb Cancellation Policy Trends Analysis (2026)
Super Strict 30 Days
2 listings
10.5% of total
Super Strict 60 Days
3 listings
15.8% of total
Flexible
2 listings
10.5% of total
Moderate
4 listings
21.1% of total
Firm
6 listings
31.6% of total
Strict
2 listings
10.5% of total
Cancellation Policy Insights for Bishopston
- The prevailing Airbnb cancellation policy trend in Bishopston is Firm, used by 31.6% of listings.
- There's a relatively balanced mix between guest-friendly (31.6%) and stricter (42.1%) policies, offering choices for different guest needs.
Recommendations for Hosts
- Consider adopting a Firm policy to align with the 31.6% market standard in Bishopston.
- Using a Strict policy might deter some guests, as only 10.5% of listings use it. Evaluate if potential revenue protection outweighs possible lower booking rates.
- Regularly review your cancellation policy against competitors and market demand shifts in Bishopston.
Bishopston STR Booking Lead Time Analysis (2026)
Average Booking Lead Time by Month
Booking Lead Time Insights for Bishopston
- The overall average booking lead time for vacation rentals in Bishopston is 47 days.
- Guests book furthest in advance for stays during December (average 86 days), likely coinciding with peak travel demand or local events.
- The shortest booking windows occur for stays in January (average 9 days), indicating more last-minute travel plans during this time.
- Seasonally, Summer (66 days avg.) sees the longest lead times, while Winter (36 days avg.) has the shortest, reflecting typical travel planning cycles.
Recommendations for Hosts
- Use the overall average lead time (47 days) as a baseline for your pricing and availability strategy in Bishopston.
- For December stays, consider implementing length-of-stay discounts or slightly higher rates for bookings made less than 86 days out to capitalize on advance planning.
- During January, focus on last-minute booking availability and promotions, as guests book with very short notice (9 days avg.).
- Target marketing efforts for the Summer season well in advance (at least 66 days) to capture early planners.
- Monitor your own booking lead times against these Bishopston averages to identify opportunities for dynamic pricing adjustments.
Popular & Essential Airbnb Amenities in Bishopston (2026)
Amenity Prevalence
Amenity Insights for Bishopston
- Essential amenities in Bishopston that guests expect include: Smoke alarm, Heating. Lacking these (any) could significantly impact bookings.
- Popular amenities like Wifi, TV, Bed linens are common but not universal. Offering these can provide a competitive edge.
- Warning: Wifi is not universally provided but is considered essential globally. Ensure reliable Wifi is offered.
Recommendations for Hosts
- Ensure your listing includes all essential amenities for Bishopston: Smoke alarm, Heating.
- Consider adding popular differentiators like Wifi or TV to increase appeal.
- Highlight unique or less common amenities you offer (e.g., hot tub, dedicated workspace, EV charger) in your listing description and photos.
- Regularly check competitor amenities in Bishopston to stay competitive.
Bishopston Airbnb Guest Demographics & Profile Analysis (2026)
Guest Profile Summary for Bishopston
- The typical guest profile for Airbnb in Bishopston consists of primarily domestic travelers (93%), often arriving from nearby England, typically belonging to the Post-2000s (Gen Z/Alpha) group (50%), primarily speaking English or Spanish.
- Domestic travelers account for 92.6% of guests.
- Key international markets include United Kingdom (92.6%) and Belgium (1.5%).
- Top languages spoken are English (45.2%) followed by Spanish (16.1%).
- A significant demographic segment is the Post-2000s (Gen Z/Alpha) group, representing 50% of guests.
Recommendations for Hosts
- Target domestic marketing efforts towards travelers from England and London.
- Tailor amenities and listing descriptions to appeal to the dominant Post-2000s (Gen Z/Alpha) demographic (e.g., highlight fast WiFi, smart home features, local guides).
- Highlight unique local experiences or amenities relevant to the primary guest profile.
- Consider seasonal promotions aligned with peak travel times for key origin markets.
Nearby Short-Term Rental Market Comparison
How does the Bishopston Airbnb market stack up against its neighbors? Compare key performance metrics like average monthly revenue, ADR, and occupancy rates in surrounding areas to understand the broader regional STR landscape.
| Market | Active Properties | Monthly Revenue | Daily Rate | Avg. Occupancy |
|---|---|---|---|---|
| Angle | 13 | $6,069 | $626.63 | 50% |
| Bont-dolgadfan | 10 | $5,458 | $293.24 | 58% |
| Milverton | 10 | $5,067 | $377.17 | 48% |
| Southerndown | 16 | $5,064 | $409.45 | 46% |
| Southgate | 13 | $4,781 | $282.69 | 56% |
| Bridgwater | 18 | $4,662 | $355.91 | 53% |
| Crai | 31 | $4,496 | $552.02 | 38% |
| Penmorfa | 19 | $4,330 | $454.12 | 46% |
| New Polzeath | 17 | $4,089 | $281.24 | 54% |
| Llantrisant | 15 | $4,086 | $275.56 | 44% |