Bryngwran Airbnb Market Analysis 2025: Short Term Rental Data & Vacation Rental Statistics in Wales, United Kingdom
Is Airbnb profitable in Bryngwran in 2025? Explore comprehensive Airbnb analytics for Bryngwran, Wales, United Kingdom to uncover income potential. This 2025 STR market report for Bryngwran, based on AirROI data from June 2024 to May 2025, reveals key trends in the niche market of 18 active listings.
Whether you're considering an Airbnb investment in Bryngwran, optimizing your existing vacation rental, or exploring rental arbitrage opportunities, understanding the Bryngwran Airbnb data is crucial. Leveraging the low regulation environment is key to maximizing your short term rental income potential. Let's dive into the specifics.
Key Bryngwran Airbnb Performance Metrics Overview
Monthly Airbnb Revenue Variations & Income Potential in Bryngwran (2025)
Understanding the monthly revenue variations for Airbnb listings in Bryngwran is key to maximizing your short term rental income potential. Seasonality significantly impacts earnings. Our analysis, based on data from the past 12 months, shows that the peak revenue month for STRs in Bryngwran is typically August, while January often presents the lowest earnings, highlighting opportunities for strategic pricing adjustments during shoulder and low seasons. Explore the typical Airbnb income in Bryngwran across different performance tiers:
- Best-in-class properties (Top 10%) achieve $3,430+ monthly, often utilizing dynamic pricing and superior guest experiences.
- Strong performing properties (Top 25%) earn $2,118 or more, indicating effective management and desirable locations/amenities.
- Typical properties (Median) generate around $1,376 per month, representing the average market performance.
- Entry-level properties (Bottom 25%) see earnings around $886, often with potential for optimization.
Average Monthly Airbnb Earnings Trend in Bryngwran
Bryngwran Airbnb Occupancy Rate Trends (2025)
Maximize your bookings by understanding the Bryngwran STR occupancy trends. Seasonal demand shifts significantly influence how often properties are booked. Typically, Augustsees the highest demand (peak season occupancy), while January experiences the lowest (low season). Effective strategies, like adjusting minimum stays or offering promotions, can boost occupancy during slower periods. Here's how different property tiers perform in Bryngwran:
- Best-in-class properties (Top 10%) achieve 71%+ occupancy, indicating high desirability and potentially optimized availability.
- Strong performing properties (Top 25%) maintain 49% or higher occupancy, suggesting good market fit and guest satisfaction.
- Typical properties (Median) have an occupancy rate around 34%.
- Entry-level properties (Bottom 25%) average 21% occupancy, potentially facing higher vacancy.
Average Monthly Occupancy Rate Trend in Bryngwran
Average Daily Rate (ADR) Airbnb Trends in Bryngwran (2025)
Effective short term rental pricing strategy in Bryngwran involves understanding monthly ADR fluctuations. The Average Daily Rate (ADR) for Airbnb in Bryngwran typically peaks in May and dips lowest during November. Leveraging Airbnb dynamic pricing tools or strategies based on this seasonality can significantly boost revenue. Here's a look at the typical nightly rates achieved:
- Best-in-class properties (Top 10%) command rates of $520+ per night, often due to premium features or locations.
- Strong performing properties (Top 25%) achieve nightly rates of $293 or more.
- Typical properties (Median) charge around $132 per night.
- Entry-level properties (Bottom 25%) earn around $105 per night.
Average Daily Rate (ADR) Trend by Month in Bryngwran
Get Live Bryngwran Market Intelligence 👇

Explore Real-time Analytics
Airbnb Seasonality Analysis & Trends in Bryngwran (2025)
Peak Season (August, May, July)
- Revenue averages $2,532 per month
- Occupancy rates average 54.4%
- Daily rates average $220
Shoulder Season
- Revenue averages $1,590 per month
- Occupancy maintains around 37.8%
- Daily rates hold near $222
Low Season (January, November, December)
- Revenue drops to average $967 per month
- Occupancy decreases to average 17.6%
- Daily rates adjust to average $201
Seasonality Insights for Bryngwran
- The Airbnb seasonality in Bryngwran shows highly seasonal trends requiring careful strategy. While the sections above show seasonal averages, it's also insightful to look at the extremes:
- During the high season, the absolute peak month showcases Bryngwran's highest earning potential, with monthly revenues capable of climbing to $2,947, occupancy reaching a high of 71.3%, and ADRs peaking at $289.
- Conversely, the slowest single month of the year, typically falling within the low season, marks the market's lowest point. In this month, revenue might dip to $696, occupancy could drop to 13.6%, and ADRs may adjust down to $177.
- Understanding both the seasonal averages and these monthly peaks and troughs in revenue, occupancy, and ADR is crucial for maximizing your Airbnb profit potential in Bryngwran.
Seasonal Strategies for Maximizing Profit
- Peak Season: Maximize revenue through premium pricing and potentially longer minimum stays. Ensure high availability.
- Low Season: Offer competitive pricing, special promotions (e.g., extended stay discounts), and flexible cancellation policies. Target off-season travelers like remote workers or budget-conscious guests.
- Shoulder Seasons: Implement dynamic pricing that balances peak and low rates. Target weekend travelers or specific events. Offer slightly more flexible terms than peak season.
- Regularly analyze your own performance against these Bryngwran seasonality benchmarks and adjust your pricing and availability strategy accordingly.
Best Areas for Airbnb Investment in Bryngwran (2025)
Exploring the top neighborhoods for short-term rentals in Bryngwran? This section highlights key areas, outlining why they are attractive for hosts and guests, along with notable local attractions. Consider these locations based on your target guest profile and investment strategy.
| Neighborhood / Area | Why Host Here? (Target Guests & Appeal) | Key Attractions & Landmarks |
|---|---|---|
| South Beach | Iconic Miami Beach neighborhood known for its Art Deco architecture and vibrant nightlife. Prime location for tourists seeking the quintessential Miami experience with direct beach access and endless entertainment options. | Art Deco Historic District, Ocean Drive, Lummus Park Beach, Lincoln Road Mall, Española Way, Miami Beach Boardwalk |
| Brickell | Miami's modern financial district with luxury high-rises and upscale amenities. Popular with business travelers and those seeking an urban luxury experience with easy access to downtown. | Brickell City Centre, Mary Brickell Village, Miami River restaurants, Brickell Key, Simpson Park |
| Wynwood | Trendy arts district known for its colorful murals and hipster culture. Attracts young professionals and creative types looking for a unique, cultural experience. | Wynwood Walls, art galleries, craft breweries, Wynwood Art Walk, trendy restaurants and bars |
| Bryngwran | A picturesque rural area in Anglesey, ideal for those seeking a quiet getaway and nature experiences. Attracts travelers interested in the scenic landscapes and local culture. | Anglesey Coastal Path, Newborough Beach, Criccieth Castle, Llanddwyn Island, National Trust Properties |
| Holyhead | Nearby port town with access to ferries and stunning coastal views. Great for travelers looking to explore the Isle of Anglesey and North Wales. | Holyhead Mountain, South Stack Lighthouse, St. Cybi's Church, Breakwater Country Park, Celtic Pleasure Boats |
| Beaumaris | A charming seaside town known for its historic castle and beautiful architecture. Great for visitors interested in history and coastal activities. | Beaumaris Castle, Victorian Pier, The Old Jail, Cerro Gordo Beach, Seashell Museum |
| Menai Bridge | A unique town situated on the Menai Strait, ideal for those looking to explore the stunning views and culinary scene of North Wales. | Menai Suspension Bridge, Plas Newydd House and Gardens, Anglesey Sea Zoo, Beaumaris Bay, Glynllifon Country Park |
| Llangefni | The market town at the center of Anglesey, offering local shops and a taste of Welsh culture. Perfect for an authentic experience on the island. | Oriel Môn, Llynnon Mill, Llangefni River, The Church of St. Mary, Anglesey Agricultural Show |
Understanding Airbnb License Requirements & STR Laws in Bryngwran (2025)
While Bryngwran, Wales, United Kingdom currently shows low STR regulations, specific Airbnb license requirements might still exist or change. Always verify the latest short term rental regulations and Airbnb license requirements directly with local government authorities for Bryngwran to ensure full compliance before hosting.
(Source: AirROI data, 2025, finding no licensed listings among those analyzed)
Top Performing Airbnb Properties in Bryngwran (2025)
Benchmark your potential! Explore examples of top-performing Airbnb properties in Bryngwranbased on Trailing Twelve Month (TTM) revenue. Analyze their characteristics, revenue, occupancy rate, and ADR to understand what drives success in this market.
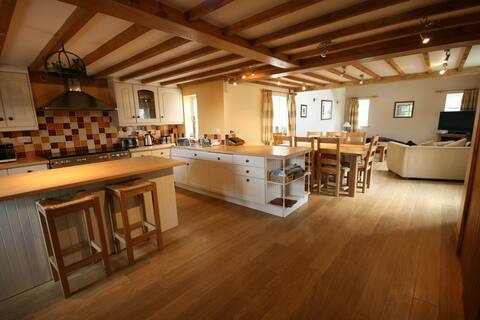
Watermill Cottage Sleeps 8 Dog friendly Anglesey
Entire Place • 4 bedrooms

Lakeside Cabin with Outdoor Bath Secluded Off Grid
Entire Place • 1 bedroom
Escape To The Chapel
Entire Place • 3 bedrooms

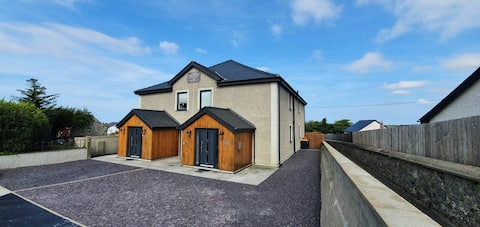
The Old Stables
Entire Place • 3 bedrooms

Trewan Cottage near Rhosneigr
Entire Place • 2 bedrooms
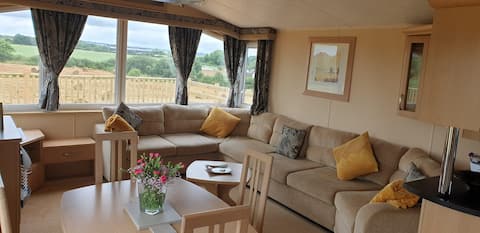
MountainView Holiday Home Private location sleeps6
Entire Place • 2 bedrooms
Note: Performance varies based on location, size, amenities, seasonality, and management quality. Data reflects the past 12 months.
Top Performing Airbnb Hosts in Bryngwran (2025)
Learn from the best! This table showcases top-performing Airbnb hosts in Bryngwran based on the number of properties managed and estimated total revenue over the past year. Analyze their scale and performance metrics.
| Host Name | Properties | Grossing Revenue | Stay Reviews | Avg Rating |
|---|---|---|---|---|
| Alison | 2 | $53,413 | 46 | 4.87/5.0 |
| Fiona | 3 | $47,803 | 266 | 4.92/5.0 |
| Anna | 1 | $26,627 | 34 | 5.00/5.0 |
| Bronwen | 1 | $24,301 | 62 | 5.00/5.0 |
| Paul | 1 | $20,605 | 188 | 4.92/5.0 |
| Christopher | 1 | $19,047 | 42 | 4.98/5.0 |
| Boltholes And Hideaways | 4 | $17,622 | 4 | Not Rated |
| Barbara | 2 | $17,273 | 167 | 4.88/5.0 |
| Cottages | 1 | $15,161 | 3 | 4.67/5.0 |
| Deborah | 1 | $8,802 | 105 | 4.98/5.0 |
Analyzing the strategies of top hosts, such as their property selection, pricing, and guest communication, can offer valuable lessons for optimizing your own Airbnb operations in Bryngwran.
Dive Deeper: Advanced Bryngwran STR Market Data (2025)
Ready to unlock more insights? AirROI provides access to advanced metrics and comprehensive Airbnb data for Bryngwran. Explore detailed analytics beyond this report to refine your investment strategy, optimize pricing, and maximize your vacation rental profits.
Explore Advanced MetricsBryngwran Short-Term Rental Market Composition (2025): Property & Room Types
Room Type Distribution
Property Type Distribution
Market Composition Insights for Bryngwran
- The Bryngwran Airbnb market composition is heavily skewed towards Entire Home/Apt listings, which make up 100% of the 18 active rentals. This indicates strong guest preference for privacy and space.
- Looking at the property type distribution in Bryngwran, House properties are the most common (66.7%), reflecting the local real estate landscape.
- Houses represent a significant 66.7% portion, catering likely to families or larger groups.
- The presence of 5.6% Hotel/Boutique listings indicates integration with traditional hospitality.
Bryngwran Airbnb Room Capacity Analysis (2025): Bedroom Distribution
Distribution of Listings by Number of Bedrooms
Room Capacity Insights for Bryngwran
- The dominant room capacity in Bryngwran is 2 bedrooms listings, making up 50% of the market. This suggests a strong demand for properties suitable for couples or solo travelers.
- Together, 2 bedrooms and 1 bedroom properties represent 72.2% of the active Airbnb listings in Bryngwran, indicating a high concentration in these sizes.
- A significant 27.8% of listings offer 3+ bedrooms, catering to larger groups and families seeking more space in Bryngwran.
Bryngwran Vacation Rental Guest Capacity Trends (2025)
Distribution of Listings by Guest Capacity
Guest Capacity Insights for Bryngwran
- The most common guest capacity trend in Bryngwran vacation rentals is listings accommodating 4 guests (38.9%). This suggests the primary traveler segment is likely small families or groups.
- Properties designed for 4 guests and 6 guests dominate the Bryngwran STR market, accounting for 55.6% of listings.
- 33.4% of properties accommodate 6+ guests, serving the market segment for larger families or group travel in Bryngwran.
- On average, properties in Bryngwran are equipped to host 4.9 guests.
Bryngwran Airbnb Booking Patterns (2025): Available vs. Booked Days
Available Days Distribution
Booked Days Distribution
Booking Pattern Insights for Bryngwran
- The most common availability pattern in Bryngwran falls within the 181-270 days range, representing 55.6% of listings. This suggests many properties have significant open periods on their calendars.
- Approximately 88.9% of listings show high availability (181+ days open annually), indicating potential for increased bookings or specific owner usage patterns.
- For booked days, the 91-180 days range is most frequent in Bryngwran (55.6%), reflecting common guest stay durations or potential owner blocking patterns.
- A notable 11.1% of properties secure long booking periods (181+ days booked per year), highlighting successful long-term rental strategies or significant owner usage.
Bryngwran Airbnb Minimum Stay Requirements Analysis
Distribution of Listings by Minimum Night Requirement
1 Night
3 listings
17.6% of total
2 Nights
3 listings
17.6% of total
3 Nights
2 listings
11.8% of total
4-6 Nights
1 listings
5.9% of total
30+ Nights
8 listings
47.1% of total
Key Insights
- The most prevalent minimum stay requirement in Bryngwran is 30+ Nights, adopted by 47.1% of listings. This highlights the market's preference for longer commitments.
- A significant segment (47.1%) caters to monthly stays (30+ nights) in Bryngwran, pointing to opportunities in the extended-stay market.
Recommendations
- Align with the market by considering a 30+ Nights minimum stay, as 47.1% of Bryngwran hosts use this setting.
- If feasible, allowing 1-night stays, especially midweek or during low season, could capture last-minute bookings, as only 17.6% currently do.
- Explore offering discounts for stays of 30+ nights to attract the 47.1% of the market seeking extended stays.
- Adjust minimum nights based on seasonality – potentially shorter during low season and longer during peak demand periods in Bryngwran.
Bryngwran Airbnb Cancellation Policy Trends Analysis (2025)
Super Strict 60 Days
5 listings
29.4% of total
Flexible
2 listings
11.8% of total
Moderate
2 listings
11.8% of total
Firm
4 listings
23.5% of total
Strict
4 listings
23.5% of total
Cancellation Policy Insights for Bryngwran
- The prevailing Airbnb cancellation policy trend in Bryngwran is Super Strict 60 Days, used by 29.4% of listings.
- There's a relatively balanced mix between guest-friendly (23.6%) and stricter (47.0%) policies, offering choices for different guest needs.
Recommendations for Hosts
- Consider adopting a Super Strict 60 Days policy to align with the 29.4% market standard in Bryngwran.
- Regularly review your cancellation policy against competitors and market demand shifts in Bryngwran.
Bryngwran STR Booking Lead Time Analysis (2025)
Average Booking Lead Time by Month
Booking Lead Time Insights for Bryngwran
- The overall average booking lead time for vacation rentals in Bryngwran is 54 days.
- Guests book furthest in advance for stays during August (average 84 days), likely coinciding with peak travel demand or local events.
- The shortest booking windows occur for stays in December (average 25 days), indicating more last-minute travel plans during this time.
- Seasonally, Summer (78 days avg.) sees the longest lead times, while Winter (26 days avg.) has the shortest, reflecting typical travel planning cycles.
Recommendations for Hosts
- Use the overall average lead time (54 days) as a baseline for your pricing and availability strategy in Bryngwran.
- For August stays, consider implementing length-of-stay discounts or slightly higher rates for bookings made less than 84 days out to capitalize on advance planning.
- Target marketing efforts for the Summer season well in advance (at least 78 days) to capture early planners.
- Monitor your own booking lead times against these Bryngwran averages to identify opportunities for dynamic pricing adjustments.
Popular & Essential Airbnb Amenities in Bryngwran (2025)
Amenity Prevalence
Amenity Insights for Bryngwran
- Essential amenities in Bryngwran that guests expect include: Smoke alarm, Fire extinguisher, Kitchen, Free parking on premises. Lacking these (any) could significantly impact bookings.
- Popular amenities like Heating, Hot water, Bed linens are common but not universal. Offering these can provide a competitive edge.
Recommendations for Hosts
- Ensure your listing includes all essential amenities for Bryngwran: Smoke alarm, Fire extinguisher, Kitchen, Free parking on premises.
- Consider adding popular differentiators like Heating or Hot water to increase appeal.
- Highlight unique or less common amenities you offer (e.g., hot tub, dedicated workspace, EV charger) in your listing description and photos.
- Regularly check competitor amenities in Bryngwran to stay competitive.
Bryngwran Airbnb Guest Demographics & Profile Analysis (2025)
Guest Profile Summary for Bryngwran
- The typical guest profile for Airbnb in Bryngwran consists of primarily domestic travelers (94%), often arriving from nearby England, typically belonging to the Post-2000s (Gen Z/Alpha) group (50%), primarily speaking English or Czech.
- Domestic travelers account for 93.8% of guests.
- Key international markets include United Kingdom (93.8%) and Ireland (2.1%).
- Top languages spoken are English (78.6%) followed by Czech (7.1%).
- A significant demographic segment is the Post-2000s (Gen Z/Alpha) group, representing 50% of guests.
Recommendations for Hosts
- Target domestic marketing efforts towards travelers from England and Manchester.
- Tailor amenities and listing descriptions to appeal to the dominant Post-2000s (Gen Z/Alpha) demographic (e.g., highlight fast WiFi, smart home features, local guides).
- Highlight unique local experiences or amenities relevant to the primary guest profile.
- Consider seasonal promotions aligned with peak travel times for key origin markets.
Nearby Short-Term Rental Market Comparison
How does the Bryngwran Airbnb market stack up against its neighbors? Compare key performance metrics like average monthly revenue, ADR, and occupancy rates in surrounding areas to understand the broader regional STR landscape.
| Market | Active Properties | Monthly Revenue | Daily Rate | Avg. Occupancy |
|---|---|---|---|---|
| Chirbury | 14 | $5,230 | $735.87 | 45% |
| Waverton | 17 | $4,122 | $465.29 | 31% |
| Isle of Man | 10 | $4,036 | $407.50 | 36% |
| Abbeycwmhir | 11 | $3,987 | $255.01 | 48% |
| Eglwys-bach | 18 | $3,965 | $331.58 | 48% |
| Montgomery | 10 | $3,729 | $268.47 | 51% |
| Valley | 20 | $3,661 | $269.56 | 46% |
| Llanbedrgoch | 14 | $3,603 | $250.77 | 52% |
| Cwmann | 21 | $3,568 | $243.32 | 49% |
| Borth-y-Gêst | 21 | $3,463 | $255.33 | 50% |