East Williamston Airbnb Market Analysis 2025: Short Term Rental Data & Vacation Rental Statistics in Wales, United Kingdom
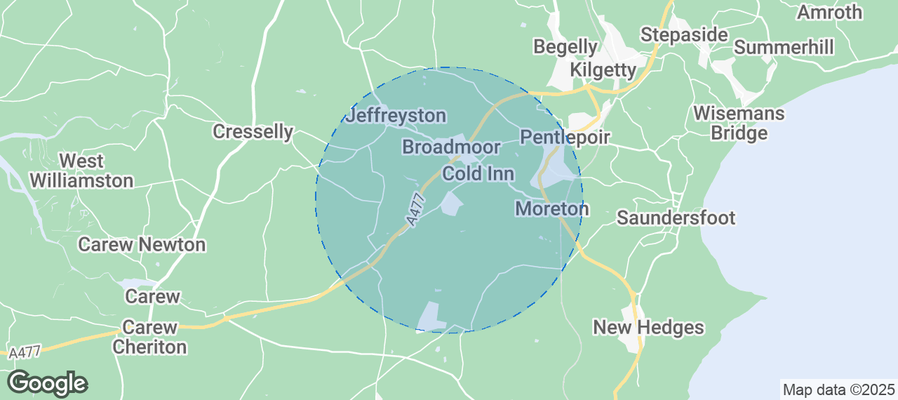
Is Airbnb profitable in East Williamston in 2025? Explore comprehensive Airbnb analytics for East Williamston, Wales, United Kingdom to uncover income potential. This 2025 STR market report for East Williamston, based on AirROI data from December 2024 to November 2025, reveals key trends in the niche market of 18 active listings.
Whether you're considering an Airbnb investment in East Williamston, optimizing your existing vacation rental, or exploring rental arbitrage opportunities, understanding the East Williamston Airbnb data is crucial. Leveraging the low regulation environment is key to maximizing your short term rental income potential. Let's dive into the specifics.
Key East Williamston Airbnb Performance Metrics Overview
Monthly Airbnb Revenue Variations & Income Potential in East Williamston (2025)
Understanding the monthly revenue variations for Airbnb listings in East Williamston is key to maximizing your short term rental income potential. Seasonality significantly impacts earnings. Our analysis, based on data from the past 12 months, shows that the peak revenue month for STRs in East Williamston is typically August, while November often presents the lowest earnings, highlighting opportunities for strategic pricing adjustments during shoulder and low seasons. Explore the typical Airbnb income in East Williamston across different performance tiers:
- Best-in-class properties (Top 10%) achieve $3,115+ monthly, often utilizing dynamic pricing and superior guest experiences.
- Strong performing properties (Top 25%) earn $2,295 or more, indicating effective management and desirable locations/amenities.
- Typical properties (Median) generate around $1,160 per month, representing the average market performance.
- Entry-level properties (Bottom 25%) see earnings around $742, often with potential for optimization.
Average Monthly Airbnb Earnings Trend in East Williamston
East Williamston Airbnb Occupancy Rate Trends (2025)
Maximize your bookings by understanding the East Williamston STR occupancy trends. Seasonal demand shifts significantly influence how often properties are booked. Typically, Augustsees the highest demand (peak season occupancy), while November experiences the lowest (low season). Effective strategies, like adjusting minimum stays or offering promotions, can boost occupancy during slower periods. Here's how different property tiers perform in East Williamston:
- Best-in-class properties (Top 10%) achieve 67%+ occupancy, indicating high desirability and potentially optimized availability.
- Strong performing properties (Top 25%) maintain 49% or higher occupancy, suggesting good market fit and guest satisfaction.
- Typical properties (Median) have an occupancy rate around 22%.
- Entry-level properties (Bottom 25%) average 16% occupancy, potentially facing higher vacancy.
Average Monthly Occupancy Rate Trend in East Williamston
Average Daily Rate (ADR) Airbnb Trends in East Williamston (2025)
Effective short term rental pricing strategy in East Williamston involves understanding monthly ADR fluctuations. The Average Daily Rate (ADR) for Airbnb in East Williamston typically peaks in December and dips lowest during October. Leveraging Airbnb dynamic pricing tools or strategies based on this seasonality can significantly boost revenue. Here's a look at the typical nightly rates achieved:
- Best-in-class properties (Top 10%) command rates of $314+ per night, often due to premium features or locations.
- Strong performing properties (Top 25%) achieve nightly rates of $219 or more.
- Typical properties (Median) charge around $147 per night.
- Entry-level properties (Bottom 25%) earn around $113 per night.
Average Daily Rate (ADR) Trend by Month in East Williamston
Get Live East Williamston Market Intelligence 👇
Explore Real-time Analytics
Airbnb Seasonality Analysis & Trends in East Williamston (2025)
Peak Season (August, September, March)
- Revenue averages $2,305 per month
- Occupancy rates average 52.3%
- Daily rates average $166
Shoulder Season
- Revenue averages $1,663 per month
- Occupancy maintains around 33.7%
- Daily rates hold near $195
Low Season (January, October, November)
- Revenue drops to average $1,025 per month
- Occupancy decreases to average 20.3%
- Daily rates adjust to average $163
Seasonality Insights for East Williamston
- The Airbnb seasonality in East Williamston shows highly seasonal trends requiring careful strategy. While the sections above show seasonal averages, it's also insightful to look at the extremes:
- During the high season, the absolute peak month showcases East Williamston's highest earning potential, with monthly revenues capable of climbing to $2,641, occupancy reaching a high of 56.7%, and ADRs peaking at $207.
- Conversely, the slowest single month of the year, typically falling within the low season, marks the market's lowest point. In this month, revenue might dip to $421, occupancy could drop to 11.7%, and ADRs may adjust down to $140.
- Understanding both the seasonal averages and these monthly peaks and troughs in revenue, occupancy, and ADR is crucial for maximizing your Airbnb profit potential in East Williamston.
Seasonal Strategies for Maximizing Profit
- Peak Season: Maximize revenue through premium pricing and potentially longer minimum stays. Ensure high availability.
- Low Season: Offer competitive pricing, special promotions (e.g., extended stay discounts), and flexible cancellation policies. Target off-season travelers like remote workers or budget-conscious guests.
- Shoulder Seasons: Implement dynamic pricing that balances peak and low rates. Target weekend travelers or specific events. Offer slightly more flexible terms than peak season.
- Regularly analyze your own performance against these East Williamston seasonality benchmarks and adjust your pricing and availability strategy accordingly.
Best Areas for Airbnb Investment in East Williamston (2025)
Exploring the top neighborhoods for short-term rentals in East Williamston? This section highlights key areas, outlining why they are attractive for hosts and guests, along with notable local attractions. Consider these locations based on your target guest profile and investment strategy.
| Neighborhood / Area | Why Host Here? (Target Guests & Appeal) | Key Attractions & Landmarks |
|---|---|---|
| Tenby | Historic coastal town with beautiful beaches, popular among tourists for its picturesque scenery and rich history. Ideal for hosting guests looking for seaside escapes and local attractions. | Castle Beach, Tenby Harbour, St. Catherine's Island, Tenby Museum and Art Gallery, North Beach, The National Trust's Tudor Merchant's House |
| Narberth | Charming market town known for its boutique shops, eateries, and cultural offerings. Attracts visitors seeking a quaint experience with local charm and nearby attractions. | Narberth Castle, Colby Woodland Garden, Oriel Myrddin Gallery, Narberth Museum, Locally owned shops and cafes |
| Pembroke | Historic town with a significant castle and rich medieval history. Great for guests interested in history, architecture, and exploring nearby coastal attractions. | Pembroke Castle, Carew Castle, Stackpole Estate, The Pembrokeshire Coast Path, Coastal walks and beaches |
| Saundersfoot | Picturesque seaside village known for its sandy beaches and family-friendly atmosphere. Ideal for families and beach lovers seeking relaxation and fun activities. | Saundersfoot Beach, Saundersfoot Harbour, The Pembrokeshire Coastal Path, Local seafood restaurants, Beach activities and water sports |
| Manorbier | Small coastal village famed for its castle and stunning beaches. A perfect spot for visitors looking for a tranquil escape with stunning natural beauty. | Manorbier Castle, Manorbier Beach, The Church of St. James, Coastal walks, Local cafes and pubs |
| Freshwater East | Beautiful beach location ideal for nature lovers and those who enjoy water sports. A hidden gem for guests seeking serenity by the sea. | Freshwater East Beach, The Pembrokeshire Coast Path, Local wildlife and nature spots, Surfing and water sports |
| Angle | Quaint village with scenic views and close proximity to beautiful beaches. Great for family getaways and outdoor enthusiasts looking to explore the outdoors. | Angle Bay, West Angle Beach, Local pubs and eateries, The Pembroke Dock, Nature walks and parks |
| Haverfordwest | The county town of Pembrokeshire, offering a mix of history, culture, and access to beautiful countryside and coast. Perfect for those wanting city amenities with nature close by. | Haverfordwest Castle, Town Museum, The River Cleddau, Local shops and restaurants, Historical landmarks |
Understanding Airbnb License Requirements & STR Laws in East Williamston (2025)
While East Williamston, Wales, United Kingdom currently shows low STR regulations, specific Airbnb license requirements might still exist or change. Always verify the latest short term rental regulations and Airbnb license requirements directly with local government authorities for East Williamston to ensure full compliance before hosting.
(Source: AirROI data, 2025, finding no licensed listings among those analyzed)
Top Performing Airbnb Properties in East Williamston (2025)
Benchmark your potential! Explore examples of top-performing Airbnb properties in East Williamstonbased on Trailing Twelve Month (TTM) revenue. Analyze their characteristics, revenue, occupancy rate, and ADR to understand what drives success in this market.
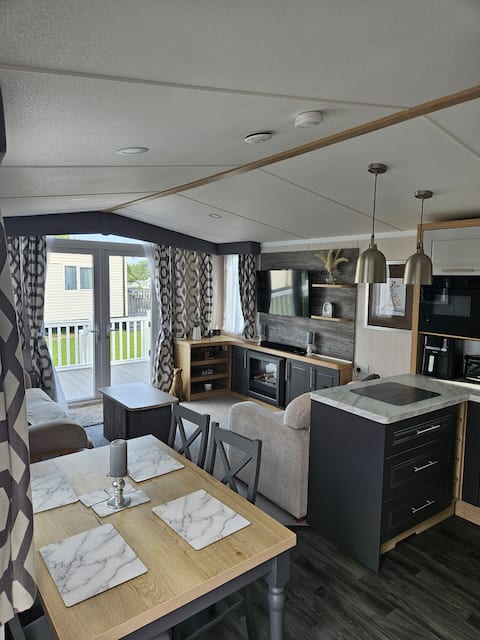
Caravan near Tenby/Saundersfoot
Entire Place • 2 bedrooms
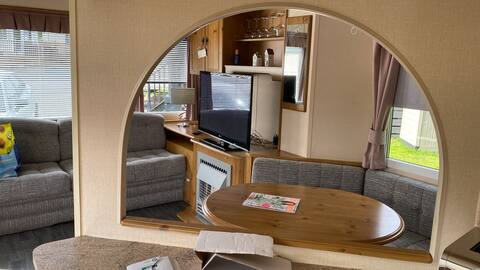
Tenby Static Caravan
Entire Place • 2 bedrooms
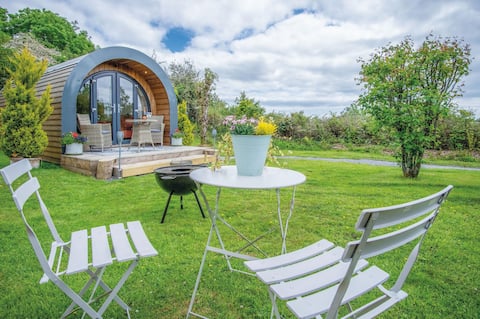
Woody's - 1 Bedroom Pod - Cold Inn
Entire Place • 1 bedroom
MOONSTONE
Entire Place • 3 bedrooms
A comfortable static caravan
Entire Place • 3 bedrooms

PottingShed nr Tenby: 100"Projector,HotTub,4Poster
Entire Place • 1 bedroom
Note: Performance varies based on location, size, amenities, seasonality, and management quality. Data reflects the past 12 months.
Top Performing Airbnb Hosts in East Williamston (2025)
Learn from the best! This table showcases top-performing Airbnb hosts in East Williamston based on the number of properties managed and estimated total revenue over the past year. Analyze their scale and performance metrics.
| Host Name | Properties | Grossing Revenue | Stay Reviews | Avg Rating |
|---|---|---|---|---|
| Susie | 1 | $32,654 | 18 | 5.00/5.0 |
| Kylie | 7 | $30,369 | 114 | 4.97/5.0 |
| Lisa | 1 | $22,528 | 106 | 4.56/5.0 |
| Stay Pembrokeshire | 1 | $20,332 | 60 | 4.87/5.0 |
| Jane | 1 | $18,568 | 33 | 4.85/5.0 |
| Stephanie | 1 | $17,453 | 18 | 4.83/5.0 |
| Catherine | 1 | $16,577 | 148 | 4.78/5.0 |
| Laura | 1 | $12,096 | 11 | 5.00/5.0 |
| Great Welsh Escapes | 1 | $7,686 | 5 | 4.80/5.0 |
| Nicola | 1 | $6,074 | 17 | 4.94/5.0 |
Analyzing the strategies of top hosts, such as their property selection, pricing, and guest communication, can offer valuable lessons for optimizing your own Airbnb operations in East Williamston.
Dive Deeper: Advanced East Williamston STR Market Data (2025)
Ready to unlock more insights? AirROI provides access to advanced metrics and comprehensive Airbnb data for East Williamston. Explore detailed analytics beyond this report to refine your investment strategy, optimize pricing, and maximize your vacation rental profits.
Explore Advanced MetricsEast Williamston Short-Term Rental Market Composition (2025): Property & Room Types
Room Type Distribution
Property Type Distribution
Market Composition Insights for East Williamston
- The East Williamston Airbnb market composition is heavily skewed towards Entire Home/Apt listings, which make up 77.8% of the 18 active rentals. This indicates strong guest preference for privacy and space.
- Looking at the property type distribution in East Williamston, Outdoor/Unique properties are the most common (50%), reflecting the local real estate landscape.
East Williamston Airbnb Room Capacity Analysis (2025): Bedroom Distribution
Distribution of Listings by Number of Bedrooms
Room Capacity Insights for East Williamston
- The dominant room capacity in East Williamston is 1 bedroom listings, making up 50% of the market. This suggests a strong demand for properties suitable for couples or solo travelers.
- Together, 1 bedroom and 3 bedrooms properties represent 77.8% of the active Airbnb listings in East Williamston, indicating a high concentration in these sizes.
- A significant 27.8% of listings offer 3+ bedrooms, catering to larger groups and families seeking more space in East Williamston.
East Williamston Vacation Rental Guest Capacity Trends (2025)
Distribution of Listings by Guest Capacity
Guest Capacity Insights for East Williamston
- The most common guest capacity trend in East Williamston vacation rentals is listings accommodating 5 guests (33.3%). This suggests the primary traveler segment is likely larger groups.
- Properties designed for 5 guests and 6 guests dominate the East Williamston STR market, accounting for 66.6% of listings.
- 38.9% of properties accommodate 6+ guests, serving the market segment for larger families or group travel in East Williamston.
- On average, properties in East Williamston are equipped to host 5.0 guests.
East Williamston Airbnb Booking Patterns (2025): Available vs. Booked Days
Available Days Distribution
Booked Days Distribution
Booking Pattern Insights for East Williamston
- The most common availability pattern in East Williamston falls within the 271-366 days range, representing 66.7% of listings. This suggests many properties have significant open periods on their calendars.
- Approximately 94.5% of listings show high availability (181+ days open annually), indicating potential for increased bookings or specific owner usage patterns.
- For booked days, the 1-30 days range is most frequent in East Williamston (33.3%), reflecting common guest stay durations or potential owner blocking patterns.
- A notable 5.6% of properties secure long booking periods (181+ days booked per year), highlighting successful long-term rental strategies or significant owner usage.
East Williamston Airbnb Minimum Stay Requirements Analysis
Distribution of Listings by Minimum Night Requirement
1 Night
2 listings
11.1% of total
2 Nights
9 listings
50% of total
3 Nights
1 listings
5.6% of total
4-6 Nights
1 listings
5.6% of total
30+ Nights
5 listings
27.8% of total
Key Insights
- The most prevalent minimum stay requirement in East Williamston is 2 Nights, adopted by 50% of listings. This highlights the market's preference for shorter, flexible bookings.
- A strong majority (61.1%) of the East Williamston Airbnb data shows acceptance of very short stays (1-2 nights), indicating a dynamic, high-turnover market.
- A significant segment (27.8%) caters to monthly stays (30+ nights) in East Williamston, pointing to opportunities in the extended-stay market.
Recommendations
- Align with the market by considering a 2 Nights minimum stay, as 50% of East Williamston hosts use this setting.
- If feasible, allowing 1-night stays, especially midweek or during low season, could capture last-minute bookings, as only 11.1% currently do.
- A 2-night minimum appears standard (50%). Consider this for weekends or peak periods.
- Explore offering discounts for stays of 30+ nights to attract the 27.8% of the market seeking extended stays.
- Adjust minimum nights based on seasonality – potentially shorter during low season and longer during peak demand periods in East Williamston.
East Williamston Airbnb Cancellation Policy Trends Analysis (2025)
Super Strict 60 Days
1 listings
5.6% of total
Flexible
8 listings
44.4% of total
Moderate
2 listings
11.1% of total
Firm
5 listings
27.8% of total
Strict
2 listings
11.1% of total
Cancellation Policy Insights for East Williamston
- The prevailing Airbnb cancellation policy trend in East Williamston is Flexible, used by 44.4% of listings.
- There's a relatively balanced mix between guest-friendly (55.5%) and stricter (38.9%) policies, offering choices for different guest needs.
Recommendations for Hosts
- Consider adopting a Flexible policy to align with the 44.4% market standard in East Williamston.
- Using a Strict policy might deter some guests, as only 11.1% of listings use it. Evaluate if potential revenue protection outweighs possible lower booking rates.
- Regularly review your cancellation policy against competitors and market demand shifts in East Williamston.
East Williamston STR Booking Lead Time Analysis (2025)
Average Booking Lead Time by Month
Booking Lead Time Insights for East Williamston
- The overall average booking lead time for vacation rentals in East Williamston is 59 days.
- Guests book furthest in advance for stays during December (average 236 days), likely coinciding with peak travel demand or local events.
- The shortest booking windows occur for stays in November (average 17 days), indicating more last-minute travel plans during this time.
- Seasonally, Winter (126 days avg.) sees the longest lead times, while Spring (38 days avg.) has the shortest, reflecting typical travel planning cycles.
Recommendations for Hosts
- Use the overall average lead time (59 days) as a baseline for your pricing and availability strategy in East Williamston.
- For December stays, consider implementing length-of-stay discounts or slightly higher rates for bookings made less than 236 days out to capitalize on advance planning.
- Target marketing efforts for the Winter season well in advance (at least 126 days) to capture early planners.
- Monitor your own booking lead times against these East Williamston averages to identify opportunities for dynamic pricing adjustments.
Popular & Essential Airbnb Amenities in East Williamston (2025)
Amenity Prevalence
Amenity Insights for East Williamston
- Essential amenities in East Williamston that guests expect include: Free parking on premises. Lacking these (this) could significantly impact bookings.
- Popular amenities like Kitchen, Hot water, Cooking basics are common but not universal. Offering these can provide a competitive edge.
Recommendations for Hosts
- Ensure your listing includes all essential amenities for East Williamston: Free parking on premises.
- Consider adding popular differentiators like Kitchen or Hot water to increase appeal.
- Highlight unique or less common amenities you offer (e.g., hot tub, dedicated workspace, EV charger) in your listing description and photos.
- Regularly check competitor amenities in East Williamston to stay competitive.
East Williamston Airbnb Guest Demographics & Profile Analysis (2025)
Guest Profile Summary for East Williamston
- The typical guest profile for Airbnb in East Williamston consists of primarily domestic travelers (97%), often arriving from nearby England, typically belonging to the Post-2000s (Gen Z/Alpha) group (50%), primarily speaking English or Polish.
- Domestic travelers account for 96.6% of guests.
- Key international markets include United Kingdom (96.6%) and Germany (1.7%).
- Top languages spoken are English (68.2%) followed by Polish (9.1%).
- A significant demographic segment is the Post-2000s (Gen Z/Alpha) group, representing 50% of guests.
Recommendations for Hosts
- Target domestic marketing efforts towards travelers from England and Cardiff.
- Tailor amenities and listing descriptions to appeal to the dominant Post-2000s (Gen Z/Alpha) demographic (e.g., highlight fast WiFi, smart home features, local guides).
- Highlight unique local experiences or amenities relevant to the primary guest profile.
- Consider seasonal promotions aligned with peak travel times for key origin markets.
Nearby Short-Term Rental Market Comparison
How does the East Williamston Airbnb market stack up against its neighbors? Compare key performance metrics like average monthly revenue, ADR, and occupancy rates in surrounding areas to understand the broader regional STR landscape.
| Market | Active Properties | Monthly Revenue | Daily Rate | Avg. Occupancy |
|---|---|---|---|---|
| Angle | 13 | $6,426 | $637.84 | 48% |
| Bont-dolgadfan | 10 | $5,982 | $294.35 | 62% |
| Southerndown | 14 | $5,436 | $411.88 | 47% |
| Crai | 31 | $4,863 | $543.36 | 39% |
| Southgate | 13 | $4,825 | $289.11 | 56% |
| Bridgwater | 18 | $4,645 | $366.71 | 49% |
| Milverton | 11 | $4,623 | $349.30 | 46% |
| Penmorfa | 19 | $4,574 | $456.18 | 48% |
| Cwmann | 18 | $4,466 | $285.38 | 53% |
| Govilon | 10 | $4,354 | $258.25 | 58% |