Llanarth Airbnb Market Analysis 2026: Short Term Rental Data & Vacation Rental Statistics in Wales, United Kingdom
Is Airbnb profitable in Llanarth in 2026? Explore comprehensive Airbnb analytics for Llanarth, Wales, United Kingdom to uncover income potential. This 2026 STR market report for Llanarth, based on AirROI data from February 2025 to January 2026, reveals key trends in the niche market of 24 active listings.
Whether you're considering an Airbnb investment in Llanarth, optimizing your existing vacation rental, or exploring rental arbitrage opportunities, understanding the Llanarth Airbnb data is crucial. Leveraging the low regulation environment is key to maximizing your short term rental income potential. Let's dive into the specifics.
Key Llanarth Airbnb Performance Metrics Overview
Monthly Airbnb Revenue Variations & Income Potential in Llanarth (2026)
Understanding the monthly revenue variations for Airbnb listings in Llanarth is key to maximizing your short term rental income potential. Seasonality significantly impacts earnings. Our analysis, based on data from the past 12 months, shows that the peak revenue month for STRs in Llanarth is typically August, while January often presents the lowest earnings, highlighting opportunities for strategic pricing adjustments during shoulder and low seasons. Explore the typical Airbnb income in Llanarth across different performance tiers:
- Best-in-class properties (Top 10%) achieve $4,739+ monthly, often utilizing dynamic pricing and superior guest experiences.
- Strong performing properties (Top 25%) earn $3,220 or more, indicating effective management and desirable locations/amenities.
- Typical properties (Median) generate around $2,213 per month, representing the average market performance.
- Entry-level properties (Bottom 25%) see earnings around $1,261, often with potential for optimization.
Average Monthly Airbnb Earnings Trend in Llanarth
Llanarth Airbnb Occupancy Rate Trends (2026)
Maximize your bookings by understanding the Llanarth STR occupancy trends. Seasonal demand shifts significantly influence how often properties are booked. Typically, Augustsees the highest demand (peak season occupancy), while January experiences the lowest (low season). Effective strategies, like adjusting minimum stays or offering promotions, can boost occupancy during slower periods. Here's how different property tiers perform in Llanarth:
- Best-in-class properties (Top 10%) achieve 84%+ occupancy, indicating high desirability and potentially optimized availability.
- Strong performing properties (Top 25%) maintain 73% or higher occupancy, suggesting good market fit and guest satisfaction.
- Typical properties (Median) have an occupancy rate around 57%.
- Entry-level properties (Bottom 25%) average 36% occupancy, potentially facing higher vacancy.
Average Monthly Occupancy Rate Trend in Llanarth
Average Daily Rate (ADR) Airbnb Trends in Llanarth (2026)
Effective short term rental pricing strategy in Llanarth involves understanding monthly ADR fluctuations. The Average Daily Rate (ADR) for Airbnb in Llanarth typically peaks in August and dips lowest during February. Leveraging Airbnb dynamic pricing tools or strategies based on this seasonality can significantly boost revenue. Here's a look at the typical nightly rates achieved:
- Best-in-class properties (Top 10%) command rates of $272+ per night, often due to premium features or locations.
- Strong performing properties (Top 25%) achieve nightly rates of $159 or more.
- Typical properties (Median) charge around $129 per night.
- Entry-level properties (Bottom 25%) earn around $107 per night.
Average Daily Rate (ADR) Trend by Month in Llanarth
Get Live Llanarth Market Intelligence 👇

Explore Real-time Analytics
Airbnb Seasonality Analysis & Trends in Llanarth (2026)
Peak Season (August, July, May)
- Revenue averages $3,365 per month
- Occupancy rates average 68.2%
- Daily rates average $162
Shoulder Season
- Revenue averages $2,506 per month
- Occupancy maintains around 55.2%
- Daily rates hold near $152
Low Season (January, February, November)
- Revenue drops to average $1,549 per month
- Occupancy decreases to average 39.3%
- Daily rates adjust to average $142
Seasonality Insights for Llanarth
- The Airbnb seasonality in Llanarth shows highly seasonal trends requiring careful strategy. While the sections above show seasonal averages, it's also insightful to look at the extremes:
- During the high season, the absolute peak month showcases Llanarth's highest earning potential, with monthly revenues capable of climbing to $3,827, occupancy reaching a high of 74.4%, and ADRs peaking at $168.
- Conversely, the slowest single month of the year, typically falling within the low season, marks the market's lowest point. In this month, revenue might dip to $1,271, occupancy could drop to 28.2%, and ADRs may adjust down to $137.
- Understanding both the seasonal averages and these monthly peaks and troughs in revenue, occupancy, and ADR is crucial for maximizing your Airbnb profit potential in Llanarth.
Seasonal Strategies for Maximizing Profit
- Peak Season: Maximize revenue through premium pricing and potentially longer minimum stays. Ensure high availability.
- Low Season: Offer competitive pricing, special promotions (e.g., extended stay discounts), and flexible cancellation policies. Target off-season travelers like remote workers or budget-conscious guests.
- Shoulder Seasons: Implement dynamic pricing that balances peak and low rates. Target weekend travelers or specific events. Offer slightly more flexible terms than peak season.
- Regularly analyze your own performance against these Llanarth seasonality benchmarks and adjust your pricing and availability strategy accordingly.
Best Areas for Airbnb Investment in Llanarth (2026)
Exploring the top neighborhoods for short-term rentals in Llanarth? This section highlights key areas, outlining why they are attractive for hosts and guests, along with notable local attractions. Consider these locations based on your target guest profile and investment strategy.
| Neighborhood / Area | Why Host Here? (Target Guests & Appeal) | Key Attractions & Landmarks |
|---|---|---|
| Llanarth Village | A charming village known for its picturesque views and friendly community. Ideal for guests looking for a peaceful retreat in a rural setting, with easy access to surrounding attractions. | Llanarth Village Hall, local pubs and cafes, beautiful countryside walks |
| Cardigan Bay | Famous for its stunning coastline, Cardigan Bay attracts tourists seeking outdoor activities and marine life such as dolphins. Perfect for those interested in nature and adventure. | Cardigan Bay Marine Wildlife Centre, Dolphin watching tours, beaches and coastal paths |
| Tintern Abbey | An iconic historical site offering breathtaking views and a glimpse into the rich history of Wales. A must-visit for history lovers and those enjoying scenic walks along the River Wye. | Tintern Abbey, River Wye walks, local artisan shops |
| Monmouthshire | Known for its beautiful countryside, Monmouthshire is ideal for guests who appreciate nature and want to explore the Wye Valley. Offers numerous hiking and biking trails. | Wye Valley AONB, off-road biking trails, local vineyards |
| Brecon Beacons National Park | A stunning national park perfect for outdoor enthusiasts, with opportunities for hiking, climbing, and exploring nature. Attracts adventure seekers and families. | Pen y Fan, waterfalls, beautiful hiking trails |
| Chepstow | With a historic castle and vibrant waterfront, Chepstow is a great location for travelers looking for history, culture, and local dining options. Easy access to both Wales and England. | Chepstow Castle, Wye Bridge, local markets |
| Skirrid Fawr | A popular hiking spot known for its panoramic views and natural beauty. Ideal for guests looking for outdoor activities in a serene environment. | Skirrid Fawr summit, hiking trails, scenic viewpoints |
| Llangorse Lake | The largest natural lake in south Wales, offering water activities, cycling, and bird watching. Popular among families and outdoor lovers. | water sports, stage coach rides, mountain biking trails |
Understanding Airbnb License Requirements & STR Laws in Llanarth (2026)
While Llanarth, Wales, United Kingdom currently shows low STR regulations, specific Airbnb license requirements might still exist or change. Always verify the latest short term rental regulations and Airbnb license requirements directly with local government authorities for Llanarth to ensure full compliance before hosting.
(Source: AirROI data, 2026, finding no licensed listings among those analyzed)
Top Performing Airbnb Properties in Llanarth (2026)
Benchmark your potential! Explore examples of top-performing Airbnb properties in Llanarthbased on Trailing Twelve Month (TTM) revenue. Analyze their characteristics, revenue, occupancy rate, and ADR to understand what drives success in this market.
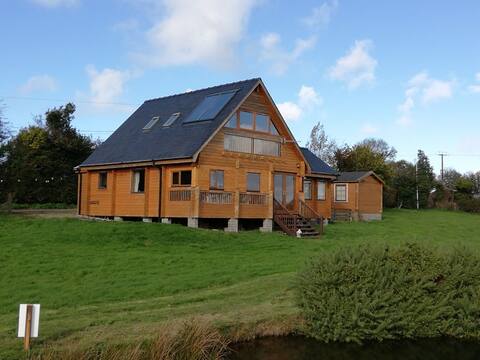
Scandinavian Lodge overlooking private lake
Entire Place • 3 bedrooms
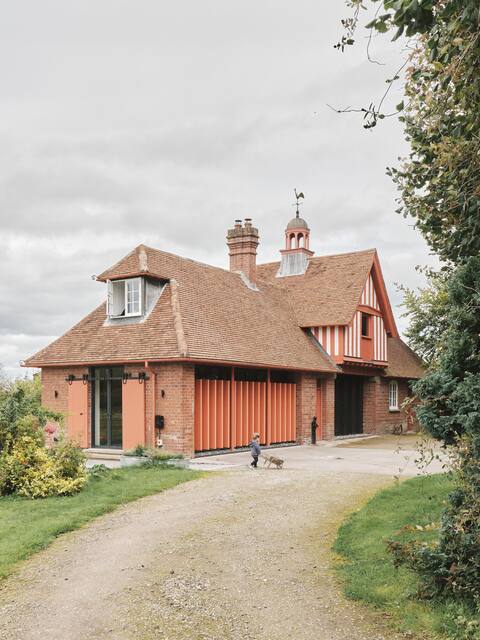
The Stable Block
Entire Place • 3 bedrooms
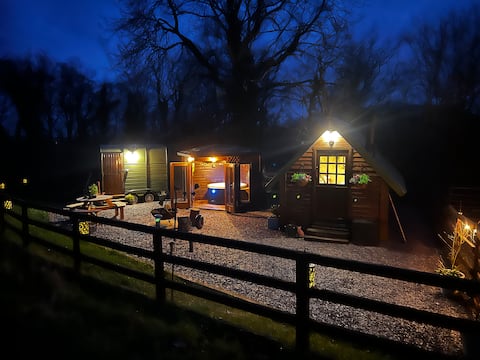
Little fox! Entire hot tub complex to yourselves!
Entire Place • 1 bedroom

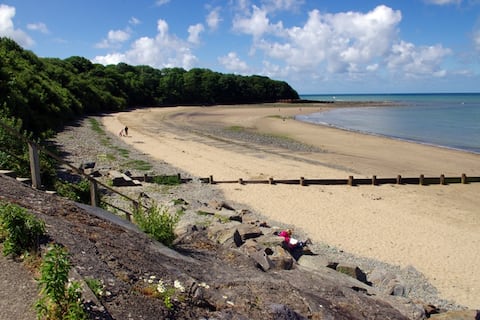
Tranquil 1 bedroom cottage 15 mins drive to sea
Entire Place • 1 bedroom

‘Dwtty Hut’ Bee themed Shepherds hut with hot tub!
Entire Place • 1 bedroom
2 Bed Detached bungalow (dog friendly)
Entire Place • 2 bedrooms
Note: Performance varies based on location, size, amenities, seasonality, and management quality. Data reflects the past 12 months.
Top Performing Airbnb Hosts in Llanarth (2026)
Learn from the best! This table showcases top-performing Airbnb hosts in Llanarth based on the number of properties managed and estimated total revenue over the past year. Analyze their scale and performance metrics.
| Host Name | Properties | Grossing Revenue | Stay Reviews | Avg Rating |
|---|---|---|---|---|
| Adam And Pam | 2 | $88,181 | 297 | 5.00/5.0 |
| Gethin | 1 | $67,795 | 94 | 4.61/5.0 |
| Richard | 1 | $63,477 | 22 | 4.95/5.0 |
| Amanda | 1 | $41,611 | 232 | 4.97/5.0 |
| Arwel + Neris | 2 | $38,062 | 165 | 4.92/5.0 |
| Denise | 1 | $32,919 | 387 | 4.64/5.0 |
| Michael | 1 | $32,248 | 243 | 4.91/5.0 |
| Tom | 1 | $30,853 | 89 | 4.96/5.0 |
| Rhiannon And Rob | 1 | $26,968 | 293 | 4.91/5.0 |
| Kylie | 1 | $24,708 | 55 | 4.96/5.0 |
Analyzing the strategies of top hosts, such as their property selection, pricing, and guest communication, can offer valuable lessons for optimizing your own Airbnb operations in Llanarth.
Dive Deeper: Advanced Llanarth STR Market Data (2026)
Ready to unlock more insights? AirROI provides access to advanced metrics and comprehensive Airbnb data for Llanarth. Explore detailed analytics beyond this report to refine your investment strategy, optimize pricing, and maximize your vacation rental profits.
Explore Advanced MetricsLlanarth Short-Term Rental Market Composition (2026): Property & Room Types
Room Type Distribution
Property Type Distribution
Market Composition Insights for Llanarth
- The Llanarth Airbnb market composition is heavily skewed towards Entire Home/Apt listings, which make up 91.7% of the 24 active rentals. This indicates strong guest preference for privacy and space.
- Looking at the property type distribution in Llanarth, House properties are the most common (70.8%), reflecting the local real estate landscape.
- Houses represent a significant 70.8% portion, catering likely to families or larger groups.
- Smaller segments like outdoor/unique, others, hotel/boutique, apartment/condo (combined 16.8%) offer potential for unique stay experiences.
Llanarth Airbnb Room Capacity Analysis (2026): Bedroom Distribution
Distribution of Listings by Number of Bedrooms
Room Capacity Insights for Llanarth
- The dominant room capacity in Llanarth is 1 bedroom listings, making up 54.2% of the market. This suggests a strong demand for properties suitable for couples or solo travelers.
- Together, 1 bedroom and 2 bedrooms properties represent 83.4% of the active Airbnb listings in Llanarth, indicating a high concentration in these sizes.
- With over half the market (54.2%) consisting of studios or 1-bedroom units, Llanarth is particularly well-suited for individuals or couples.
- Listings with 3+ bedrooms (8.3%) represent a smaller niche, potentially indicating an underserved market for larger group accommodations in Llanarth.
Llanarth Vacation Rental Guest Capacity Trends (2026)
Distribution of Listings by Guest Capacity
Guest Capacity Insights for Llanarth
- The most common guest capacity trend in Llanarth vacation rentals is listings accommodating 2 guests (41.7%). This suggests the primary traveler segment is likely couples or solo travelers.
- Properties designed for 2 guests and 4 guests dominate the Llanarth STR market, accounting for 79.2% of listings.
- A significant 41.7% of listings cater specifically to 1-2 guests, highlighting strong demand from couples and solo travelers in Llanarth.
- On average, properties in Llanarth are equipped to host 3.1 guests.
Llanarth Airbnb Booking Patterns (2026): Available vs. Booked Days
Available Days Distribution
Booked Days Distribution
Booking Pattern Insights for Llanarth
- The most common availability pattern in Llanarth falls within the 91-180 days range, representing 41.7% of listings. This suggests many properties have significant open periods on their calendars.
- Approximately 50.0% of listings show high availability (181+ days open annually), indicating potential for increased bookings or specific owner usage patterns.
- For booked days, the 181-270 days range is most frequent in Llanarth (41.7%), reflecting common guest stay durations or potential owner blocking patterns.
- A notable 54.2% of properties secure long booking periods (181+ days booked per year), highlighting successful long-term rental strategies or significant owner usage.
Llanarth Airbnb Minimum Stay Requirements Analysis
Distribution of Listings by Minimum Night Requirement
1 Night
6 listings
25% of total
2 Nights
5 listings
20.8% of total
3 Nights
3 listings
12.5% of total
30+ Nights
10 listings
41.7% of total
Key Insights
- The most prevalent minimum stay requirement in Llanarth is 30+ Nights, adopted by 41.7% of listings. This highlights the market's preference for longer commitments.
- A significant segment (41.7%) caters to monthly stays (30+ nights) in Llanarth, pointing to opportunities in the extended-stay market.
Recommendations
- Align with the market by considering a 30+ Nights minimum stay, as 41.7% of Llanarth hosts use this setting.
- If feasible, allowing 1-night stays, especially midweek or during low season, could capture last-minute bookings, as only 25% currently do.
- Explore offering discounts for stays of 30+ nights to attract the 41.7% of the market seeking extended stays.
- Adjust minimum nights based on seasonality – potentially shorter during low season and longer during peak demand periods in Llanarth.
Llanarth Airbnb Cancellation Policy Trends Analysis (2026)
Super Strict 60 Days
2 listings
8.3% of total
Flexible
6 listings
25% of total
Moderate
6 listings
25% of total
Firm
6 listings
25% of total
Strict
4 listings
16.7% of total
Cancellation Policy Insights for Llanarth
- The prevailing Airbnb cancellation policy trend in Llanarth is Flexible, used by 25% of listings.
- There's a relatively balanced mix between guest-friendly (50.0%) and stricter (41.7%) policies, offering choices for different guest needs.
Recommendations for Hosts
- Consider adopting a Flexible policy to align with the 25% market standard in Llanarth.
- Regularly review your cancellation policy against competitors and market demand shifts in Llanarth.
Llanarth STR Booking Lead Time Analysis (2026)
Average Booking Lead Time by Month
Booking Lead Time Insights for Llanarth
- The overall average booking lead time for vacation rentals in Llanarth is 54 days.
- Guests book furthest in advance for stays during August (average 76 days), likely coinciding with peak travel demand or local events.
- The shortest booking windows occur for stays in January (average 25 days), indicating more last-minute travel plans during this time.
- Seasonally, Summer (69 days avg.) sees the longest lead times, while Spring (43 days avg.) has the shortest, reflecting typical travel planning cycles.
Recommendations for Hosts
- Use the overall average lead time (54 days) as a baseline for your pricing and availability strategy in Llanarth.
- For August stays, consider implementing length-of-stay discounts or slightly higher rates for bookings made less than 76 days out to capitalize on advance planning.
- Target marketing efforts for the Summer season well in advance (at least 69 days) to capture early planners.
- Monitor your own booking lead times against these Llanarth averages to identify opportunities for dynamic pricing adjustments.
Popular & Essential Airbnb Amenities in Llanarth (2026)
Amenity Prevalence
Amenity Insights for Llanarth
- Essential amenities in Llanarth that guests expect include: Heating, Hot water, Smoke alarm, Kitchen. Lacking these (any) could significantly impact bookings.
- Popular amenities like Free parking on premises, Fire extinguisher, Bed linens are common but not universal. Offering these can provide a competitive edge.
Recommendations for Hosts
- Ensure your listing includes all essential amenities for Llanarth: Heating, Hot water, Smoke alarm, Kitchen.
- Prioritize adding missing essentials: Hot water, Smoke alarm, Kitchen.
- Consider adding popular differentiators like Free parking on premises or Fire extinguisher to increase appeal.
- Highlight unique or less common amenities you offer (e.g., hot tub, dedicated workspace, EV charger) in your listing description and photos.
- Regularly check competitor amenities in Llanarth to stay competitive.
Llanarth Airbnb Guest Demographics & Profile Analysis (2026)
Guest Profile Summary for Llanarth
- The typical guest profile for Airbnb in Llanarth consists of primarily domestic travelers (96%), often arriving from nearby England, typically belonging to the Post-2000s (Gen Z/Alpha) group (50%), primarily speaking English or French.
- Domestic travelers account for 96.2% of guests.
- Key international markets include United Kingdom (96.2%) and United States (1.6%).
- Top languages spoken are English (75%) followed by French (5.2%).
- A significant demographic segment is the Post-2000s (Gen Z/Alpha) group, representing 50% of guests.
Recommendations for Hosts
- Target domestic marketing efforts towards travelers from England and Cardiff.
- Tailor amenities and listing descriptions to appeal to the dominant Post-2000s (Gen Z/Alpha) demographic (e.g., highlight fast WiFi, smart home features, local guides).
- Highlight unique local experiences or amenities relevant to the primary guest profile.
- Consider seasonal promotions aligned with peak travel times for key origin markets.
Nearby Short-Term Rental Market Comparison
How does the Llanarth Airbnb market stack up against its neighbors? Compare key performance metrics like average monthly revenue, ADR, and occupancy rates in surrounding areas to understand the broader regional STR landscape.
| Market | Active Properties | Monthly Revenue | Daily Rate | Avg. Occupancy |
|---|---|---|---|---|
| Angle | 13 | $6,069 | $626.63 | 50% |
| Bont-dolgadfan | 10 | $5,458 | $293.24 | 58% |
| Milverton | 10 | $5,067 | $377.17 | 48% |
| Southerndown | 16 | $5,064 | $409.45 | 46% |
| Southgate | 13 | $4,781 | $282.69 | 56% |
| Llanbedr Dyffryn Clwyd | 10 | $4,746 | $463.17 | 38% |
| Bridgwater | 18 | $4,662 | $355.91 | 53% |
| Crai | 31 | $4,496 | $552.02 | 38% |
| Penmorfa | 19 | $4,330 | $454.12 | 46% |
| Rowen | 26 | $4,220 | $376.11 | 46% |