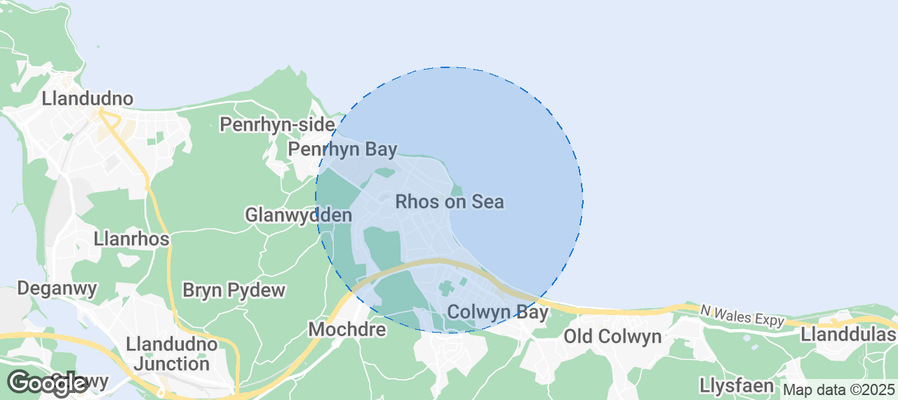
Rhos Airbnb Market Analysis 2026: Short Term Rental Data & Vacation Rental Statistics in Wales, United Kingdom
Is Airbnb profitable in Rhos in 2026? Explore comprehensive Airbnb analytics for Rhos, Wales, United Kingdom to uncover income potential. This 2026 STR market report for Rhos, based on AirROI data from February 2025 to January 2026, reveals key trends in the niche market of 20 active listings.
Whether you're considering an Airbnb investment in Rhos, optimizing your existing vacation rental, or exploring rental arbitrage opportunities, understanding the Rhos Airbnb data is crucial. Leveraging the low regulation environment is key to maximizing your short term rental income potential. Let's dive into the specifics.
Key Rhos Airbnb Performance Metrics Overview
Monthly Airbnb Revenue Variations & Income Potential in Rhos (2026)
Understanding the monthly revenue variations for Airbnb listings in Rhos is key to maximizing your short term rental income potential. Seasonality significantly impacts earnings. Our analysis, based on data from the past 12 months, shows that the peak revenue month for STRs in Rhos is typically August, while January often presents the lowest earnings, highlighting opportunities for strategic pricing adjustments during shoulder and low seasons. Explore the typical Airbnb income in Rhos across different performance tiers:
- Best-in-class properties (Top 10%) achieve $5,940+ monthly, often utilizing dynamic pricing and superior guest experiences.
- Strong performing properties (Top 25%) earn $4,425 or more, indicating effective management and desirable locations/amenities.
- Typical properties (Median) generate around $1,617 per month, representing the average market performance.
- Entry-level properties (Bottom 25%) see earnings around $825, often with potential for optimization.
Average Monthly Airbnb Earnings Trend in Rhos
Rhos Airbnb Occupancy Rate Trends (2026)
Maximize your bookings by understanding the Rhos STR occupancy trends. Seasonal demand shifts significantly influence how often properties are booked. Typically, Augustsees the highest demand (peak season occupancy), while December experiences the lowest (low season). Effective strategies, like adjusting minimum stays or offering promotions, can boost occupancy during slower periods. Here's how different property tiers perform in Rhos:
- Best-in-class properties (Top 10%) achieve 78%+ occupancy, indicating high desirability and potentially optimized availability.
- Strong performing properties (Top 25%) maintain 61% or higher occupancy, suggesting good market fit and guest satisfaction.
- Typical properties (Median) have an occupancy rate around 33%.
- Entry-level properties (Bottom 25%) average 19% occupancy, potentially facing higher vacancy.
Average Monthly Occupancy Rate Trend in Rhos
Average Daily Rate (ADR) Airbnb Trends in Rhos (2026)
Effective short term rental pricing strategy in Rhos involves understanding monthly ADR fluctuations. The Average Daily Rate (ADR) for Airbnb in Rhos typically peaks in August and dips lowest during March. Leveraging Airbnb dynamic pricing tools or strategies based on this seasonality can significantly boost revenue. Here's a look at the typical nightly rates achieved:
- Best-in-class properties (Top 10%) command rates of $299+ per night, often due to premium features or locations.
- Strong performing properties (Top 25%) achieve nightly rates of $251 or more.
- Typical properties (Median) charge around $132 per night.
- Entry-level properties (Bottom 25%) earn around $114 per night.
Average Daily Rate (ADR) Trend by Month in Rhos
Get Live Rhos Market Intelligence 👇
Explore Real-time Analytics
Airbnb Seasonality Analysis & Trends in Rhos (2026)
Peak Season (August, July, September)
- Revenue averages $4,618 per month
- Occupancy rates average 49.8%
- Daily rates average $210
Shoulder Season
- Revenue averages $2,343 per month
- Occupancy maintains around 42.4%
- Daily rates hold near $177
Low Season (January, November, December)
- Revenue drops to average $1,687 per month
- Occupancy decreases to average 30.4%
- Daily rates adjust to average $171
Seasonality Insights for Rhos
- The Airbnb seasonality in Rhos shows highly seasonal trends requiring careful strategy. While the sections above show seasonal averages, it's also insightful to look at the extremes:
- During the high season, the absolute peak month showcases Rhos's highest earning potential, with monthly revenues capable of climbing to $6,227, occupancy reaching a high of 57.1%, and ADRs peaking at $225.
- Conversely, the slowest single month of the year, typically falling within the low season, marks the market's lowest point. In this month, revenue might dip to $1,622, occupancy could drop to 26.6%, and ADRs may adjust down to $156.
- Understanding both the seasonal averages and these monthly peaks and troughs in revenue, occupancy, and ADR is crucial for maximizing your Airbnb profit potential in Rhos.
Seasonal Strategies for Maximizing Profit
- Peak Season: Maximize revenue through premium pricing and potentially longer minimum stays. Ensure high availability.
- Low Season: Offer competitive pricing, special promotions (e.g., extended stay discounts), and flexible cancellation policies. Target off-season travelers like remote workers or budget-conscious guests.
- Shoulder Seasons: Implement dynamic pricing that balances peak and low rates. Target weekend travelers or specific events. Offer slightly more flexible terms than peak season.
- Regularly analyze your own performance against these Rhos seasonality benchmarks and adjust your pricing and availability strategy accordingly.
Best Areas for Airbnb Investment in Rhos (2026)
Exploring the top neighborhoods for short-term rentals in Rhos? This section highlights key areas, outlining why they are attractive for hosts and guests, along with notable local attractions. Consider these locations based on your target guest profile and investment strategy.
| Neighborhood / Area | Why Host Here? (Target Guests & Appeal) | Key Attractions & Landmarks |
|---|---|---|
| Rhos-on-Sea Beach | A picturesque coastal area known for its beautiful sandy beach, perfect for families and tourists. The beach is a main draw for visitors looking to enjoy the seaside. | Rhos-on-Sea Promenade, Colwyn Bay, Marine Drive, Rhos Point, Holiday Home Park |
| Colwyn Bay | A nearby town that boasts a beautiful beach and a range of attractions, making it popular among tourists. Colwyn Bay offers entertainment, eateries, and a vibrant waterfront. | Bodatory Nature Reserve, Pavilion Theatre, Colwyn Bay Watersports, Welsh Mountain Zoo, Victoria Pier |
| Great Orme | A prominent limestone headland with stunning views and outdoor activities. It attracts both nature lovers and tourists seeking adventure or relaxation. | Great Orme Tramway, Llandudno Pier, Cable Car, Great Orme Mines, Wildlife watching |
| Llandudno | Known as the ‘Queen of the Welsh Resorts’, this Victorian seaside town has a mix of history, culture, and beautiful beaches. It's a significant draw for visitors all year round. | Llandudno Promenade, Venue Cymru, Mostyn Art Gallery, Llandudno Golf Club, Great Orme Country Park |
| Conwy | A historic town with a famous castle, attracting tourists interested in Welsh history and architecture. Its charming atmosphere and events make it a good location for Airbnb. | Conwy Castle, Plas Mawr, Conwy Town Walls, Coastal Path, Conwy Quay |
| Betws-y-Coed | A gateway to Snowdonia National Park, this village is loved for its outdoor activities and scenic beauty, making it a preferred location for nature enthusiasts. | Swallow Falls, Snowdonia National Park, Glen Feshie, Betws-y-Coed Railway Station, Rhaeadr Ogwen |
| Bodnant Garden | Renowned for its stunning horticultural displays, this garden attracts visitors interested in nature and photography, providing a unique Airbnb experience. | Bodnant Garden, River Glyn, Llanddoged Walk, Crafnant Valley, Restaurant and Cafe |
| Abergele | A charming seaside town with great amenities and attractions, perfect for family holidays. It provides a relaxed atmosphere close to the coast. | Gwrych Castle, Abergele Beach, Knightly's Funfair, Pentre Mawr Park, Conwy Water Gardens |
Understanding Airbnb License Requirements & STR Laws in Rhos (2026)
While Rhos, Wales, United Kingdom currently shows low STR regulations, specific Airbnb license requirements might still exist or change. Always verify the latest short term rental regulations and Airbnb license requirements directly with local government authorities for Rhos to ensure full compliance before hosting.
(Source: AirROI data, 2026, based on 5% licensed listings)
Top Performing Airbnb Properties in Rhos (2026)
Benchmark your potential! Explore examples of top-performing Airbnb properties in Rhosbased on Trailing Twelve Month (TTM) revenue. Analyze their characteristics, revenue, occupancy rate, and ADR to understand what drives success in this market.

3 Bed in Pontardawe (oc-c30415)
Entire Place • 3 bedrooms

and stabl-w43382
Entire Place • 2 bedrooms
3 Bed in Felindre (79198)
Entire Place • 3 bedrooms
2 Bed in Felindre (85444)
Entire Place • 2 bedrooms

Gwarcwm Farm Crog Loft Hot Tub and Riverside Sauna
Entire Place • 1 bedroom

The Milking Parlour
Entire Place • 2 bedrooms
Note: Performance varies based on location, size, amenities, seasonality, and management quality. Data reflects the past 12 months.
Top Performing Airbnb Hosts in Rhos (2026)
Learn from the best! This table showcases top-performing Airbnb hosts in Rhos based on the number of properties managed and estimated total revenue over the past year. Analyze their scale and performance metrics.
| Host Name | Properties | Grossing Revenue | Stay Reviews | Avg Rating |
|---|---|---|---|---|
| Cottages | 3 | $113,487 | 71 | 4.87/5.0 |
| Holidaycottages.Co.Uk | 2 | $85,334 | 8 | 4.83/5.0 |
| Wales Cottage Holidays | 1 | $77,572 | 2 | Not Rated |
| Fran | 5 | $45,284 | 85 | 4.96/5.0 |
| Holidaycottages.Co.Uk | 1 | $42,099 | 3 | 5.00/5.0 |
| Paul | 1 | $40,497 | 180 | 4.96/5.0 |
| Roger | 3 | $23,968 | 10 | 4.67/5.0 |
| Katy | 1 | $13,782 | 79 | 4.96/5.0 |
| Host #473668148 | 1 | $8,856 | 2 | Not Rated |
| Kay | 1 | $3,898 | 23 | 4.96/5.0 |
Analyzing the strategies of top hosts, such as their property selection, pricing, and guest communication, can offer valuable lessons for optimizing your own Airbnb operations in Rhos.
Dive Deeper: Advanced Rhos STR Market Data (2026)
Ready to unlock more insights? AirROI provides access to advanced metrics and comprehensive Airbnb data for Rhos. Explore detailed analytics beyond this report to refine your investment strategy, optimize pricing, and maximize your vacation rental profits.
Explore Advanced MetricsRhos Short-Term Rental Market Composition (2026): Property & Room Types
Room Type Distribution
Property Type Distribution
Market Composition Insights for Rhos
- The Rhos Airbnb market composition is heavily skewed towards Entire Home/Apt listings, which make up 85% of the 20 active rentals. This indicates strong guest preference for privacy and space.
- Looking at the property type distribution in Rhos, House properties are the most common (50%), reflecting the local real estate landscape.
- Houses represent a significant 50% portion, catering likely to families or larger groups.
Rhos Airbnb Room Capacity Analysis (2026): Bedroom Distribution
Distribution of Listings by Number of Bedrooms
Room Capacity Insights for Rhos
- The dominant room capacity in Rhos is 1 bedroom listings, making up 40% of the market. This suggests a strong demand for properties suitable for couples or solo travelers.
- Together, 1 bedroom and 2 bedrooms properties represent 70.0% of the active Airbnb listings in Rhos, indicating a high concentration in these sizes.
Rhos Vacation Rental Guest Capacity Trends (2026)
Distribution of Listings by Guest Capacity
Guest Capacity Insights for Rhos
- The most common guest capacity trend in Rhos vacation rentals is listings accommodating 4 guests (35%). This suggests the primary traveler segment is likely small families or groups.
- Properties designed for 4 guests and 2 guests dominate the Rhos STR market, accounting for 50.0% of listings.
- 20.0% of properties accommodate 6+ guests, serving the market segment for larger families or group travel in Rhos.
- On average, properties in Rhos are equipped to host 3.9 guests.
Rhos Airbnb Booking Patterns (2026): Available vs. Booked Days
Available Days Distribution
Booked Days Distribution
Booking Pattern Insights for Rhos
- The most common availability pattern in Rhos falls within the 271-366 days range, representing 45% of listings. This suggests many properties have significant open periods on their calendars.
- Approximately 90.0% of listings show high availability (181+ days open annually), indicating potential for increased bookings or specific owner usage patterns.
- For booked days, the 91-180 days range is most frequent in Rhos (40%), reflecting common guest stay durations or potential owner blocking patterns.
- A notable 15.0% of properties secure long booking periods (181+ days booked per year), highlighting successful long-term rental strategies or significant owner usage.
Rhos Airbnb Minimum Stay Requirements Analysis
Distribution of Listings by Minimum Night Requirement
1 Night
3 listings
15% of total
2 Nights
7 listings
35% of total
3 Nights
1 listings
5% of total
30+ Nights
9 listings
45% of total
Key Insights
- The most prevalent minimum stay requirement in Rhos is 30+ Nights, adopted by 45% of listings. This highlights the market's preference for longer commitments.
- A significant segment (45%) caters to monthly stays (30+ nights) in Rhos, pointing to opportunities in the extended-stay market.
Recommendations
- Align with the market by considering a 30+ Nights minimum stay, as 45% of Rhos hosts use this setting.
- If feasible, allowing 1-night stays, especially midweek or during low season, could capture last-minute bookings, as only 15% currently do.
- A 2-night minimum appears standard (35%). Consider this for weekends or peak periods.
- Explore offering discounts for stays of 30+ nights to attract the 45% of the market seeking extended stays.
- Adjust minimum nights based on seasonality – potentially shorter during low season and longer during peak demand periods in Rhos.
Rhos Airbnb Cancellation Policy Trends Analysis (2026)
Super Strict 60 Days
7 listings
35% of total
Flexible
3 listings
15% of total
Moderate
4 listings
20% of total
Firm
6 listings
30% of total
Cancellation Policy Insights for Rhos
- The prevailing Airbnb cancellation policy trend in Rhos is Super Strict 60 Days, used by 35% of listings.
- There's a relatively balanced mix between guest-friendly (35.0%) and stricter (30.0%) policies, offering choices for different guest needs.
Recommendations for Hosts
- Consider adopting a Super Strict 60 Days policy to align with the 35% market standard in Rhos.
- Regularly review your cancellation policy against competitors and market demand shifts in Rhos.
Rhos STR Booking Lead Time Analysis (2026)
Average Booking Lead Time by Month
Booking Lead Time Insights for Rhos
- The overall average booking lead time for vacation rentals in Rhos is 87 days.
- Guests book furthest in advance for stays during October (average 136 days), likely coinciding with peak travel demand or local events.
- The shortest booking windows occur for stays in January (average 26 days), indicating more last-minute travel plans during this time.
- Seasonally, Fall (109 days avg.) sees the longest lead times, while Winter (51 days avg.) has the shortest, reflecting typical travel planning cycles.
Recommendations for Hosts
- Use the overall average lead time (87 days) as a baseline for your pricing and availability strategy in Rhos.
- For October stays, consider implementing length-of-stay discounts or slightly higher rates for bookings made less than 136 days out to capitalize on advance planning.
- Target marketing efforts for the Fall season well in advance (at least 109 days) to capture early planners.
- Monitor your own booking lead times against these Rhos averages to identify opportunities for dynamic pricing adjustments.
Popular & Essential Airbnb Amenities in Rhos (2026)
Amenity Prevalence
Amenity Insights for Rhos
- Essential amenities in Rhos that guests expect include: Kitchen, Heating, Free parking on premises. Lacking these (any) could significantly impact bookings.
- Popular amenities like Backyard, Essentials, Dishes and silverware are common but not universal. Offering these can provide a competitive edge.
Recommendations for Hosts
- Ensure your listing includes all essential amenities for Rhos: Kitchen, Heating, Free parking on premises.
- Prioritize adding missing essentials: Kitchen, Heating, Free parking on premises.
- Consider adding popular differentiators like Backyard or Essentials to increase appeal.
- Highlight unique or less common amenities you offer (e.g., hot tub, dedicated workspace, EV charger) in your listing description and photos.
- Regularly check competitor amenities in Rhos to stay competitive.
Rhos Airbnb Guest Demographics & Profile Analysis (2026)
Guest Profile Summary for Rhos
- The typical guest profile for Airbnb in Rhos consists of primarily domestic travelers (94%), often arriving from nearby England, typically belonging to the Post-2000s (Gen Z/Alpha) group (50%), primarily speaking English or French.
- Domestic travelers account for 93.5% of guests.
- Key international markets include United Kingdom (93.5%) and United States (3.9%).
- Top languages spoken are English (57.1%) followed by French (11.4%).
- A significant demographic segment is the Post-2000s (Gen Z/Alpha) group, representing 50% of guests.
Recommendations for Hosts
- Target domestic marketing efforts towards travelers from England and Bristol.
- Tailor amenities and listing descriptions to appeal to the dominant Post-2000s (Gen Z/Alpha) demographic (e.g., highlight fast WiFi, smart home features, local guides).
- Highlight unique local experiences or amenities relevant to the primary guest profile.
- Consider seasonal promotions aligned with peak travel times for key origin markets.
Nearby Short-Term Rental Market Comparison
How does the Rhos Airbnb market stack up against its neighbors? Compare key performance metrics like average monthly revenue, ADR, and occupancy rates in surrounding areas to understand the broader regional STR landscape.
| Market | Active Properties | Monthly Revenue | Daily Rate | Avg. Occupancy |
|---|---|---|---|---|
| Angle | 13 | $6,069 | $626.63 | 50% |
| Bont-dolgadfan | 10 | $5,458 | $293.24 | 58% |
| Milverton | 10 | $5,067 | $377.17 | 48% |
| Southerndown | 16 | $5,064 | $409.45 | 46% |
| Southgate | 13 | $4,781 | $282.69 | 56% |
| Bridgwater | 18 | $4,662 | $355.91 | 53% |
| Crai | 31 | $4,496 | $552.02 | 38% |
| Penmorfa | 19 | $4,330 | $454.12 | 46% |
| New Polzeath | 17 | $4,089 | $281.24 | 54% |
| Llantrisant | 15 | $4,086 | $275.56 | 44% |