Bessemer Airbnb Market Analysis 2026: Short Term Rental Data & Vacation Rental Statistics in Alabama, United States
Is Airbnb profitable in Bessemer in 2026? Explore comprehensive Airbnb analytics for Bessemer, Alabama, United States to uncover income potential. This 2026 STR market report for Bessemer, based on AirROI data from February 2025 to January 2026, reveals key trends in the niche market of 26 active listings.
Whether you're considering an Airbnb investment in Bessemer, optimizing your existing vacation rental, or exploring rental arbitrage opportunities, understanding the Bessemer Airbnb data is crucial. Leveraging the low regulation environment is key to maximizing your short term rental income potential. Let's dive into the specifics.
Key Bessemer Airbnb Performance Metrics Overview
Monthly Airbnb Revenue Variations & Income Potential in Bessemer (2026)
Understanding the monthly revenue variations for Airbnb listings in Bessemer is key to maximizing your short term rental income potential. Seasonality significantly impacts earnings. Our analysis, based on data from the past 12 months, shows that the peak revenue month for STRs in Bessemer is typically July, while February often presents the lowest earnings, highlighting opportunities for strategic pricing adjustments during shoulder and low seasons. Explore the typical Airbnb income in Bessemer across different performance tiers:
- Best-in-class properties (Top 10%) achieve $5,020+ monthly, often utilizing dynamic pricing and superior guest experiences.
- Strong performing properties (Top 25%) earn $3,456 or more, indicating effective management and desirable locations/amenities.
- Typical properties (Median) generate around $2,215 per month, representing the average market performance.
- Entry-level properties (Bottom 25%) see earnings around $1,341, often with potential for optimization.
Average Monthly Airbnb Earnings Trend in Bessemer
Bessemer Airbnb Occupancy Rate Trends (2026)
Maximize your bookings by understanding the Bessemer STR occupancy trends. Seasonal demand shifts significantly influence how often properties are booked. Typically, Julysees the highest demand (peak season occupancy), while January experiences the lowest (low season). Effective strategies, like adjusting minimum stays or offering promotions, can boost occupancy during slower periods. Here's how different property tiers perform in Bessemer:
- Best-in-class properties (Top 10%) achieve 73%+ occupancy, indicating high desirability and potentially optimized availability.
- Strong performing properties (Top 25%) maintain 58% or higher occupancy, suggesting good market fit and guest satisfaction.
- Typical properties (Median) have an occupancy rate around 40%.
- Entry-level properties (Bottom 25%) average 25% occupancy, potentially facing higher vacancy.
Average Monthly Occupancy Rate Trend in Bessemer
Average Daily Rate (ADR) Airbnb Trends in Bessemer (2026)
Effective short term rental pricing strategy in Bessemer involves understanding monthly ADR fluctuations. The Average Daily Rate (ADR) for Airbnb in Bessemer typically peaks in September and dips lowest during March. Leveraging Airbnb dynamic pricing tools or strategies based on this seasonality can significantly boost revenue. Here's a look at the typical nightly rates achieved:
- Best-in-class properties (Top 10%) command rates of $299+ per night, often due to premium features or locations.
- Strong performing properties (Top 25%) achieve nightly rates of $243 or more.
- Typical properties (Median) charge around $175 per night.
- Entry-level properties (Bottom 25%) earn around $135 per night.
Average Daily Rate (ADR) Trend by Month in Bessemer
Get Live Bessemer Market Intelligence 👇

Explore Real-time Analytics
Airbnb Seasonality Analysis & Trends in Bessemer (2026)
Peak Season (July, October, June)
- Revenue averages $3,632 per month
- Occupancy rates average 54.4%
- Daily rates average $204
Shoulder Season
- Revenue averages $2,692 per month
- Occupancy maintains around 40.8%
- Daily rates hold near $200
Low Season (January, February, April)
- Revenue drops to average $1,798 per month
- Occupancy decreases to average 34.7%
- Daily rates adjust to average $183
Seasonality Insights for Bessemer
- The Airbnb seasonality in Bessemer shows highly seasonal trends requiring careful strategy. While the sections above show seasonal averages, it's also insightful to look at the extremes:
- During the high season, the absolute peak month showcases Bessemer's highest earning potential, with monthly revenues capable of climbing to $3,911, occupancy reaching a high of 60.7%, and ADRs peaking at $222.
- Conversely, the slowest single month of the year, typically falling within the low season, marks the market's lowest point. In this month, revenue might dip to $1,693, occupancy could drop to 24.8%, and ADRs may adjust down to $168.
- Understanding both the seasonal averages and these monthly peaks and troughs in revenue, occupancy, and ADR is crucial for maximizing your Airbnb profit potential in Bessemer.
Seasonal Strategies for Maximizing Profit
- Peak Season: Maximize revenue through premium pricing and potentially longer minimum stays. Ensure high availability.
- Low Season: Offer competitive pricing, special promotions (e.g., extended stay discounts), and flexible cancellation policies. Target off-season travelers like remote workers or budget-conscious guests.
- Shoulder Seasons: Implement dynamic pricing that balances peak and low rates. Target weekend travelers or specific events. Offer slightly more flexible terms than peak season.
- Regularly analyze your own performance against these Bessemer seasonality benchmarks and adjust your pricing and availability strategy accordingly.
Best Areas for Airbnb Investment in Bessemer (2026)
Exploring the top neighborhoods for short-term rentals in Bessemer? This section highlights key areas, outlining why they are attractive for hosts and guests, along with notable local attractions. Consider these locations based on your target guest profile and investment strategy.
| Neighborhood / Area | Why Host Here? (Target Guests & Appeal) | Key Attractions & Landmarks |
|---|---|---|
| Downtown Bessemer | The heart of Bessemer, offering access to dining, shopping, and local events. A central hub for visitors looking to explore the area and enjoy the local culture. | Bessemer Hall of History, Bessemer Civic Center, Bessemer Farmers Market, West Lake Park, New Bessemer City Hall |
| Black Creek Mountain | A scenic area known for its natural beauty and outdoor activities. Popular among nature lovers and those seeking a peaceful retreat away from the city. | Black Creek Trail, Smith Mountain, Lake Bessemer, Hiking and biking trails, Picnic areas |
| The Bessemer Airport Area | Convenient for travelers flying into and out of Birmingham, this area appeals to business travelers and those visiting nearby attractions. | Bessemer Airport, Corporate meeting venues, Airplane-themed attractions |
| Bessemer Historic District | Rich in history and charming architecture, this area attracts those interested in heritage and local history, perfect for cultural tourism. | Bessemer Historic District, Historic homes, Local museums, Guided historical tours |
| Riverview | Nestled by the river, this area is ideal for relaxing and enjoying riverfront activities. It attracts families and outdoor enthusiasts. | Riverside park, Fishing spots, Picnic areas, Walking trails, Scenic views |
| South Bessemer | A growing community with a mix of residential and commercial spaces, attracting visitors looking for a local experience away from the typical tourist spots. | Local shops, Community events, Dining options, Parks |
| The Bessemer Aloha | An up-and-coming neighborhood with a laid-back atmosphere, appealing to younger travelers seeking unique and affordable lodging options. | Cafes, Local art galleries, Music venues, Community parks |
| The Valleydale Area | A suburban area that combines peaceful living with convenient access to nearby Birmingham attractions, preferred by family-oriented travelers. | Neighborhood parks, Family-friendly restaurants, Shopping centers, Community activities |
Understanding Airbnb License Requirements & STR Laws in Bessemer (2026)
While Bessemer, Alabama, United States currently shows low STR regulations, specific Airbnb license requirements might still exist or change. Always verify the latest short term rental regulations and Airbnb license requirements directly with local government authorities for Bessemer to ensure full compliance before hosting.
(Source: AirROI data, 2026, finding no licensed listings among those analyzed)
Top Performing Airbnb Properties in Bessemer (2026)
Benchmark your potential! Explore examples of top-performing Airbnb properties in Bessemerbased on Trailing Twelve Month (TTM) revenue. Analyze their characteristics, revenue, occupancy rate, and ADR to understand what drives success in this market.
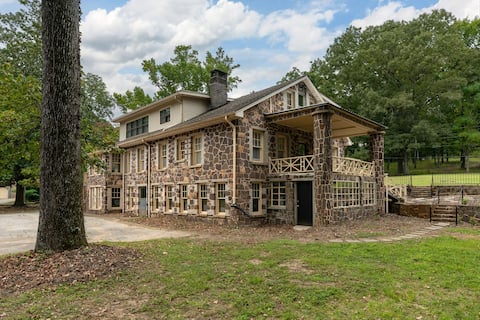
LARGE Stone Home convenient to UA, HooverMet, GOLF
Entire Place • 6 bedrooms
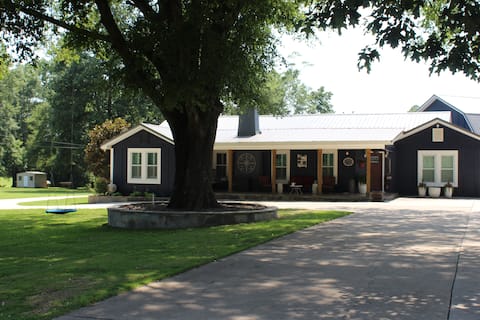
Waltons Retreat in McCalla Area
Entire Place • 3 bedrooms

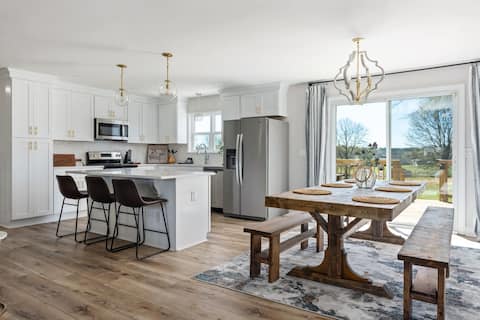
4 acre private Pool Modern Estate! Near Hoover Met
Entire Place • 3 bedrooms
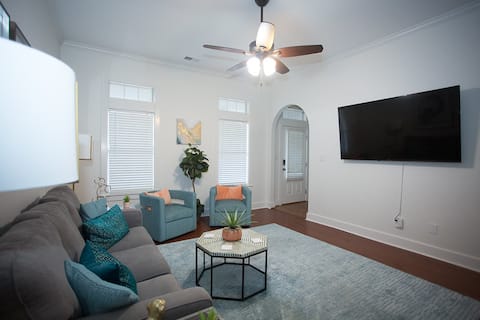
Getaway at Harpers Dairy!
Entire Place • 5 bedrooms

Large, 8-BED Cabin between Tuscaloosa, & Bham
Entire Place • 3 bedrooms
Home Away 4U: McCalla 3/2 Quiet One Level
Entire Place • 3 bedrooms
Note: Performance varies based on location, size, amenities, seasonality, and management quality. Data reflects the past 12 months.
Top Performing Airbnb Hosts in Bessemer (2026)
Learn from the best! This table showcases top-performing Airbnb hosts in Bessemer based on the number of properties managed and estimated total revenue over the past year. Analyze their scale and performance metrics.
| Host Name | Properties | Grossing Revenue | Stay Reviews | Avg Rating |
|---|---|---|---|---|
| Harold | 4 | $177,714 | 171 | 4.67/5.0 |
| Wendy | 3 | $101,942 | 98 | 4.90/5.0 |
| Barbara | 3 | $64,275 | 148 | 4.95/5.0 |
| Sean | 1 | $56,272 | 87 | 4.98/5.0 |
| Game On Bnbs LLC | 1 | $54,770 | 15 | 4.80/5.0 |
| Nathan And Dee | 1 | $43,788 | 101 | 4.93/5.0 |
| Rachel | 1 | $29,277 | 244 | 4.95/5.0 |
| Alise | 1 | $27,058 | 15 | 5.00/5.0 |
| Derrick | 1 | $25,011 | 13 | 4.85/5.0 |
| Kevin | 1 | $24,570 | 86 | 4.90/5.0 |
Analyzing the strategies of top hosts, such as their property selection, pricing, and guest communication, can offer valuable lessons for optimizing your own Airbnb operations in Bessemer.
Dive Deeper: Advanced Bessemer STR Market Data (2026)
Ready to unlock more insights? AirROI provides access to advanced metrics and comprehensive Airbnb data for Bessemer. Explore detailed analytics beyond this report to refine your investment strategy, optimize pricing, and maximize your vacation rental profits.
Explore Advanced MetricsBessemer Short-Term Rental Market Composition (2026): Property & Room Types
Room Type Distribution
Property Type Distribution
Market Composition Insights for Bessemer
- The Bessemer Airbnb market composition is heavily skewed towards Entire Home/Apt listings, which make up 100% of the 26 active rentals. This indicates strong guest preference for privacy and space.
- Looking at the property type distribution in Bessemer, House properties are the most common (92.3%), reflecting the local real estate landscape.
- Houses represent a significant 92.3% portion, catering likely to families or larger groups.
- Smaller segments like apartment/condo, outdoor/unique (combined 7.6%) offer potential for unique stay experiences.
Bessemer Airbnb Room Capacity Analysis (2026): Bedroom Distribution
Distribution of Listings by Number of Bedrooms
Room Capacity Insights for Bessemer
- The dominant room capacity in Bessemer is 3 bedrooms listings, making up 42.3% of the market. This suggests a strong demand for properties suitable for families or small groups.
- Together, 3 bedrooms and 2 bedrooms properties represent 80.8% of the active Airbnb listings in Bessemer, indicating a high concentration in these sizes.
- A significant 53.8% of listings offer 3+ bedrooms, catering to larger groups and families seeking more space in Bessemer.
Bessemer Vacation Rental Guest Capacity Trends (2026)
Distribution of Listings by Guest Capacity
Guest Capacity Insights for Bessemer
- The most common guest capacity trend in Bessemer vacation rentals is listings accommodating 6 guests (30.8%). This suggests the primary traveler segment is likely larger groups.
- Properties designed for 6 guests and 8+ guests dominate the Bessemer STR market, accounting for 61.6% of listings.
- 65.4% of properties accommodate 6+ guests, serving the market segment for larger families or group travel in Bessemer.
- On average, properties in Bessemer are equipped to host 6.0 guests.
Bessemer Airbnb Booking Patterns (2026): Available vs. Booked Days
Available Days Distribution
Booked Days Distribution
Booking Pattern Insights for Bessemer
- The most common availability pattern in Bessemer falls within the 181-270 days range, representing 61.5% of listings. This suggests many properties have significant open periods on their calendars.
- Approximately 76.9% of listings show high availability (181+ days open annually), indicating potential for increased bookings or specific owner usage patterns.
- For booked days, the 91-180 days range is most frequent in Bessemer (65.4%), reflecting common guest stay durations or potential owner blocking patterns.
- A notable 23.1% of properties secure long booking periods (181+ days booked per year), highlighting successful long-term rental strategies or significant owner usage.
Bessemer Airbnb Minimum Stay Requirements Analysis
Distribution of Listings by Minimum Night Requirement
1 Night
10 listings
38.5% of total
2 Nights
10 listings
38.5% of total
3 Nights
2 listings
7.7% of total
30+ Nights
4 listings
15.4% of total
Key Insights
- The most prevalent minimum stay requirement in Bessemer is 1 Night, adopted by 38.5% of listings. This highlights the market's preference for shorter, flexible bookings.
- A strong majority (77.0%) of the Bessemer Airbnb data shows acceptance of very short stays (1-2 nights), indicating a dynamic, high-turnover market.
- A significant segment (15.4%) caters to monthly stays (30+ nights) in Bessemer, pointing to opportunities in the extended-stay market.
Recommendations
- Align with the market by considering a 1 Night minimum stay, as 38.5% of Bessemer hosts use this setting.
- Explore offering discounts for stays of 30+ nights to attract the 15.4% of the market seeking extended stays.
- Adjust minimum nights based on seasonality – potentially shorter during low season and longer during peak demand periods in Bessemer.
Bessemer Airbnb Cancellation Policy Trends Analysis (2026)
Limited
1 listings
3.8% of total
Flexible
6 listings
23.1% of total
Moderate
7 listings
26.9% of total
Firm
8 listings
30.8% of total
Strict
4 listings
15.4% of total
Cancellation Policy Insights for Bessemer
- The prevailing Airbnb cancellation policy trend in Bessemer is Firm, used by 30.8% of listings.
- There's a relatively balanced mix between guest-friendly (50.0%) and stricter (46.2%) policies, offering choices for different guest needs.
Recommendations for Hosts
- Consider adopting a Firm policy to align with the 30.8% market standard in Bessemer.
- Regularly review your cancellation policy against competitors and market demand shifts in Bessemer.
Bessemer STR Booking Lead Time Analysis (2026)
Average Booking Lead Time by Month
Booking Lead Time Insights for Bessemer
- The overall average booking lead time for vacation rentals in Bessemer is 46 days.
- Guests book furthest in advance for stays during May (average 88 days), likely coinciding with peak travel demand or local events.
- The shortest booking windows occur for stays in January (average 15 days), indicating more last-minute travel plans during this time.
- Seasonally, Fall (57 days avg.) sees the longest lead times, while Winter (17 days avg.) has the shortest, reflecting typical travel planning cycles.
Recommendations for Hosts
- Use the overall average lead time (46 days) as a baseline for your pricing and availability strategy in Bessemer.
- For May stays, consider implementing length-of-stay discounts or slightly higher rates for bookings made less than 88 days out to capitalize on advance planning.
- Target marketing efforts for the Fall season well in advance (at least 57 days) to capture early planners.
- Monitor your own booking lead times against these Bessemer averages to identify opportunities for dynamic pricing adjustments.
Popular & Essential Airbnb Amenities in Bessemer (2026)
Amenity Prevalence
Amenity Insights for Bessemer
- Essential amenities in Bessemer that guests expect include: Smoke alarm, Air conditioning, TV, Microwave, Kitchen, Wifi, Dishes and silverware, Coffee maker, Heating, Free parking on premises. Lacking these (any) could significantly impact bookings.
Recommendations for Hosts
- Ensure your listing includes all essential amenities for Bessemer: Smoke alarm, Air conditioning, TV, Microwave, Kitchen, Wifi, Dishes and silverware, Coffee maker, Heating, Free parking on premises.
- Prioritize adding missing essentials: Microwave, Kitchen, Wifi, Dishes and silverware, Coffee maker, Heating, Free parking on premises.
- Highlight unique or less common amenities you offer (e.g., hot tub, dedicated workspace, EV charger) in your listing description and photos.
- Regularly check competitor amenities in Bessemer to stay competitive.
Bessemer Airbnb Guest Demographics & Profile Analysis (2026)
Guest Profile Summary for Bessemer
- The typical guest profile for Airbnb in Bessemer consists of primarily domestic travelers (99%), often arriving from nearby Birmingham, typically belonging to the Post-2000s (Gen Z/Alpha) group (50%), primarily speaking English or Spanish.
- Domestic travelers account for 98.8% of guests.
- Key international markets include United States (98.8%) and Guatemala (0.4%).
- Top languages spoken are English (82.1%) followed by Spanish (12.3%).
- A significant demographic segment is the Post-2000s (Gen Z/Alpha) group, representing 50% of guests.
Recommendations for Hosts
- Target domestic marketing efforts towards travelers from Birmingham and New Orleans.
- Tailor amenities and listing descriptions to appeal to the dominant Post-2000s (Gen Z/Alpha) demographic (e.g., highlight fast WiFi, smart home features, local guides).
- Highlight unique local experiences or amenities relevant to the primary guest profile.
- Consider seasonal promotions aligned with peak travel times for key origin markets.
Nearby Short-Term Rental Market Comparison
How does the Bessemer Airbnb market stack up against its neighbors? Compare key performance metrics like average monthly revenue, ADR, and occupancy rates in surrounding areas to understand the broader regional STR landscape.
| Market | Active Properties | Monthly Revenue | Daily Rate | Avg. Occupancy |
|---|---|---|---|---|
| Bremen | 23 | $4,914 | $603.74 | 33% |
| Arley | 47 | $4,531 | $525.71 | 35% |
| Millbrook | 13 | $4,317 | $283.83 | 51% |
| Jacksons' Gap | 45 | $4,249 | $467.96 | 37% |
| Shelby | 13 | $4,186 | $327.90 | 46% |
| Cedar Bluff | 37 | $3,805 | $390.28 | 36% |
| Eclectic | 54 | $3,784 | $425.35 | 37% |
| Equality | 14 | $3,679 | $664.55 | 29% |
| Lookout Mountain | 82 | $3,569 | $311.06 | 47% |
| Crane Hill | 98 | $3,479 | $452.36 | 35% |