Cedar Bluff Airbnb Market Analysis 2026: Short Term Rental Data & Vacation Rental Statistics in Alabama, United States
Is Airbnb profitable in Cedar Bluff in 2026? Explore comprehensive Airbnb analytics for Cedar Bluff, Alabama, United States to uncover income potential. This 2026 STR market report for Cedar Bluff, based on AirROI data from February 2025 to January 2026, reveals key trends in the niche market of 37 active listings.
Whether you're considering an Airbnb investment in Cedar Bluff, optimizing your existing vacation rental, or exploring rental arbitrage opportunities, understanding the Cedar Bluff Airbnb data is crucial. Leveraging the low regulation environment is key to maximizing your short term rental income potential. Let's dive into the specifics.
Key Cedar Bluff Airbnb Performance Metrics Overview
Monthly Airbnb Revenue Variations & Income Potential in Cedar Bluff (2026)
Understanding the monthly revenue variations for Airbnb listings in Cedar Bluff is key to maximizing your short term rental income potential. Seasonality significantly impacts earnings. Our analysis, based on data from the past 12 months, shows that the peak revenue month for STRs in Cedar Bluff is typically June, while January often presents the lowest earnings, highlighting opportunities for strategic pricing adjustments during shoulder and low seasons. Explore the typical Airbnb income in Cedar Bluff across different performance tiers:
- Best-in-class properties (Top 10%) achieve $8,322+ monthly, often utilizing dynamic pricing and superior guest experiences.
- Strong performing properties (Top 25%) earn $4,494 or more, indicating effective management and desirable locations/amenities.
- Typical properties (Median) generate around $2,863 per month, representing the average market performance.
- Entry-level properties (Bottom 25%) see earnings around $1,641, often with potential for optimization.
Average Monthly Airbnb Earnings Trend in Cedar Bluff
Cedar Bluff Airbnb Occupancy Rate Trends (2026)
Maximize your bookings by understanding the Cedar Bluff STR occupancy trends. Seasonal demand shifts significantly influence how often properties are booked. Typically, Junesees the highest demand (peak season occupancy), while January experiences the lowest (low season). Effective strategies, like adjusting minimum stays or offering promotions, can boost occupancy during slower periods. Here's how different property tiers perform in Cedar Bluff:
- Best-in-class properties (Top 10%) achieve 63%+ occupancy, indicating high desirability and potentially optimized availability.
- Strong performing properties (Top 25%) maintain 48% or higher occupancy, suggesting good market fit and guest satisfaction.
- Typical properties (Median) have an occupancy rate around 34%.
- Entry-level properties (Bottom 25%) average 22% occupancy, potentially facing higher vacancy.
Average Monthly Occupancy Rate Trend in Cedar Bluff
Average Daily Rate (ADR) Airbnb Trends in Cedar Bluff (2026)
Effective short term rental pricing strategy in Cedar Bluff involves understanding monthly ADR fluctuations. The Average Daily Rate (ADR) for Airbnb in Cedar Bluff typically peaks in September and dips lowest during January. Leveraging Airbnb dynamic pricing tools or strategies based on this seasonality can significantly boost revenue. Here's a look at the typical nightly rates achieved:
- Best-in-class properties (Top 10%) command rates of $464+ per night, often due to premium features or locations.
- Strong performing properties (Top 25%) achieve nightly rates of $315 or more.
- Typical properties (Median) charge around $238 per night.
- Entry-level properties (Bottom 25%) earn around $187 per night.
Average Daily Rate (ADR) Trend by Month in Cedar Bluff
Get Live Cedar Bluff Market Intelligence 👇

Explore Real-time Analytics
Airbnb Seasonality Analysis & Trends in Cedar Bluff (2026)
Peak Season (June, July, May)
- Revenue averages $7,732 per month
- Occupancy rates average 50.3%
- Daily rates average $377
Shoulder Season
- Revenue averages $4,860 per month
- Occupancy maintains around 36.6%
- Daily rates hold near $352
Low Season (January, February, March)
- Revenue drops to average $2,582 per month
- Occupancy decreases to average 22.5%
- Daily rates adjust to average $339
Seasonality Insights for Cedar Bluff
- The Airbnb seasonality in Cedar Bluff shows highly seasonal trends requiring careful strategy. While the sections above show seasonal averages, it's also insightful to look at the extremes:
- During the high season, the absolute peak month showcases Cedar Bluff's highest earning potential, with monthly revenues capable of climbing to $9,295, occupancy reaching a high of 58.0%, and ADRs peaking at $385.
- Conversely, the slowest single month of the year, typically falling within the low season, marks the market's lowest point. In this month, revenue might dip to $1,466, occupancy could drop to 16.6%, and ADRs may adjust down to $312.
- Understanding both the seasonal averages and these monthly peaks and troughs in revenue, occupancy, and ADR is crucial for maximizing your Airbnb profit potential in Cedar Bluff.
Seasonal Strategies for Maximizing Profit
- Peak Season: Maximize revenue through premium pricing and potentially longer minimum stays. Ensure high availability.
- Low Season: Offer competitive pricing, special promotions (e.g., extended stay discounts), and flexible cancellation policies. Target off-season travelers like remote workers or budget-conscious guests.
- Shoulder Seasons: Implement dynamic pricing that balances peak and low rates. Target weekend travelers or specific events. Offer slightly more flexible terms than peak season.
- Regularly analyze your own performance against these Cedar Bluff seasonality benchmarks and adjust your pricing and availability strategy accordingly.
Best Areas for Airbnb Investment in Cedar Bluff (2026)
Exploring the top neighborhoods for short-term rentals in Cedar Bluff? This section highlights key areas, outlining why they are attractive for hosts and guests, along with notable local attractions. Consider these locations based on your target guest profile and investment strategy.
| Neighborhood / Area | Why Host Here? (Target Guests & Appeal) | Key Attractions & Landmarks |
|---|---|---|
| Cedar Bluff Lake Area | Scenic views and outdoor activities make this area popular for water sports and relaxation during warmer months. Ideal for families and nature lovers looking for a getaway. | Cedar Bluff Marina, Lake Weiss, Fishing and boating activities, Camping sites, Nature trails |
| Downtown Cedar Bluff | A charming small-town area that features local shops, restaurants, and community events. Great for visitors looking to experience local culture and hospitality. | Cedar Bluff Community Park, Local dining options, Shopping and antique stores |
| Rome, GA nearby | Proximity to Rome, Georgia provides access to additional amenities and attractions while maintaining a small-town feel. Great for guests exploring both Alabama and Georgia. | Myrtle Hill Cemetery, Chieftains Museum, Historic Downtown Rome, Riverwalk |
| Neely Henry Lake | A popular destination for fishing and outdoor recreation. Appeals to anglers and families looking to stay near the lake for fun and relaxation. | Fishing and boating, Swimming areas, Picnic spots, Nature trails |
| Cherokee Rock Village | Known for its unique rock formations and climbing spots, this area attracts adventure enthusiasts and outdoor lovers looking for activities. | Rock climbing areas, Hiking trails, Stunning views, Nature photography opportunities |
| Little River Canyon | A natural wonder located nearby, perfect for those who enjoy hiking and exploring breathtaking landscapes. A top choice for nature-focused stays. | Little River Falls, Canyon Rim Centre, Hiking trails, Waterfalls and vistas |
| Fort Payne | Nearby city with additional attractions, making it an option for guests looking for shopping, dining, and entertainment within a short drive. | Noble Park, Fort Payne Depot Museum, Shopping in downtown, DeSoto State Park |
| Lookout Mountain | Close to Cedar Bluff, offering beautiful views and outdoor adventures such as hiking and rock climbing. Great for guests seeking a scenic retreat. | Lookout Mountain Hiking, Cloudland Canyon, Scenic overlooks, Historical sites |
Understanding Airbnb License Requirements & STR Laws in Cedar Bluff (2026)
While Cedar Bluff, Alabama, United States currently shows low STR regulations, specific Airbnb license requirements might still exist or change. Always verify the latest short term rental regulations and Airbnb license requirements directly with local government authorities for Cedar Bluff to ensure full compliance before hosting.
(Source: AirROI data, 2026, finding no licensed listings among those analyzed)
Top Performing Airbnb Properties in Cedar Bluff (2026)
Benchmark your potential! Explore examples of top-performing Airbnb properties in Cedar Bluffbased on Trailing Twelve Month (TTM) revenue. Analyze their characteristics, revenue, occupancy rate, and ADR to understand what drives success in this market.
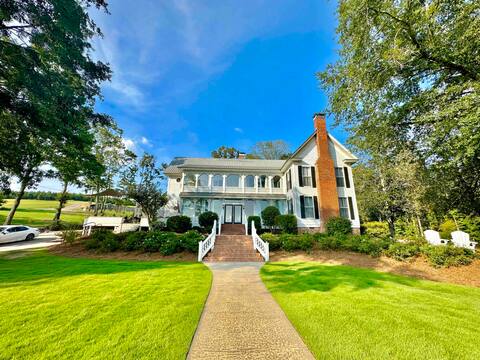
"The Magnolia House" Lakefront Compound -Sleeps 58
Entire Place • 12 bedrooms
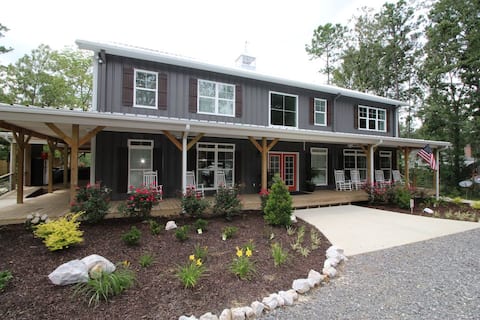
5 Star Lakefront home w/ pool & hot tub-Sleeps 40!
Entire Place • 9 bedrooms
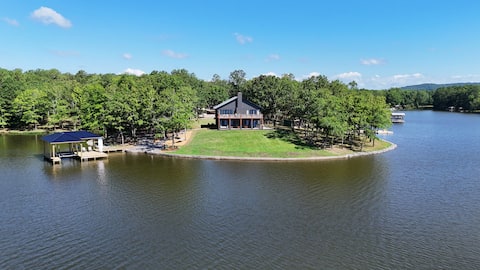
Lakeside Retreat/Cedar Bluff Weiss Lake Sleeps 18
Entire Place • 5 bedrooms

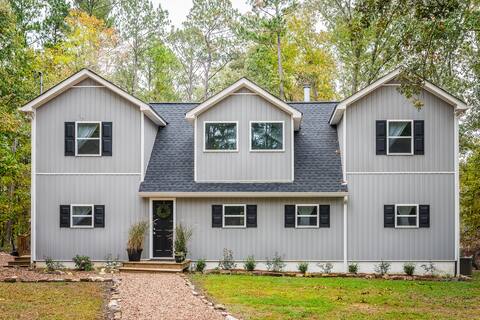
Lakefront Luxury. Hot Tub. Sauna. Fire Pit. Kayaks
Entire Place • 5 bedrooms
Lakefront House Weiss Lake With internet!
Entire Place • 5 bedrooms
"Double Studios" Pool, Hottub, Kayaks, Firepit
Entire Place • 2 bedrooms
Note: Performance varies based on location, size, amenities, seasonality, and management quality. Data reflects the past 12 months.
Top Performing Airbnb Hosts in Cedar Bluff (2026)
Learn from the best! This table showcases top-performing Airbnb hosts in Cedar Bluff based on the number of properties managed and estimated total revenue over the past year. Analyze their scale and performance metrics.
| Host Name | Properties | Grossing Revenue | Stay Reviews | Avg Rating |
|---|---|---|---|---|
| Dave | 12 | $1,046,359 | 334 | 4.99/5.0 |
| Thomas | 2 | $101,352 | 53 | 4.95/5.0 |
| Quinn | 1 | $73,298 | 29 | 5.00/5.0 |
| Kerry | 2 | $70,806 | 96 | 5.00/5.0 |
| Sarah | 1 | $66,534 | 76 | 4.92/5.0 |
| Weiss Lake Concierge, LLC | 4 | $49,255 | 23 | 4.89/5.0 |
| Lina | 1 | $40,974 | 21 | 4.81/5.0 |
| Chastity | 1 | $39,350 | 22 | 5.00/5.0 |
| Jeffery | 1 | $30,598 | 53 | 4.91/5.0 |
| Roger | 1 | $29,352 | 47 | 4.70/5.0 |
Analyzing the strategies of top hosts, such as their property selection, pricing, and guest communication, can offer valuable lessons for optimizing your own Airbnb operations in Cedar Bluff.
Dive Deeper: Advanced Cedar Bluff STR Market Data (2026)
Ready to unlock more insights? AirROI provides access to advanced metrics and comprehensive Airbnb data for Cedar Bluff. Explore detailed analytics beyond this report to refine your investment strategy, optimize pricing, and maximize your vacation rental profits.
Explore Advanced MetricsCedar Bluff Short-Term Rental Market Composition (2026): Property & Room Types
Room Type Distribution
Property Type Distribution
Market Composition Insights for Cedar Bluff
- The Cedar Bluff Airbnb market composition is heavily skewed towards Entire Home/Apt listings, which make up 100% of the 37 active rentals. This indicates strong guest preference for privacy and space.
- Looking at the property type distribution in Cedar Bluff, House properties are the most common (81.1%), reflecting the local real estate landscape.
- Houses represent a significant 81.1% portion, catering likely to families or larger groups.
- Smaller segments like hotel/boutique, others (combined 5.4%) offer potential for unique stay experiences.
Cedar Bluff Airbnb Room Capacity Analysis (2026): Bedroom Distribution
Distribution of Listings by Number of Bedrooms
Room Capacity Insights for Cedar Bluff
- The dominant room capacity in Cedar Bluff is 2 bedrooms listings, making up 29.7% of the market. This suggests a strong demand for properties suitable for couples or solo travelers.
- Together, 2 bedrooms and 4 bedrooms properties represent 51.3% of the active Airbnb listings in Cedar Bluff, indicating a high concentration in these sizes.
- A significant 54.0% of listings offer 3+ bedrooms, catering to larger groups and families seeking more space in Cedar Bluff.
Cedar Bluff Vacation Rental Guest Capacity Trends (2026)
Distribution of Listings by Guest Capacity
Guest Capacity Insights for Cedar Bluff
- The most common guest capacity trend in Cedar Bluff vacation rentals is listings accommodating 8+ guests (51.4%). This suggests the primary traveler segment is likely larger groups.
- Properties designed for 8+ guests and 6 guests dominate the Cedar Bluff STR market, accounting for 78.4% of listings.
- 81.1% of properties accommodate 6+ guests, serving the market segment for larger families or group travel in Cedar Bluff.
- On average, properties in Cedar Bluff are equipped to host 6.7 guests.
Cedar Bluff Airbnb Booking Patterns (2026): Available vs. Booked Days
Available Days Distribution
Booked Days Distribution
Booking Pattern Insights for Cedar Bluff
- The most common availability pattern in Cedar Bluff falls within the 181-270 days range, representing 51.4% of listings. This suggests many properties have significant open periods on their calendars.
- Approximately 94.6% of listings show high availability (181+ days open annually), indicating potential for increased bookings or specific owner usage patterns.
- For booked days, the 91-180 days range is most frequent in Cedar Bluff (48.6%), reflecting common guest stay durations or potential owner blocking patterns.
- A notable 8.1% of properties secure long booking periods (181+ days booked per year), highlighting successful long-term rental strategies or significant owner usage.
Cedar Bluff Airbnb Minimum Stay Requirements Analysis
Distribution of Listings by Minimum Night Requirement
1 Night
2 listings
5.4% of total
2 Nights
22 listings
59.5% of total
3 Nights
2 listings
5.4% of total
30+ Nights
11 listings
29.7% of total
Key Insights
- The most prevalent minimum stay requirement in Cedar Bluff is 2 Nights, adopted by 59.5% of listings. This highlights the market's preference for shorter, flexible bookings.
- A strong majority (64.9%) of the Cedar Bluff Airbnb data shows acceptance of very short stays (1-2 nights), indicating a dynamic, high-turnover market.
- A significant segment (29.7%) caters to monthly stays (30+ nights) in Cedar Bluff, pointing to opportunities in the extended-stay market.
Recommendations
- Align with the market by considering a 2 Nights minimum stay, as 59.5% of Cedar Bluff hosts use this setting.
- If feasible, allowing 1-night stays, especially midweek or during low season, could capture last-minute bookings, as only 5.4% currently do.
- A 2-night minimum appears standard (59.5%). Consider this for weekends or peak periods.
- Explore offering discounts for stays of 30+ nights to attract the 29.7% of the market seeking extended stays.
- Adjust minimum nights based on seasonality – potentially shorter during low season and longer during peak demand periods in Cedar Bluff.
Cedar Bluff Airbnb Cancellation Policy Trends Analysis (2026)
Super Strict 60 Days
1 listings
2.7% of total
Flexible
5 listings
13.5% of total
Moderate
2 listings
5.4% of total
Firm
25 listings
67.6% of total
Strict
4 listings
10.8% of total
Cancellation Policy Insights for Cedar Bluff
- The prevailing Airbnb cancellation policy trend in Cedar Bluff is Firm, used by 67.6% of listings.
- A majority (78.4%) of hosts in Cedar Bluff utilize Firm or Strict policies, indicating a market where hosts prioritize booking security.
Recommendations for Hosts
- Consider adopting a Firm policy to align with the 67.6% market standard in Cedar Bluff.
- Using a Strict policy might deter some guests, as only 10.8% of listings use it. Evaluate if potential revenue protection outweighs possible lower booking rates.
- Regularly review your cancellation policy against competitors and market demand shifts in Cedar Bluff.
Cedar Bluff STR Booking Lead Time Analysis (2026)
Average Booking Lead Time by Month
Booking Lead Time Insights for Cedar Bluff
- The overall average booking lead time for vacation rentals in Cedar Bluff is 63 days.
- Guests book furthest in advance for stays during November (average 117 days), likely coinciding with peak travel demand or local events.
- The shortest booking windows occur for stays in February (average 29 days), indicating more last-minute travel plans during this time.
- Seasonally, Fall (84 days avg.) sees the longest lead times, while Winter (36 days avg.) has the shortest, reflecting typical travel planning cycles.
Recommendations for Hosts
- Use the overall average lead time (63 days) as a baseline for your pricing and availability strategy in Cedar Bluff.
- For November stays, consider implementing length-of-stay discounts or slightly higher rates for bookings made less than 117 days out to capitalize on advance planning.
- Target marketing efforts for the Fall season well in advance (at least 84 days) to capture early planners.
- Monitor your own booking lead times against these Cedar Bluff averages to identify opportunities for dynamic pricing adjustments.
Popular & Essential Airbnb Amenities in Cedar Bluff (2026)
Amenity Prevalence
Amenity Insights for Cedar Bluff
- Essential amenities in Cedar Bluff that guests expect include: Free parking on premises, TV, Air conditioning, Heating. Lacking these (any) could significantly impact bookings.
- Popular amenities like Coffee maker, Kitchen, Bed linens are common but not universal. Offering these can provide a competitive edge.
Recommendations for Hosts
- Ensure your listing includes all essential amenities for Cedar Bluff: Free parking on premises, TV, Air conditioning, Heating.
- Prioritize adding missing essentials: TV, Air conditioning, Heating.
- Consider adding popular differentiators like Coffee maker or Kitchen to increase appeal.
- Highlight unique or less common amenities you offer (e.g., hot tub, dedicated workspace, EV charger) in your listing description and photos.
- Regularly check competitor amenities in Cedar Bluff to stay competitive.
Cedar Bluff Airbnb Guest Demographics & Profile Analysis (2026)
Guest Profile Summary for Cedar Bluff
- The typical guest profile for Airbnb in Cedar Bluff consists of primarily domestic travelers (98%), often arriving from nearby Atlanta, typically belonging to the Post-2000s (Gen Z/Alpha) group (50%), primarily speaking English or Spanish.
- Domestic travelers account for 97.5% of guests.
- Key international markets include United States (97.5%) and United Kingdom (0.6%).
- Top languages spoken are English (89.8%) followed by Spanish (6.1%).
- A significant demographic segment is the Post-2000s (Gen Z/Alpha) group, representing 50% of guests.
Recommendations for Hosts
- Target domestic marketing efforts towards travelers from Atlanta and Birmingham.
- Tailor amenities and listing descriptions to appeal to the dominant Post-2000s (Gen Z/Alpha) demographic (e.g., highlight fast WiFi, smart home features, local guides).
- Highlight unique local experiences or amenities relevant to the primary guest profile.
- Consider seasonal promotions aligned with peak travel times for key origin markets.
Nearby Short-Term Rental Market Comparison
How does the Cedar Bluff Airbnb market stack up against its neighbors? Compare key performance metrics like average monthly revenue, ADR, and occupancy rates in surrounding areas to understand the broader regional STR landscape.
| Market | Active Properties | Monthly Revenue | Daily Rate | Avg. Occupancy |
|---|---|---|---|---|
| Gilmer County | 26 | $5,298 | $459.59 | 40% |
| Brentwood | 14 | $4,937 | $601.43 | 47% |
| Fannin County | 42 | $4,574 | $435.93 | 38% |
| East Ellijay | 15 | $4,415 | $368.05 | 41% |
| Epworth | 79 | $4,411 | $406.97 | 40% |
| Shelby | 13 | $4,186 | $327.90 | 46% |
| Waleska | 45 | $4,041 | $373.64 | 42% |
| Coalmont | 13 | $3,864 | $240.00 | 52% |
| Blue Ridge | 1,346 | $3,859 | $347.45 | 41% |
| Loudon | 15 | $3,820 | $256.14 | 54% |