Piedmont Airbnb Market Analysis 2026: Short Term Rental Data & Vacation Rental Statistics in Alabama, United States
Is Airbnb profitable in Piedmont in 2026? Explore comprehensive Airbnb analytics for Piedmont, Alabama, United States to uncover income potential. This 2026 STR market report for Piedmont, based on AirROI data from February 2025 to January 2026, reveals key trends in the niche market of 20 active listings.
Whether you're considering an Airbnb investment in Piedmont, optimizing your existing vacation rental, or exploring rental arbitrage opportunities, understanding the Piedmont Airbnb data is crucial. Leveraging the low regulation environment is key to maximizing your short term rental income potential. Let's dive into the specifics.
Key Piedmont Airbnb Performance Metrics Overview
Monthly Airbnb Revenue Variations & Income Potential in Piedmont (2026)
Understanding the monthly revenue variations for Airbnb listings in Piedmont is key to maximizing your short term rental income potential. Seasonality significantly impacts earnings. Our analysis, based on data from the past 12 months, shows that the peak revenue month for STRs in Piedmont is typically July, while February often presents the lowest earnings, highlighting opportunities for strategic pricing adjustments during shoulder and low seasons. Explore the typical Airbnb income in Piedmont across different performance tiers:
- Best-in-class properties (Top 10%) achieve $3,614+ monthly, often utilizing dynamic pricing and superior guest experiences.
- Strong performing properties (Top 25%) earn $2,701 or more, indicating effective management and desirable locations/amenities.
- Typical properties (Median) generate around $1,649 per month, representing the average market performance.
- Entry-level properties (Bottom 25%) see earnings around $1,009, often with potential for optimization.
Average Monthly Airbnb Earnings Trend in Piedmont
Piedmont Airbnb Occupancy Rate Trends (2026)
Maximize your bookings by understanding the Piedmont STR occupancy trends. Seasonal demand shifts significantly influence how often properties are booked. Typically, Julysees the highest demand (peak season occupancy), while January experiences the lowest (low season). Effective strategies, like adjusting minimum stays or offering promotions, can boost occupancy during slower periods. Here's how different property tiers perform in Piedmont:
- Best-in-class properties (Top 10%) achieve 74%+ occupancy, indicating high desirability and potentially optimized availability.
- Strong performing properties (Top 25%) maintain 60% or higher occupancy, suggesting good market fit and guest satisfaction.
- Typical properties (Median) have an occupancy rate around 44%.
- Entry-level properties (Bottom 25%) average 28% occupancy, potentially facing higher vacancy.
Average Monthly Occupancy Rate Trend in Piedmont
Average Daily Rate (ADR) Airbnb Trends in Piedmont (2026)
Effective short term rental pricing strategy in Piedmont involves understanding monthly ADR fluctuations. The Average Daily Rate (ADR) for Airbnb in Piedmont typically peaks in September and dips lowest during April. Leveraging Airbnb dynamic pricing tools or strategies based on this seasonality can significantly boost revenue. Here's a look at the typical nightly rates achieved:
- Best-in-class properties (Top 10%) command rates of $186+ per night, often due to premium features or locations.
- Strong performing properties (Top 25%) achieve nightly rates of $139 or more.
- Typical properties (Median) charge around $105 per night.
- Entry-level properties (Bottom 25%) earn around $89 per night.
Average Daily Rate (ADR) Trend by Month in Piedmont
Get Live Piedmont Market Intelligence 👇

Explore Real-time Analytics
Airbnb Seasonality Analysis & Trends in Piedmont (2026)
Peak Season (July, May, December)
- Revenue averages $2,527 per month
- Occupancy rates average 56.4%
- Daily rates average $120
Shoulder Season
- Revenue averages $1,922 per month
- Occupancy maintains around 45.1%
- Daily rates hold near $121
Low Season (January, February, August)
- Revenue drops to average $1,467 per month
- Occupancy decreases to average 35.7%
- Daily rates adjust to average $120
Seasonality Insights for Piedmont
- The Airbnb seasonality in Piedmont shows moderate seasonality with distinct peak and low periods. While the sections above show seasonal averages, it's also insightful to look at the extremes:
- During the high season, the absolute peak month showcases Piedmont's highest earning potential, with monthly revenues capable of climbing to $2,669, occupancy reaching a high of 57.1%, and ADRs peaking at $127.
- Conversely, the slowest single month of the year, typically falling within the low season, marks the market's lowest point. In this month, revenue might dip to $1,431, occupancy could drop to 34.2%, and ADRs may adjust down to $116.
- Understanding both the seasonal averages and these monthly peaks and troughs in revenue, occupancy, and ADR is crucial for maximizing your Airbnb profit potential in Piedmont.
Seasonal Strategies for Maximizing Profit
- Peak Season: Maximize revenue through premium pricing and potentially longer minimum stays. Ensure high availability.
- Low Season: Offer competitive pricing, special promotions (e.g., extended stay discounts), and flexible cancellation policies. Target off-season travelers like remote workers or budget-conscious guests.
- Shoulder Seasons: Implement dynamic pricing that balances peak and low rates. Target weekend travelers or specific events. Offer slightly more flexible terms than peak season.
- Regularly analyze your own performance against these Piedmont seasonality benchmarks and adjust your pricing and availability strategy accordingly.
Best Areas for Airbnb Investment in Piedmont (2026)
Exploring the top neighborhoods for short-term rentals in Piedmont? This section highlights key areas, outlining why they are attractive for hosts and guests, along with notable local attractions. Consider these locations based on your target guest profile and investment strategy.
| Neighborhood / Area | Why Host Here? (Target Guests & Appeal) | Key Attractions & Landmarks |
|---|---|---|
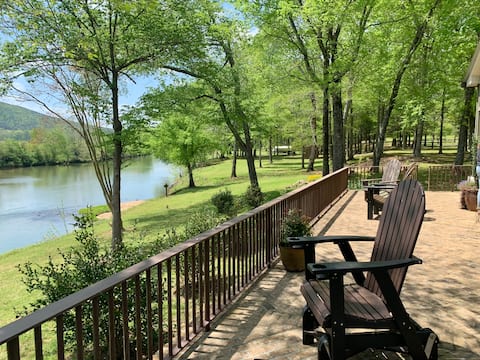
| Lake Martin | A popular recreational lake known for its stunning scenery and outdoor activities. It attracts tourists looking for water sports, fishing, and relaxation, making it a prime spot for vacation rentals. | Lake Martin, Wind Creek State Park, Cherokee Ridge Alpine Trail, Smith Mountain Park, Kowaliga, The Ridge Marina |
| Talladega National Forest | Offering an array of outdoor activities such as hiking, camping, and wildlife viewing, this area draws nature enthusiasts and adventure seekers. Perfect for Airbnb hosts looking to cater to those seeking outdoor experiences. | Talladega National Forest, Cheaha State Park, Bald Rock, Pipkin's Cove, Mount Cheaha, Lake Chinnabee |
| Downtown Birmingham | The cultural and economic hub of Alabama, with a variety of dining, entertainment, and arts options. Ideal for tourists and business travelers looking to explore the vibrant city life. | Birmingham Civil Rights Institute, Gus's World Famous Fried Chicken, Vulcan Park and Museum, Regions Field, Railroad Park |
| Anniston | Rich in history and close to outdoor recreational areas, Anniston attracts visitors looking for a blend of history and nature. Great for vacation rentals targeting families and history buffs. | Anniston Museums and Gardens, Berman Museum of World History, Cheaha Mountain, historic downtown Anniston |
| Montgomery | The capital city of Alabama, rich in civil rights history and cultural heritage. It attracts visitors interested in history, politics, and southern culture, making it a sought-after Airbnb destination. | Alabama State Capitol, Civil Rights Memorial, Dexter Avenue King Memorial Baptist Church, Montgomery Museum of Fine Arts, Old Alabama Town |
| Guntersville | Nestled near Guntersville Lake, this area is perfect for fishing, boating, and enjoying the outdoors, attracting families and nature lovers, ideal for lakefront Airbnb properties. | Lake Guntersville State Park, Guntersville Dam, Guntersville Museum and Cultural Center, Birdwatching and fishing spots, Water sports activities |
| Huntsville | Known for its space and rocket history, Huntsville attracts tourists interested in science and technology, as well as families. It has a variety of attractions that appeal to both leisure and business travelers. | U.S. Space & Rocket Center, Huntsville Botanical Garden, Monte Sano State Park, Downtown Huntsville shops, Lowe Mill ARTS & Entertainment |
| Fort Payne | A great gateway to the scenic Lookout Mountain area, perfect for visitors seeking outdoor adventures like hiking and mountain biking, making it a viable option for Airbnb investment. | Little River Canyon National Preserve, DeSoto State Park, Fort Payne Depot Museum, Unclaimed Baggage Center, Lookout Mountain |
Understanding Airbnb License Requirements & STR Laws in Piedmont (2026)
While Piedmont, Alabama, United States currently shows low STR regulations, specific Airbnb license requirements might still exist or change. Always verify the latest short term rental regulations and Airbnb license requirements directly with local government authorities for Piedmont to ensure full compliance before hosting.
(Source: AirROI data, 2026, finding no licensed listings among those analyzed)
Top Performing Airbnb Properties in Piedmont (2026)
Benchmark your potential! Explore examples of top-performing Airbnb properties in Piedmontbased on Trailing Twelve Month (TTM) revenue. Analyze their characteristics, revenue, occupancy rate, and ADR to understand what drives success in this market.

Creekside treehouse with hot tub
Entire Place • 1 bedroom
Water's Edge Lodge Terrapin Creek Fish/Bike/Kayak
Entire Place • 4 bedrooms

Chief Ladiga Creekside Cottage
Entire Place • 4 bedrooms

Copper Creek Cabin
Entire Place • 1 bedroom

The Roberts Home "Night in the Museum" Hotel
Entire Place • 2 bedrooms
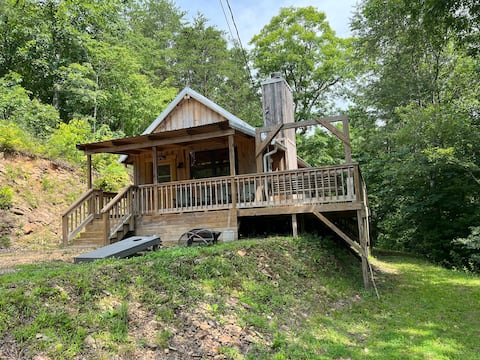
Mountain cabin getaway
Entire Place • 1 bedroom
Note: Performance varies based on location, size, amenities, seasonality, and management quality. Data reflects the past 12 months.
Top Performing Airbnb Hosts in Piedmont (2026)
Learn from the best! This table showcases top-performing Airbnb hosts in Piedmont based on the number of properties managed and estimated total revenue over the past year. Analyze their scale and performance metrics.
| Host Name | Properties | Grossing Revenue | Stay Reviews | Avg Rating |
|---|---|---|---|---|
| Paul | 4 | $57,354 | 169 | 4.86/5.0 |
| Matthew | 1 | $48,655 | 195 | 4.94/5.0 |
| Julie | 1 | $34,424 | 160 | 4.93/5.0 |
| Casey | 1 | $28,015 | 84 | 4.95/5.0 |
| Ben | 1 | $23,415 | 212 | 4.93/5.0 |
| Nora | 1 | $19,972 | 22 | 4.95/5.0 |
| Amanda | 1 | $18,682 | 142 | 4.96/5.0 |
| Gail | 1 | $16,366 | 33 | 5.00/5.0 |
| Lore’ | 1 | $15,702 | 253 | 4.79/5.0 |
| Ida | 1 | $13,961 | 5 | 5.00/5.0 |
Analyzing the strategies of top hosts, such as their property selection, pricing, and guest communication, can offer valuable lessons for optimizing your own Airbnb operations in Piedmont.
Dive Deeper: Advanced Piedmont STR Market Data (2026)
Ready to unlock more insights? AirROI provides access to advanced metrics and comprehensive Airbnb data for Piedmont. Explore detailed analytics beyond this report to refine your investment strategy, optimize pricing, and maximize your vacation rental profits.
Explore Advanced MetricsPiedmont Short-Term Rental Market Composition (2026): Property & Room Types
Room Type Distribution
Property Type Distribution
Market Composition Insights for Piedmont
- The Piedmont Airbnb market composition is heavily skewed towards Entire Home/Apt listings, which make up 90% of the 20 active rentals. This indicates strong guest preference for privacy and space.
- Looking at the property type distribution in Piedmont, House properties are the most common (40%), reflecting the local real estate landscape.
- Houses represent a significant 40% portion, catering likely to families or larger groups.
- The presence of 20% Hotel/Boutique listings indicates integration with traditional hospitality.
Piedmont Airbnb Room Capacity Analysis (2026): Bedroom Distribution
Distribution of Listings by Number of Bedrooms
Room Capacity Insights for Piedmont
- The dominant room capacity in Piedmont is 1 bedroom listings, making up 35% of the market. This suggests a strong demand for properties suitable for couples or solo travelers.
- Together, 1 bedroom and 2 bedrooms properties represent 60.0% of the active Airbnb listings in Piedmont, indicating a high concentration in these sizes.
Piedmont Vacation Rental Guest Capacity Trends (2026)
Distribution of Listings by Guest Capacity
Guest Capacity Insights for Piedmont
- The most common guest capacity trend in Piedmont vacation rentals is listings accommodating 3 guests (35%). This suggests the primary traveler segment is likely small families or groups.
- Properties designed for 3 guests and 4 guests dominate the Piedmont STR market, accounting for 65.0% of listings.
- 15.0% of properties accommodate 6+ guests, serving the market segment for larger families or group travel in Piedmont.
- On average, properties in Piedmont are equipped to host 4.0 guests.
Piedmont Airbnb Booking Patterns (2026): Available vs. Booked Days
Available Days Distribution
Booked Days Distribution
Booking Pattern Insights for Piedmont
- The most common availability pattern in Piedmont falls within the 271-366 days range, representing 50% of listings. This suggests many properties have significant open periods on their calendars.
- Approximately 80.0% of listings show high availability (181+ days open annually), indicating potential for increased bookings or specific owner usage patterns.
- For booked days, the 91-180 days range is most frequent in Piedmont (35%), reflecting common guest stay durations or potential owner blocking patterns.
- A notable 20.0% of properties secure long booking periods (181+ days booked per year), highlighting successful long-term rental strategies or significant owner usage.
Piedmont Airbnb Minimum Stay Requirements Analysis
Distribution of Listings by Minimum Night Requirement
1 Night
12 listings
60% of total
2 Nights
4 listings
20% of total
30+ Nights
4 listings
20% of total
Key Insights
- The most prevalent minimum stay requirement in Piedmont is 1 Night, adopted by 60% of listings. This highlights the market's preference for shorter, flexible bookings.
- A strong majority (80.0%) of the Piedmont Airbnb data shows acceptance of very short stays (1-2 nights), indicating a dynamic, high-turnover market.
- A significant segment (20%) caters to monthly stays (30+ nights) in Piedmont, pointing to opportunities in the extended-stay market.
Recommendations
- Align with the market by considering a 1 Night minimum stay, as 60% of Piedmont hosts use this setting.
- Explore offering discounts for stays of 30+ nights to attract the 20% of the market seeking extended stays.
- Adjust minimum nights based on seasonality – potentially shorter during low season and longer during peak demand periods in Piedmont.
Piedmont Airbnb Cancellation Policy Trends Analysis (2026)
Flexible
12 listings
60% of total
Moderate
5 listings
25% of total
Firm
3 listings
15% of total
Cancellation Policy Insights for Piedmont
- The prevailing Airbnb cancellation policy trend in Piedmont is Flexible, used by 60% of listings.
- The market strongly favors guest-friendly terms, with 85.0% of listings offering Flexible or Moderate policies. This suggests guests in Piedmont may expect booking flexibility.
Recommendations for Hosts
- Consider adopting a Flexible policy to align with the 60% market standard in Piedmont.
- Given the high prevalence of Flexible policies (60%), offering this can enhance booking appeal, especially during shoulder seasons.
- Regularly review your cancellation policy against competitors and market demand shifts in Piedmont.
Piedmont STR Booking Lead Time Analysis (2026)
Average Booking Lead Time by Month
Booking Lead Time Insights for Piedmont
- The overall average booking lead time for vacation rentals in Piedmont is 36 days.
- Guests book furthest in advance for stays during October (average 73 days), likely coinciding with peak travel demand or local events.
- The shortest booking windows occur for stays in February (average 18 days), indicating more last-minute travel plans during this time.
- Seasonally, Fall (60 days avg.) sees the longest lead times, while Summer (35 days avg.) has the shortest, reflecting typical travel planning cycles.
Recommendations for Hosts
- Use the overall average lead time (36 days) as a baseline for your pricing and availability strategy in Piedmont.
- For October stays, consider implementing length-of-stay discounts or slightly higher rates for bookings made less than 73 days out to capitalize on advance planning.
- Target marketing efforts for the Fall season well in advance (at least 60 days) to capture early planners.
- Monitor your own booking lead times against these Piedmont averages to identify opportunities for dynamic pricing adjustments.
Popular & Essential Airbnb Amenities in Piedmont (2026)
Amenity Prevalence
Amenity Insights for Piedmont
- Essential amenities in Piedmont that guests expect include: Free parking on premises, Wifi, Air conditioning, Heating. Lacking these (any) could significantly impact bookings.
- Popular amenities like TV, Hot water, Pets allowed are common but not universal. Offering these can provide a competitive edge.
Recommendations for Hosts
- Ensure your listing includes all essential amenities for Piedmont: Free parking on premises, Wifi, Air conditioning, Heating.
- Prioritize adding missing essentials: Heating.
- Consider adding popular differentiators like TV or Hot water to increase appeal.
- Highlight unique or less common amenities you offer (e.g., hot tub, dedicated workspace, EV charger) in your listing description and photos.
- Regularly check competitor amenities in Piedmont to stay competitive.
Piedmont Airbnb Guest Demographics & Profile Analysis (2026)
Guest Profile Summary for Piedmont
- The typical guest profile for Airbnb in Piedmont consists of primarily domestic travelers (98%), often arriving from nearby Atlanta, typically belonging to the Post-2000s (Gen Z/Alpha) group (50%), primarily speaking English or Spanish.
- Domestic travelers account for 97.7% of guests.
- Key international markets include United States (97.7%) and United Kingdom (1.1%).
- Top languages spoken are English (84.7%) followed by Spanish (5.6%).
- A significant demographic segment is the Post-2000s (Gen Z/Alpha) group, representing 50% of guests.
Recommendations for Hosts
- Target domestic marketing efforts towards travelers from Atlanta and Mobile.
- Tailor amenities and listing descriptions to appeal to the dominant Post-2000s (Gen Z/Alpha) demographic (e.g., highlight fast WiFi, smart home features, local guides).
- Highlight unique local experiences or amenities relevant to the primary guest profile.
- Consider seasonal promotions aligned with peak travel times for key origin markets.
Nearby Short-Term Rental Market Comparison
How does the Piedmont Airbnb market stack up against its neighbors? Compare key performance metrics like average monthly revenue, ADR, and occupancy rates in surrounding areas to understand the broader regional STR landscape.
| Market | Active Properties | Monthly Revenue | Daily Rate | Avg. Occupancy |
|---|---|---|---|---|
| Gilmer County | 26 | $5,298 | $459.59 | 40% |
| Fannin County | 42 | $4,574 | $435.93 | 38% |
| East Ellijay | 15 | $4,415 | $368.05 | 41% |
| Epworth | 79 | $4,411 | $406.97 | 40% |
| Millbrook | 13 | $4,317 | $283.83 | 51% |
| Jacksons' Gap | 45 | $4,249 | $467.96 | 37% |
| Shelby | 13 | $4,186 | $327.90 | 46% |
| Waleska | 45 | $4,041 | $373.64 | 42% |
| Blue Ridge | 1,346 | $3,859 | $347.45 | 41% |
| Cedar Bluff | 37 | $3,805 | $390.28 | 36% |