Tillmans Corner Airbnb Market Analysis 2026: Short Term Rental Data & Vacation Rental Statistics in Alabama, United States
Is Airbnb profitable in Tillmans Corner in 2026? Explore comprehensive Airbnb analytics for Tillmans Corner, Alabama, United States to uncover income potential. This 2026 STR market report for Tillmans Corner, based on AirROI data from February 2025 to January 2026, reveals key trends in the niche market of 25 active listings.
Whether you're considering an Airbnb investment in Tillmans Corner, optimizing your existing vacation rental, or exploring rental arbitrage opportunities, understanding the Tillmans Corner Airbnb data is crucial. Leveraging the low regulation environment is key to maximizing your short term rental income potential. Let's dive into the specifics.
Key Tillmans Corner Airbnb Performance Metrics Overview
Monthly Airbnb Revenue Variations & Income Potential in Tillmans Corner (2026)
Understanding the monthly revenue variations for Airbnb listings in Tillmans Corner is key to maximizing your short term rental income potential. Seasonality significantly impacts earnings. Our analysis, based on data from the past 12 months, shows that the peak revenue month for STRs in Tillmans Corner is typically July, while January often presents the lowest earnings, highlighting opportunities for strategic pricing adjustments during shoulder and low seasons. Explore the typical Airbnb income in Tillmans Corner across different performance tiers:
- Best-in-class properties (Top 10%) achieve $2,961+ monthly, often utilizing dynamic pricing and superior guest experiences.
- Strong performing properties (Top 25%) earn $1,392 or more, indicating effective management and desirable locations/amenities.
- Typical properties (Median) generate around $850 per month, representing the average market performance.
- Entry-level properties (Bottom 25%) see earnings around $434, often with potential for optimization.
Average Monthly Airbnb Earnings Trend in Tillmans Corner
Tillmans Corner Airbnb Occupancy Rate Trends (2026)
Maximize your bookings by understanding the Tillmans Corner STR occupancy trends. Seasonal demand shifts significantly influence how often properties are booked. Typically, Februarysees the highest demand (peak season occupancy), while January experiences the lowest (low season). Effective strategies, like adjusting minimum stays or offering promotions, can boost occupancy during slower periods. Here's how different property tiers perform in Tillmans Corner:
- Best-in-class properties (Top 10%) achieve 84%+ occupancy, indicating high desirability and potentially optimized availability.
- Strong performing properties (Top 25%) maintain 69% or higher occupancy, suggesting good market fit and guest satisfaction.
- Typical properties (Median) have an occupancy rate around 51%.
- Entry-level properties (Bottom 25%) average 30% occupancy, potentially facing higher vacancy.
Average Monthly Occupancy Rate Trend in Tillmans Corner
Average Daily Rate (ADR) Airbnb Trends in Tillmans Corner (2026)
Effective short term rental pricing strategy in Tillmans Corner involves understanding monthly ADR fluctuations. The Average Daily Rate (ADR) for Airbnb in Tillmans Corner typically peaks in January and dips lowest during April. Leveraging Airbnb dynamic pricing tools or strategies based on this seasonality can significantly boost revenue. Here's a look at the typical nightly rates achieved:
- Best-in-class properties (Top 10%) command rates of $159+ per night, often due to premium features or locations.
- Strong performing properties (Top 25%) achieve nightly rates of $83 or more.
- Typical properties (Median) charge around $42 per night.
- Entry-level properties (Bottom 25%) earn around $37 per night.
Average Daily Rate (ADR) Trend by Month in Tillmans Corner
Get Live Tillmans Corner Market Intelligence 👇

Explore Real-time Analytics
Airbnb Seasonality Analysis & Trends in Tillmans Corner (2026)
Peak Season (July, August, March)
- Revenue averages $1,379 per month
- Occupancy rates average 53.4%
- Daily rates average $67
Shoulder Season
- Revenue averages $1,220 per month
- Occupancy maintains around 50.4%
- Daily rates hold near $68
Low Season (January, February, September)
- Revenue drops to average $1,041 per month
- Occupancy decreases to average 48.4%
- Daily rates adjust to average $70
Seasonality Insights for Tillmans Corner
- The Airbnb seasonality in Tillmans Corner shows moderate seasonality with distinct peak and low periods. While the sections above show seasonal averages, it's also insightful to look at the extremes:
- During the high season, the absolute peak month showcases Tillmans Corner's highest earning potential, with monthly revenues capable of climbing to $1,415, occupancy reaching a high of 60.5%, and ADRs peaking at $74.
- Conversely, the slowest single month of the year, typically falling within the low season, marks the market's lowest point. In this month, revenue might dip to $870, occupancy could drop to 37.4%, and ADRs may adjust down to $61.
- Understanding both the seasonal averages and these monthly peaks and troughs in revenue, occupancy, and ADR is crucial for maximizing your Airbnb profit potential in Tillmans Corner.
Seasonal Strategies for Maximizing Profit
- Peak Season: Maximize revenue through premium pricing and potentially longer minimum stays. Ensure high availability.
- Low Season: Offer competitive pricing, special promotions (e.g., extended stay discounts), and flexible cancellation policies. Target off-season travelers like remote workers or budget-conscious guests.
- Shoulder Seasons: Implement dynamic pricing that balances peak and low rates. Target weekend travelers or specific events. Offer slightly more flexible terms than peak season.
- Regularly analyze your own performance against these Tillmans Corner seasonality benchmarks and adjust your pricing and availability strategy accordingly.
Best Areas for Airbnb Investment in Tillmans Corner (2026)
Exploring the top neighborhoods for short-term rentals in Tillmans Corner? This section highlights key areas, outlining why they are attractive for hosts and guests, along with notable local attractions. Consider these locations based on your target guest profile and investment strategy.
| Neighborhood / Area | Why Host Here? (Target Guests & Appeal) | Key Attractions & Landmarks |
|---|---|---|
| Tillmans Corner | A growing suburban area close to Mobile with convenient access to local amenities and parks. Ideal for families and travelers looking for a quieter stay while still accessible to the city. | Mobile Carnival Museum, Theodore O'Connor Park, Turtle Point Environmental Center, Local dining options, Nearby shopping centers |
| West Mobile | Quick access to the Mobile Bay and outdoor activities, this area is perfect for those interested in nature and adventure, making it a great choice for guests looking to explore the outdoors. | Mobile Bay, Dauphin Island, Bellingrath Gardens and Home, Magnolia Grove Golf Club, Gulf Coast Exploreum, USS Alabama Battleship Memorial Park |
| Daphne | Charming coastal city known for its lovely parks and proximity to the Gulf Coast. Attracts visitors for its beautiful scenery and outdoor activities. | Timber Creek Golf Course, Daphne Bayfront Park, Lake Forest Golf Club, Bishop Park, Eastern Shore Art Center |
| Fairhope | Artistic coastal town famous for its vibrant community and pristine waterfront. Great for those looking for boutique shopping, art galleries, and scenic views. | Fairhope Pier, Local art galleries, Mobile Bay waterfront, Fairhope Museum of History, Baldwin County Heritage Museum |
| Somerset | A developing neighborhood that is seeing growth and interest from visitors. Close to transportation routes and local amenities, making it a practical choice for Airbnb. | Local parks, Shopping centers, Restaurants, Near Mobile attractions |
| Orange Beach | Popular vacation destination known for its gorgeous beaches and family-friendly activities. Ideal for tourists seeking a seaside getaway. | Gulf State Park, Orange Beach Marina, Adventure Island, Local Seafood Restaurants, Waterville USA |
| Birmingham | The largest city in Alabama, known for its rich history and cultural attractions. A hub for business and tourism, making it an attractive location for short-term rentals. | Civil Rights Institute, Birmingham Zoo, Vulcan Park and Museum, Sloss Furnaces National Historic Landmark, Local culinary scene |
| Gulf Shores | Famous for its stunning beaches and vacation rentals. A top destination in Alabama for family vacations and recreational activities, perfect for Airbnb hosting. | Gulf Shores Beach, Gulf State Park, Waterville USA, Fishing and boating activities, Local shops and dining |
Understanding Airbnb License Requirements & STR Laws in Tillmans Corner (2026)
While Tillmans Corner, Alabama, United States currently shows low STR regulations, specific Airbnb license requirements might still exist or change. Always verify the latest short term rental regulations and Airbnb license requirements directly with local government authorities for Tillmans Corner to ensure full compliance before hosting.
(Source: AirROI data, 2026, finding no licensed listings among those analyzed)
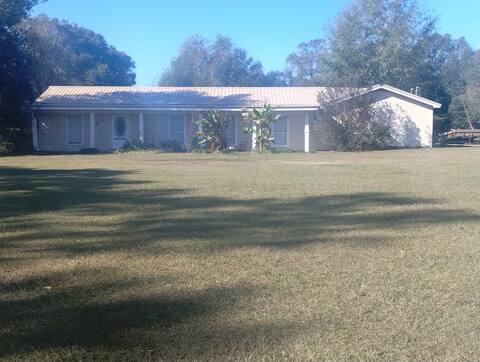
Top Performing Airbnb Properties in Tillmans Corner (2026)
Benchmark your potential! Explore examples of top-performing Airbnb properties in Tillmans Cornerbased on Trailing Twelve Month (TTM) revenue. Analyze their characteristics, revenue, occupancy rate, and ADR to understand what drives success in this market.
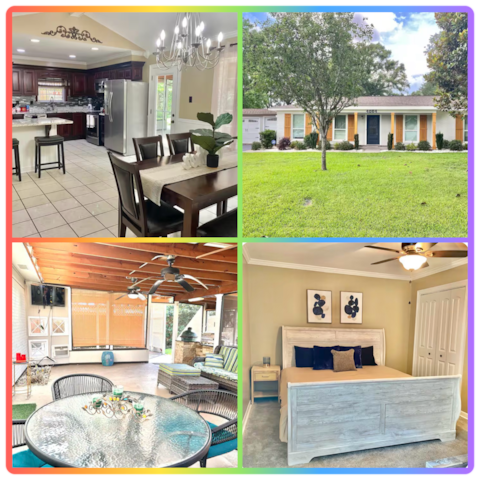
Stylish Home w/Screened Patio and Fenced Backyard
Entire Place • 3 bedrooms

Johnson Oaks
Entire Place • 3 bedrooms

Spacious Farmhouse Ranch Near Mobile!
Entire Place • 4 bedrooms

Three Notch Cutie
Entire Place • 3 bedrooms
Sweet Home Alabama
Entire Place • 4 bedrooms
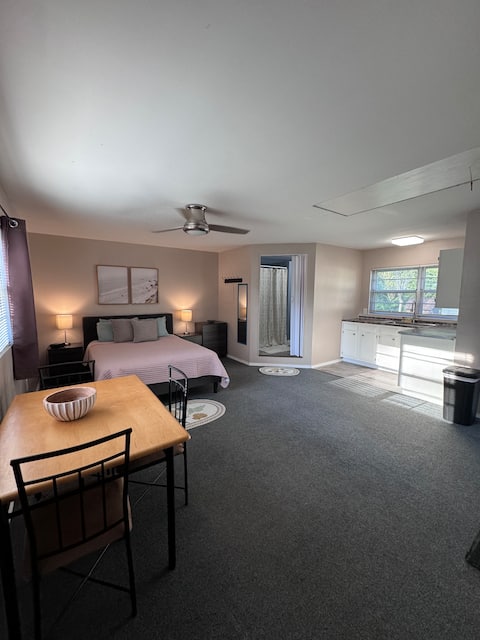
Coastal Guest House
Entire Place • 1 bedroom
Note: Performance varies based on location, size, amenities, seasonality, and management quality. Data reflects the past 12 months.
Top Performing Airbnb Hosts in Tillmans Corner (2026)
Learn from the best! This table showcases top-performing Airbnb hosts in Tillmans Corner based on the number of properties managed and estimated total revenue over the past year. Analyze their scale and performance metrics.
| Host Name | Properties | Grossing Revenue | Stay Reviews | Avg Rating |
|---|---|---|---|---|
| Bridgette | 18 | $107,183 | 686 | 4.81/5.0 |
| John | 1 | $44,709 | 111 | 4.64/5.0 |
| Lydia | 1 | $35,696 | 87 | 4.91/5.0 |
| Meg | 1 | $32,169 | 89 | 4.65/5.0 |
| Lee Anna | 1 | $28,543 | 106 | 4.93/5.0 |
| Jerry | 1 | $18,675 | 7 | 5.00/5.0 |
| Drake | 1 | $14,647 | 87 | 4.92/5.0 |
| Ben | 1 | $12,024 | 84 | 4.94/5.0 |
Analyzing the strategies of top hosts, such as their property selection, pricing, and guest communication, can offer valuable lessons for optimizing your own Airbnb operations in Tillmans Corner.
Dive Deeper: Advanced Tillmans Corner STR Market Data (2026)
Ready to unlock more insights? AirROI provides access to advanced metrics and comprehensive Airbnb data for Tillmans Corner. Explore detailed analytics beyond this report to refine your investment strategy, optimize pricing, and maximize your vacation rental profits.
Explore Advanced MetricsTillmans Corner Short-Term Rental Market Composition (2026): Property & Room Types
Room Type Distribution
Property Type Distribution
Market Composition Insights for Tillmans Corner
- The Tillmans Corner Airbnb market composition is heavily skewed towards Private Room listings, which make up 72% of the 25 active rentals. This indicates strong guest preference for privacy and space.
- Looking at the property type distribution in Tillmans Corner, House properties are the most common (96%), reflecting the local real estate landscape.
- Houses represent a significant 96% portion, catering likely to families or larger groups.
- Smaller segments like hotel/boutique (combined 4.0%) offer potential for unique stay experiences.
Tillmans Corner Airbnb Room Capacity Analysis (2026): Bedroom Distribution
Distribution of Listings by Number of Bedrooms
Room Capacity Insights for Tillmans Corner
- The dominant room capacity in Tillmans Corner is 3 bedrooms listings, making up 36% of the market. This suggests a strong demand for properties suitable for families or small groups.
- Together, 3 bedrooms and 4 bedrooms properties represent 56.0% of the active Airbnb listings in Tillmans Corner, indicating a high concentration in these sizes.
- A significant 56.0% of listings offer 3+ bedrooms, catering to larger groups and families seeking more space in Tillmans Corner.
Tillmans Corner Vacation Rental Guest Capacity Trends (2026)
Distribution of Listings by Guest Capacity
Guest Capacity Insights for Tillmans Corner
- The most common guest capacity trend in Tillmans Corner vacation rentals is listings accommodating 6 guests (8%). This suggests the primary traveler segment is likely larger groups.
- Properties designed for 6 guests and 2 guests dominate the Tillmans Corner STR market, accounting for 16.0% of listings.
- 20.0% of properties accommodate 6+ guests, serving the market segment for larger families or group travel in Tillmans Corner.
- On average, properties in Tillmans Corner are equipped to host 1.7 guests.
Tillmans Corner Airbnb Booking Patterns (2026): Available vs. Booked Days
Available Days Distribution
Booked Days Distribution
Booking Pattern Insights for Tillmans Corner
- The most common availability pattern in Tillmans Corner falls within the 181-270 days range, representing 52% of listings. This suggests many properties have significant open periods on their calendars.
- Approximately 68.0% of listings show high availability (181+ days open annually), indicating potential for increased bookings or specific owner usage patterns.
- For booked days, the 91-180 days range is most frequent in Tillmans Corner (44%), reflecting common guest stay durations or potential owner blocking patterns.
- A notable 40.0% of properties secure long booking periods (181+ days booked per year), highlighting successful long-term rental strategies or significant owner usage.
Tillmans Corner Airbnb Minimum Stay Requirements Analysis
Distribution of Listings by Minimum Night Requirement
1 Night
20 listings
80% of total
2 Nights
2 listings
8% of total
3 Nights
1 listings
4% of total
7-29 Nights
1 listings
4% of total
30+ Nights
1 listings
4% of total
Key Insights
- The most prevalent minimum stay requirement in Tillmans Corner is 1 Night, adopted by 80% of listings. This highlights the market's preference for shorter, flexible bookings.
- A strong majority (88.0%) of the Tillmans Corner Airbnb data shows acceptance of very short stays (1-2 nights), indicating a dynamic, high-turnover market.
Recommendations
- Align with the market by considering a 1 Night minimum stay, as 80% of Tillmans Corner hosts use this setting.
- Adjust minimum nights based on seasonality – potentially shorter during low season and longer during peak demand periods in Tillmans Corner.
Tillmans Corner Airbnb Cancellation Policy Trends Analysis (2026)
Limited
1 listings
4% of total
Flexible
19 listings
76% of total
Moderate
3 listings
12% of total
Firm
2 listings
8% of total
Cancellation Policy Insights for Tillmans Corner
- The prevailing Airbnb cancellation policy trend in Tillmans Corner is Flexible, used by 76% of listings.
- The market strongly favors guest-friendly terms, with 88.0% of listings offering Flexible or Moderate policies. This suggests guests in Tillmans Corner may expect booking flexibility.
Recommendations for Hosts
- Consider adopting a Flexible policy to align with the 76% market standard in Tillmans Corner.
- Given the high prevalence of Flexible policies (76%), offering this can enhance booking appeal, especially during shoulder seasons.
- Regularly review your cancellation policy against competitors and market demand shifts in Tillmans Corner.
Tillmans Corner STR Booking Lead Time Analysis (2026)
Average Booking Lead Time by Month
Booking Lead Time Insights for Tillmans Corner
- The overall average booking lead time for vacation rentals in Tillmans Corner is 14 days.
- Guests book furthest in advance for stays during June (average 22 days), likely coinciding with peak travel demand or local events.
- The shortest booking windows occur for stays in January (average 5 days), indicating more last-minute travel plans during this time.
- Seasonally, Summer (18 days avg.) sees the longest lead times, while Winter (11 days avg.) has the shortest, reflecting typical travel planning cycles.
Recommendations for Hosts
- Use the overall average lead time (14 days) as a baseline for your pricing and availability strategy in Tillmans Corner.
- During January, focus on last-minute booking availability and promotions, as guests book with very short notice (5 days avg.).
- Target marketing efforts for the Summer season well in advance (at least 18 days) to capture early planners.
- Monitor your own booking lead times against these Tillmans Corner averages to identify opportunities for dynamic pricing adjustments.
Popular & Essential Airbnb Amenities in Tillmans Corner (2026)
Amenity Prevalence
No amenities with partial availability (less than 100%) were found to display in the chart. All essential amenities might be present in all listings. Check insights below.
Amenity Insights for Tillmans Corner
- Essential amenities in Tillmans Corner that guests expect include: Backyard, Air conditioning, Coffee maker, Fire extinguisher, Smoke alarm, Cooking basics, Free parking on premises, Hot water, Wifi, TV. Lacking these (any) could significantly impact bookings.
Recommendations for Hosts
- Ensure your listing includes all essential amenities for Tillmans Corner: Backyard, Air conditioning, Coffee maker, Fire extinguisher, Smoke alarm, Cooking basics, Free parking on premises, Hot water, Wifi, TV.
- Highlight unique or less common amenities you offer (e.g., hot tub, dedicated workspace, EV charger) in your listing description and photos.
- Regularly check competitor amenities in Tillmans Corner to stay competitive.
Tillmans Corner Airbnb Guest Demographics & Profile Analysis (2026)
Guest Profile Summary for Tillmans Corner
- The typical guest profile for Airbnb in Tillmans Corner consists of primarily domestic travelers (94%), often arriving from nearby Mobile, typically belonging to the Post-2000s (Gen Z/Alpha) group (50%), primarily speaking English or Spanish.
- Domestic travelers account for 94.2% of guests.
- Key international markets include United States (94.2%) and France (2.9%).
- Top languages spoken are English (57.3%) followed by Spanish (20.8%).
- A significant demographic segment is the Post-2000s (Gen Z/Alpha) group, representing 50% of guests.
Recommendations for Hosts
- Target domestic marketing efforts towards travelers from Mobile and Austin.
- Tailor amenities and listing descriptions to appeal to the dominant Post-2000s (Gen Z/Alpha) demographic (e.g., highlight fast WiFi, smart home features, local guides).
- Highlight unique local experiences or amenities relevant to the primary guest profile.
- Consider seasonal promotions aligned with peak travel times for key origin markets.
Nearby Short-Term Rental Market Comparison
How does the Tillmans Corner Airbnb market stack up against its neighbors? Compare key performance metrics like average monthly revenue, ADR, and occupancy rates in surrounding areas to understand the broader regional STR landscape.
| Market | Active Properties | Monthly Revenue | Daily Rate | Avg. Occupancy |
|---|---|---|---|---|
| Plaquemines Parish | 28 | $4,733 | $413.26 | 40% |
| Perdido Beach | 10 | $4,353 | $297.45 | 51% |
| Pensacola Beach | 968 | $4,082 | $443.49 | 39% |
| Gulf Shores | 4,957 | $3,593 | $385.93 | 40% |
| Baldwin County | 18 | $3,536 | $453.18 | 36% |
| Dauphin Island | 612 | $3,407 | $376.02 | 38% |
| Fairhope | 201 | $3,335 | $295.20 | 43% |
| Orange Beach | 4,106 | $3,271 | $396.08 | 37% |
| Escambia County | 115 | $3,028 | $443.63 | 38% |
| Gulf Breeze | 563 | $2,972 | $333.27 | 41% |