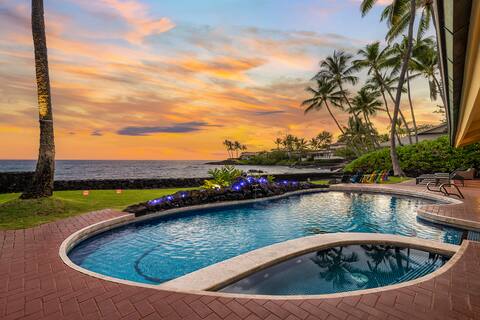
Holualoa Airbnb Market Analysis 2026: Short Term Rental Data & Vacation Rental Statistics in Hawaii, United States
Is Airbnb profitable in Holualoa in 2026? Explore comprehensive Airbnb analytics for Holualoa, Hawaii, United States to uncover income potential. This 2026 STR market report for Holualoa, based on AirROI data from February 2025 to January 2026, reveals key trends in the market of 815 active listings.
Whether you're considering an Airbnb investment in Holualoa, optimizing your existing vacation rental, or exploring rental arbitrage opportunities, understanding the Holualoa Airbnb data is crucial. Navigating the high regulation landscape is key to maximizing your short term rental income potential. Let's dive into the specifics.
Key Holualoa Airbnb Performance Metrics Overview
Monthly Airbnb Revenue Variations & Income Potential in Holualoa (2026)
Understanding the monthly revenue variations for Airbnb listings in Holualoa is key to maximizing your short term rental income potential. Seasonality significantly impacts earnings. Our analysis, based on data from the past 12 months, shows that the peak revenue month for STRs in Holualoa is typically February, while May often presents the lowest earnings, highlighting opportunities for strategic pricing adjustments during shoulder and low seasons. Explore the typical Airbnb income in Holualoa across different performance tiers:
- Best-in-class properties (Top 10%) achieve $11,890+ monthly, often utilizing dynamic pricing and superior guest experiences.
- Strong performing properties (Top 25%) earn $7,083 or more, indicating effective management and desirable locations/amenities.
- Typical properties (Median) generate around $4,118 per month, representing the average market performance.
- Entry-level properties (Bottom 25%) see earnings around $2,144, often with potential for optimization.
Average Monthly Airbnb Earnings Trend in Holualoa
Holualoa Airbnb Occupancy Rate Trends (2026)
Maximize your bookings by understanding the Holualoa STR occupancy trends. Seasonal demand shifts significantly influence how often properties are booked. Typically, Februarysees the highest demand (peak season occupancy), while January experiences the lowest (low season). Effective strategies, like adjusting minimum stays or offering promotions, can boost occupancy during slower periods. Here's how different property tiers perform in Holualoa:
- Best-in-class properties (Top 10%) achieve 89%+ occupancy, indicating high desirability and potentially optimized availability.
- Strong performing properties (Top 25%) maintain 78% or higher occupancy, suggesting good market fit and guest satisfaction.
- Typical properties (Median) have an occupancy rate around 55%.
- Entry-level properties (Bottom 25%) average 27% occupancy, potentially facing higher vacancy.
Average Monthly Occupancy Rate Trend in Holualoa
Average Daily Rate (ADR) Airbnb Trends in Holualoa (2026)
Effective short term rental pricing strategy in Holualoa involves understanding monthly ADR fluctuations. The Average Daily Rate (ADR) for Airbnb in Holualoa typically peaks in January and dips lowest during May. Leveraging Airbnb dynamic pricing tools or strategies based on this seasonality can significantly boost revenue. Here's a look at the typical nightly rates achieved:
- Best-in-class properties (Top 10%) command rates of $566+ per night, often due to premium features or locations.
- Strong performing properties (Top 25%) achieve nightly rates of $378 or more.
- Typical properties (Median) charge around $274 per night.
- Entry-level properties (Bottom 25%) earn around $200 per night.
Average Daily Rate (ADR) Trend by Month in Holualoa
Get Live Holualoa Market Intelligence 👇

Explore Real-time Analytics
Airbnb Seasonality Analysis & Trends in Holualoa (2026)
Peak Season (February, March, December)
- Revenue averages $6,661 per month
- Occupancy rates average 60.8%
- Daily rates average $347
Shoulder Season
- Revenue averages $5,663 per month
- Occupancy maintains around 50.8%
- Daily rates hold near $343
Low Season (May, June, September)
- Revenue drops to average $4,916 per month
- Occupancy decreases to average 48.4%
- Daily rates adjust to average $324
Seasonality Insights for Holualoa
- The Airbnb seasonality in Holualoa shows moderate seasonality with distinct peak and low periods. While the sections above show seasonal averages, it's also insightful to look at the extremes:
- During the high season, the absolute peak month showcases Holualoa's highest earning potential, with monthly revenues capable of climbing to $6,973, occupancy reaching a high of 69.7%, and ADRs peaking at $387.
- Conversely, the slowest single month of the year, typically falling within the low season, marks the market's lowest point. In this month, revenue might dip to $4,780, occupancy could drop to 47.1%, and ADRs may adjust down to $312.
- Understanding both the seasonal averages and these monthly peaks and troughs in revenue, occupancy, and ADR is crucial for maximizing your Airbnb profit potential in Holualoa.
Seasonal Strategies for Maximizing Profit
- Peak Season: Maximize revenue through premium pricing and potentially longer minimum stays. Ensure high availability.
- Low Season: Offer competitive pricing, special promotions (e.g., extended stay discounts), and flexible cancellation policies. Target off-season travelers like remote workers or budget-conscious guests.
- Shoulder Seasons: Implement dynamic pricing that balances peak and low rates. Target weekend travelers or specific events. Offer slightly more flexible terms than peak season.
- Regularly analyze your own performance against these Holualoa seasonality benchmarks and adjust your pricing and availability strategy accordingly.
Best Areas for Airbnb Investment in Holualoa (2026)
Exploring the top neighborhoods for short-term rentals in Holualoa? This section highlights key areas, outlining why they are attractive for hosts and guests, along with notable local attractions. Consider these locations based on your target guest profile and investment strategy.
| Neighborhood / Area | Why Host Here? (Target Guests & Appeal) | Key Attractions & Landmarks |
|---|---|---|
| Holualoa Village | Charming and artistic community known for its coffee farms and stunning ocean views. It's a peaceful retreat for travelers looking to relax and enjoy Hawaii's natural beauty. | Holualoa Coffee Farm Tour, Makoto's Kitchen, Kona Cloud Forest, Holualoa Gallery, Kona Historical Society |
| Kona Coast | Famous for its beautiful beaches and vibrant nightlife, the Kona Coast provides a perfect blend of relaxation and adventure for visitors. | Kailua-Kona, Kona Brewing Company, Magic Sands Beach Park, Kona Diving, Kona Coffee Living History Farm |
| Waimea | Known for its lush greenery and agricultural activities, Waimea attracts those interested in nature, ranching, and cultural experiences. | Waimea District Park, Parker Ranch, Pololu Valley, Waimea Cherry Blossom Festival, Kohala Mountain |
| Honaunau | Rich in Hawaiian history and culture, Honaunau is ideal for those interested in ancient sites and marine activities, offering a quieter experience. | Pu'uhonua o Honaunau National Historical Park, Honaunau Bay, Two Step Beach, The Painted Church, Honaunau Coffee |
| Captain Cook | A laid-back town known for its coffee farms and proximity to historical sites, great for travelers wanting a more local experience. | Captain Cook Monument, Kealakekua Bay, Greenwell Farms, Kona Historical Society, Aloha Theatre |
| Kaimu | Located near the lava flow area, Kaimu is unique for its volcanic beaches and natural beauty, attracting adventurous travelers. | Kaimu Black Sand Beach, Kalapana, Lava Viewing Area, Uncle Robert's Awa Bar, Kaimu Beach |
| Napoopoo | A small community that serves as the gateway to Captain Cook, popular for snorkeling and the famous Captain Cook monument. | Kealakekua Bay, Captain Cook Monument, Snorkeling Tours, Hiking Trails, Local Artisans |
| South Kona | Known for less crowded beaches and tranquil atmosphere, South Kona is perfect for those looking for a serene getaway with great ocean views. | Manini'owali Beach (Kua Bay), Punaluu Black Sand Beach, Ho'okena Beach Park, Kona Coffee Trail, Secret Beach |
Understanding Airbnb License Requirements & STR Laws in Holualoa (2026)
Yes, Holualoa, Hawaii, United States enforces high STR regulations. Obtaining a license and ensuring compliance is almost certainly required according to current 2026 STR laws. Always verify the latest short term rental regulations and Airbnb license requirements directly with local government authorities for Holualoa to ensure full compliance before hosting.
(Source: AirROI data, 2026, based on 54% licensed listings)
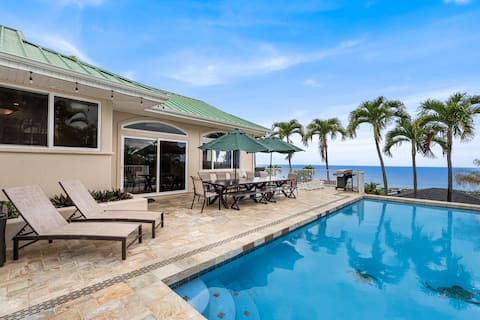
Top Performing Airbnb Properties in Holualoa (2026)
Benchmark your potential! Explore examples of top-performing Airbnb properties in Holualoabased on Trailing Twelve Month (TTM) revenue. Analyze their characteristics, revenue, occupancy rate, and ADR to understand what drives success in this market.
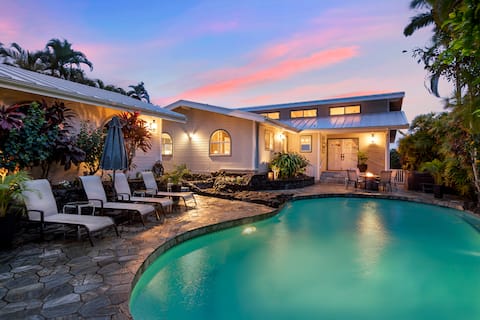
Hale Pua: Private Oceanfront w Pool Hot Tub & AC
Entire Place • 5 bedrooms
Robertson's Beach House
Entire Place • 4 bedrooms
Ultra Private Luxury Oceanfront Compound
Entire Place • 4 bedrooms
Honu Hale: Oceanview Estate w/ Pool, Hot Tub, AC
Entire Place • 5 bedrooms
Breezy Pool Oasis 5BR AC Ocean Views 5min to Beach
Entire Place • 5 bedrooms
LuxuryHome, Stunning ocean sunset, Heated Pool/Spa
Entire Place • 4 bedrooms
Note: Performance varies based on location, size, amenities, seasonality, and management quality. Data reflects the past 12 months.
Top Performing Airbnb Hosts in Holualoa (2026)
Learn from the best! This table showcases top-performing Airbnb hosts in Holualoa based on the number of properties managed and estimated total revenue over the past year. Analyze their scale and performance metrics.
| Host Name | Properties | Grossing Revenue | Stay Reviews | Avg Rating |
|---|---|---|---|---|
| Gather Vacations | 27 | $4,449,878 | 1067 | 4.78/5.0 |
| Knutson & Associates | 53 | $1,754,836 | 675 | 4.74/5.0 |
| Holly | 13 | $1,162,392 | 1237 | 4.95/5.0 |
| Kona Coast Vacations | 57 | $888,661 | 438 | 4.70/5.0 |
| Coldwell Banker Island Vacatio | 15 | $758,628 | 230 | 4.64/5.0 |
| First Island | 7 | $663,965 | 328 | 4.73/5.0 |
| Casago Kona | 8 | $606,892 | 310 | 4.64/5.0 |
| Sumit | 2 | $589,671 | 251 | 4.96/5.0 |
| Big Island Stays LLC | 17 | $553,207 | 473 | 4.79/5.0 |
| Lisa | 2 | $469,238 | 111 | 4.92/5.0 |
Analyzing the strategies of top hosts, such as their property selection, pricing, and guest communication, can offer valuable lessons for optimizing your own Airbnb operations in Holualoa.
Dive Deeper: Advanced Holualoa STR Market Data (2026)
Ready to unlock more insights? AirROI provides access to advanced metrics and comprehensive Airbnb data for Holualoa. Explore detailed analytics beyond this report to refine your investment strategy, optimize pricing, and maximize your vacation rental profits.
Explore Advanced MetricsHolualoa Short-Term Rental Market Composition (2026): Property & Room Types
Room Type Distribution
Property Type Distribution
Market Composition Insights for Holualoa
- The Holualoa Airbnb market composition is heavily skewed towards Entire Home/Apt listings, which make up 95.3% of the 815 active rentals. This indicates strong guest preference for privacy and space.
- Looking at the property type distribution in Holualoa, Apartment/Condo properties are the most common (72.8%), reflecting the local real estate landscape.
- Houses represent a significant 19.9% portion, catering likely to families or larger groups.
- Smaller segments like others, hotel/boutique, unique stays (combined 7.4%) offer potential for unique stay experiences.
Holualoa Airbnb Room Capacity Analysis (2026): Bedroom Distribution
Distribution of Listings by Number of Bedrooms
Room Capacity Insights for Holualoa
- The dominant room capacity in Holualoa is 1 bedroom listings, making up 40% of the market. This suggests a strong demand for properties suitable for couples or solo travelers.
- Together, 1 bedroom and 2 bedrooms properties represent 79.1% of the active Airbnb listings in Holualoa, indicating a high concentration in these sizes.
Holualoa Vacation Rental Guest Capacity Trends (2026)
Distribution of Listings by Guest Capacity
Guest Capacity Insights for Holualoa
- The most common guest capacity trend in Holualoa vacation rentals is listings accommodating 4 guests (37.1%). This suggests the primary traveler segment is likely small families or groups.
- Properties designed for 4 guests and 6 guests dominate the Holualoa STR market, accounting for 63.7% of listings.
- 35.3% of properties accommodate 6+ guests, serving the market segment for larger families or group travel in Holualoa.
- On average, properties in Holualoa are equipped to host 4.4 guests.
Holualoa Airbnb Booking Patterns (2026): Available vs. Booked Days
Available Days Distribution
Booked Days Distribution
Booking Pattern Insights for Holualoa
- The most common availability pattern in Holualoa falls within the 271-366 days range, representing 42.8% of listings. This suggests many properties have significant open periods on their calendars.
- Approximately 62.7% of listings show high availability (181+ days open annually), indicating potential for increased bookings or specific owner usage patterns.
- For booked days, the 181-270 days range is most frequent in Holualoa (23.1%), reflecting common guest stay durations or potential owner blocking patterns.
- A notable 37.8% of properties secure long booking periods (181+ days booked per year), highlighting successful long-term rental strategies or significant owner usage.
Holualoa Airbnb Minimum Stay Requirements Analysis
Distribution of Listings by Minimum Night Requirement
1 Night
73 listings
9% of total
2 Nights
109 listings
13.4% of total
3 Nights
95 listings
11.7% of total
4-6 Nights
113 listings
13.9% of total
7-29 Nights
28 listings
3.4% of total
30+ Nights
397 listings
48.7% of total
Key Insights
- The most prevalent minimum stay requirement in Holualoa is 30+ Nights, adopted by 48.7% of listings. This highlights the market's preference for longer commitments.
- A significant segment (48.7%) caters to monthly stays (30+ nights) in Holualoa, pointing to opportunities in the extended-stay market.
Recommendations
- Align with the market by considering a 30+ Nights minimum stay, as 48.7% of Holualoa hosts use this setting.
- If feasible, allowing 1-night stays, especially midweek or during low season, could capture last-minute bookings, as only 9% currently do.
- Explore offering discounts for stays of 30+ nights to attract the 48.7% of the market seeking extended stays.
- Adjust minimum nights based on seasonality – potentially shorter during low season and longer during peak demand periods in Holualoa.
Holualoa Airbnb Cancellation Policy Trends Analysis (2026)
Super Strict 30 Days
38 listings
4.7% of total
Limited
26 listings
3.2% of total
Super Strict 60 Days
134 listings
16.5% of total
Flexible
31 listings
3.8% of total
Moderate
107 listings
13.2% of total
Firm
298 listings
36.7% of total
Strict
179 listings
22% of total
Cancellation Policy Insights for Holualoa
- The prevailing Airbnb cancellation policy trend in Holualoa is Firm, used by 36.7% of listings.
- A majority (58.7%) of hosts in Holualoa utilize Firm or Strict policies, indicating a market where hosts prioritize booking security.
Recommendations for Hosts
- Consider adopting a Firm policy to align with the 36.7% market standard in Holualoa.
- Regularly review your cancellation policy against competitors and market demand shifts in Holualoa.
Holualoa STR Booking Lead Time Analysis (2026)
Average Booking Lead Time by Month
Booking Lead Time Insights for Holualoa
- The overall average booking lead time for vacation rentals in Holualoa is 78 days.
- Guests book furthest in advance for stays during January (average 112 days), likely coinciding with peak travel demand or local events.
- The shortest booking windows occur for stays in August (average 66 days), indicating more last-minute travel plans during this time.
- Seasonally, Winter (99 days avg.) sees the longest lead times, while Summer (72 days avg.) has the shortest, reflecting typical travel planning cycles.
Recommendations for Hosts
- Use the overall average lead time (78 days) as a baseline for your pricing and availability strategy in Holualoa.
- For January stays, consider implementing length-of-stay discounts or slightly higher rates for bookings made less than 112 days out to capitalize on advance planning.
- Target marketing efforts for the Winter season well in advance (at least 99 days) to capture early planners.
- Monitor your own booking lead times against these Holualoa averages to identify opportunities for dynamic pricing adjustments.
Popular & Essential Airbnb Amenities in Holualoa (2026)
Amenity Prevalence
Amenity Insights for Holualoa
- Essential amenities in Holualoa that guests expect include: Wifi, Smoke alarm, TV, Hair dryer. Lacking these (any) could significantly impact bookings.
- Popular amenities like Kitchen, Free parking on premises, Washer are common but not universal. Offering these can provide a competitive edge.
Recommendations for Hosts
- Ensure your listing includes all essential amenities for Holualoa: Wifi, Smoke alarm, TV, Hair dryer.
- Prioritize adding missing essentials: Wifi, Smoke alarm, TV, Hair dryer.
- Consider adding popular differentiators like Kitchen or Free parking on premises to increase appeal.
- Highlight unique or less common amenities you offer (e.g., hot tub, dedicated workspace, EV charger) in your listing description and photos.
- Regularly check competitor amenities in Holualoa to stay competitive.
Holualoa Airbnb Guest Demographics & Profile Analysis (2026)
Guest Profile Summary for Holualoa
- The typical guest profile for Airbnb in Holualoa consists of primarily domestic travelers (87%), often arriving from nearby Seattle, typically belonging to the Post-2000s (Gen Z/Alpha) group (50%), primarily speaking English or Spanish.
- Domestic travelers account for 86.6% of guests.
- Key international markets include United States (86.6%) and Canada (4.7%).
- Top languages spoken are English (64.3%) followed by Spanish (10%).
- A significant demographic segment is the Post-2000s (Gen Z/Alpha) group, representing 50% of guests.
Recommendations for Hosts
- Target domestic marketing efforts towards travelers from Seattle and Los Angeles.
- Tailor amenities and listing descriptions to appeal to the dominant Post-2000s (Gen Z/Alpha) demographic (e.g., highlight fast WiFi, smart home features, local guides).
- Highlight unique local experiences or amenities relevant to the primary guest profile.
- Consider seasonal promotions aligned with peak travel times for key origin markets.
Nearby Short-Term Rental Market Comparison
How does the Holualoa Airbnb market stack up against its neighbors? Compare key performance metrics like average monthly revenue, ADR, and occupancy rates in surrounding areas to understand the broader regional STR landscape.
| Market | Active Properties | Monthly Revenue | Daily Rate | Avg. Occupancy |
|---|---|---|---|---|
| Kula | 11 | $9,130 | $383.13 | 79% |
| Waimea | 416 | $8,098 | $819.38 | 43% |
| Puakō | 62 | $7,820 | $874.88 | 44% |
| Hana | 68 | $7,791 | $413.38 | 65% |
| Makawao | 19 | $7,315 | $437.12 | 67% |
| Kapalua | 297 | $7,140 | $741.15 | 42% |
| Honalo | 24 | $7,044 | $410.83 | 56% |
| Paia | 88 | $6,942 | $546.66 | 49% |
| Wailea-Makena | 11 | $6,581 | $787.33 | 46% |
| Waikoloa Beach Resort | 27 | $6,060 | $544.82 | 46% |