Honokaa Airbnb Market Analysis 2026: Short Term Rental Data & Vacation Rental Statistics in Hawaii, United States
Is Airbnb profitable in Honokaa in 2026? Explore comprehensive Airbnb analytics for Honokaa, Hawaii, United States to uncover income potential. This 2026 STR market report for Honokaa, based on AirROI data from February 2025 to January 2026, reveals key trends in the niche market of 28 active listings.
Whether you're considering an Airbnb investment in Honokaa, optimizing your existing vacation rental, or exploring rental arbitrage opportunities, understanding the Honokaa Airbnb data is crucial. Navigating the high regulation landscape is key to maximizing your short term rental income potential. Let's dive into the specifics.
Key Honokaa Airbnb Performance Metrics Overview
Monthly Airbnb Revenue Variations & Income Potential in Honokaa (2026)
Understanding the monthly revenue variations for Airbnb listings in Honokaa is key to maximizing your short term rental income potential. Seasonality significantly impacts earnings. Our analysis, based on data from the past 12 months, shows that the peak revenue month for STRs in Honokaa is typically December, while August often presents the lowest earnings, highlighting opportunities for strategic pricing adjustments during shoulder and low seasons. Explore the typical Airbnb income in Honokaa across different performance tiers:
- Best-in-class properties (Top 10%) achieve $6,577+ monthly, often utilizing dynamic pricing and superior guest experiences.
- Strong performing properties (Top 25%) earn $3,573 or more, indicating effective management and desirable locations/amenities.
- Typical properties (Median) generate around $1,989 per month, representing the average market performance.
- Entry-level properties (Bottom 25%) see earnings around $1,010, often with potential for optimization.
Average Monthly Airbnb Earnings Trend in Honokaa
Honokaa Airbnb Occupancy Rate Trends (2026)
Maximize your bookings by understanding the Honokaa STR occupancy trends. Seasonal demand shifts significantly influence how often properties are booked. Typically, Februarysees the highest demand (peak season occupancy), while August experiences the lowest (low season). Effective strategies, like adjusting minimum stays or offering promotions, can boost occupancy during slower periods. Here's how different property tiers perform in Honokaa:
- Best-in-class properties (Top 10%) achieve 77%+ occupancy, indicating high desirability and potentially optimized availability.
- Strong performing properties (Top 25%) maintain 65% or higher occupancy, suggesting good market fit and guest satisfaction.
- Typical properties (Median) have an occupancy rate around 44%.
- Entry-level properties (Bottom 25%) average 28% occupancy, potentially facing higher vacancy.
Average Monthly Occupancy Rate Trend in Honokaa
Average Daily Rate (ADR) Airbnb Trends in Honokaa (2026)
Effective short term rental pricing strategy in Honokaa involves understanding monthly ADR fluctuations. The Average Daily Rate (ADR) for Airbnb in Honokaa typically peaks in December and dips lowest during March. Leveraging Airbnb dynamic pricing tools or strategies based on this seasonality can significantly boost revenue. Here's a look at the typical nightly rates achieved:
- Best-in-class properties (Top 10%) command rates of $361+ per night, often due to premium features or locations.
- Strong performing properties (Top 25%) achieve nightly rates of $220 or more.
- Typical properties (Median) charge around $134 per night.
- Entry-level properties (Bottom 25%) earn around $109 per night.
Average Daily Rate (ADR) Trend by Month in Honokaa
Get Live Honokaa Market Intelligence 👇

Explore Real-time Analytics
Airbnb Seasonality Analysis & Trends in Honokaa (2026)
Peak Season (December, October, February)
- Revenue averages $3,548 per month
- Occupancy rates average 56.1%
- Daily rates average $197
Shoulder Season
- Revenue averages $2,765 per month
- Occupancy maintains around 45.8%
- Daily rates hold near $194
Low Season (May, July, August)
- Revenue drops to average $2,262 per month
- Occupancy decreases to average 41.3%
- Daily rates adjust to average $191
Seasonality Insights for Honokaa
- The Airbnb seasonality in Honokaa shows moderate seasonality with distinct peak and low periods. While the sections above show seasonal averages, it's also insightful to look at the extremes:
- During the high season, the absolute peak month showcases Honokaa's highest earning potential, with monthly revenues capable of climbing to $4,037, occupancy reaching a high of 64.3%, and ADRs peaking at $212.
- Conversely, the slowest single month of the year, typically falling within the low season, marks the market's lowest point. In this month, revenue might dip to $2,121, occupancy could drop to 36.3%, and ADRs may adjust down to $182.
- Understanding both the seasonal averages and these monthly peaks and troughs in revenue, occupancy, and ADR is crucial for maximizing your Airbnb profit potential in Honokaa.
Seasonal Strategies for Maximizing Profit
- Peak Season: Maximize revenue through premium pricing and potentially longer minimum stays. Ensure high availability.
- Low Season: Offer competitive pricing, special promotions (e.g., extended stay discounts), and flexible cancellation policies. Target off-season travelers like remote workers or budget-conscious guests.
- Shoulder Seasons: Implement dynamic pricing that balances peak and low rates. Target weekend travelers or specific events. Offer slightly more flexible terms than peak season.
- Regularly analyze your own performance against these Honokaa seasonality benchmarks and adjust your pricing and availability strategy accordingly.
Best Areas for Airbnb Investment in Honokaa (2026)
Exploring the top neighborhoods for short-term rentals in Honokaa? This section highlights key areas, outlining why they are attractive for hosts and guests, along with notable local attractions. Consider these locations based on your target guest profile and investment strategy.
| Neighborhood / Area | Why Host Here? (Target Guests & Appeal) | Key Attractions & Landmarks |
|---|---|---|
| Waipiʻo Valley | Known for its stunning natural beauty, Waipiʻo Valley attracts visitors for hiking, photography, and cultural experiences. A perfect spot for tourists wanting to connect with nature and Hawaiian history. | Waipiʻo Valley Lookout, Hiking trails, Black sand beach, Waterfalls, Cultural tours |
| Hamakua Coast | The scenic Hamakua Coast is known for its breathtaking views and lush landscapes. It's ideal for travelers looking for a peaceful retreat surrounded by natural beauty. | Akaka Falls State Park, Hamakua Heritage Center, Botanical Gardens, Scenic drives, Farmers markets |
| Honokaa Town | A charming small town with a rich history, hosting local shops and restaurants. Perfect for visitors wanting an authentic Hawaiian experience away from the tourist crowds. | Honokaa Theater, Local art galleries, Restaurants, Shopping, Cultural festivals |
| Waimea | A rural town known for its cowboy culture and access to beautiful parks. It's a hub for travelers visiting the famous Parker Ranch and nearby attractions. | Parker Ranch, Waimea Nature Park, Pololu Valley, Hiking trails, Local markets |
| Kohala Coast | This area features stunning beaches and luxury resorts, appealing to upscale tourists and those wanting a relaxing beach vacation. | Mauna Kea Beach, Hapuna Beach State Park, Resorts, Golf courses, Snorkeling spots |
| Puako | A quiet beach town known for its snorkeling and beautiful sunsets. Great for families and couples looking for a peaceful getaway by the water. | Puako Beach, Snorkeling spots, Scenic views, Turtle watching, Local dining |
| Pololu Valley | Famous for its dramatic cliffs and sweeping vistas, Pololu Valley attracts nature lovers and hikers looking for adventure and beauty. | Pololu Valley Lookout, Hiking trails, Beach access, Photography, Wildlife watching |
| Mauna Kea | Home to the world's largest observatory, Mauna Kea offers unique experiences for stargazers and nature enthusiasts. Visitors are drawn to its high elevation and stunning landscapes. | Mauna Kea Observatory, Stargazing, Hiking trails, Cultural experiences, Visitor center |
Understanding Airbnb License Requirements & STR Laws in Honokaa (2026)
Yes, Honokaa, Hawaii, United States enforces high STR regulations. Obtaining a license and ensuring compliance is almost certainly required according to current 2026 STR laws. Always verify the latest short term rental regulations and Airbnb license requirements directly with local government authorities for Honokaa to ensure full compliance before hosting.
(Source: AirROI data, 2026, based on 71% licensed listings)
Top Performing Airbnb Properties in Honokaa (2026)
Benchmark your potential! Explore examples of top-performing Airbnb properties in Honokaabased on Trailing Twelve Month (TTM) revenue. Analyze their characteristics, revenue, occupancy rate, and ADR to understand what drives success in this market.
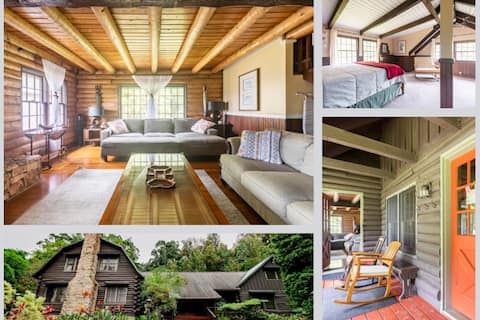
Serene log cabin retreat near Waipi'o Valley
Entire Place • 5 bedrooms
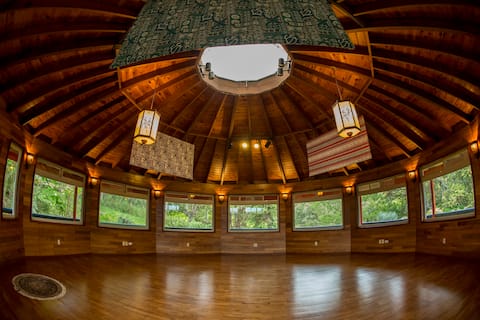
Ahu Lani Retreat Center
Entire Place • 10 bedrooms

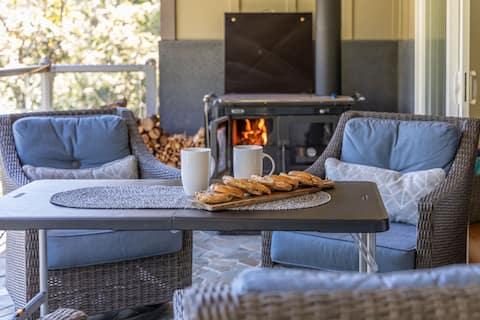
Rainforest Retreat
Entire Place • 3 bedrooms
Entire House+Ohana+7 Private acres+Spa
Entire Place • 4 bedrooms
Secluded log cabin retreat near Waipi'o Valley
Entire Place • 2 bedrooms

Luana Ola Villa Fantastic Ocean View
Entire Place • 1 bedroom
Note: Performance varies based on location, size, amenities, seasonality, and management quality. Data reflects the past 12 months.
Top Performing Airbnb Hosts in Honokaa (2026)
Learn from the best! This table showcases top-performing Airbnb hosts in Honokaa based on the number of properties managed and estimated total revenue over the past year. Analyze their scale and performance metrics.
| Host Name | Properties | Grossing Revenue | Stay Reviews | Avg Rating |
|---|---|---|---|---|
| Fatima | 2 | $156,505 | 168 | 4.97/5.0 |
| Patricia | 4 | $127,937 | 962 | 4.79/5.0 |
| Mai | 9 | $107,595 | 2099 | 4.66/5.0 |
| Kaia | 1 | $100,648 | 38 | 4.89/5.0 |
| Tanya Pekun | 3 | $100,002 | 34 | 4.96/5.0 |
| Ryan | 3 | $72,205 | 284 | 4.95/5.0 |
| Julia | 1 | $68,840 | 84 | 4.94/5.0 |
| Dale | 1 | $31,016 | 23 | 4.96/5.0 |
| Joshua | 1 | $20,192 | 400 | 4.77/5.0 |
| Bridget | 1 | $18,530 | 549 | 4.89/5.0 |
Analyzing the strategies of top hosts, such as their property selection, pricing, and guest communication, can offer valuable lessons for optimizing your own Airbnb operations in Honokaa.
Dive Deeper: Advanced Honokaa STR Market Data (2026)
Ready to unlock more insights? AirROI provides access to advanced metrics and comprehensive Airbnb data for Honokaa. Explore detailed analytics beyond this report to refine your investment strategy, optimize pricing, and maximize your vacation rental profits.
Explore Advanced MetricsHonokaa Short-Term Rental Market Composition (2026): Property & Room Types
Room Type Distribution
Property Type Distribution
Market Composition Insights for Honokaa
- The Honokaa Airbnb market composition is heavily skewed towards Entire Home/Apt listings, which make up 71.4% of the 28 active rentals. This indicates strong guest preference for privacy and space.
- Looking at the property type distribution in Honokaa, House properties are the most common (64.3%), reflecting the local real estate landscape.
- Houses represent a significant 64.3% portion, catering likely to families or larger groups.
- The presence of 10.7% Hotel/Boutique listings indicates integration with traditional hospitality.
- Smaller segments like others (combined 3.6%) offer potential for unique stay experiences.
Honokaa Airbnb Room Capacity Analysis (2026): Bedroom Distribution
Distribution of Listings by Number of Bedrooms
Room Capacity Insights for Honokaa
- The dominant room capacity in Honokaa is 1 bedroom listings, making up 25% of the market. This suggests a strong demand for properties suitable for couples or solo travelers.
- Together, 1 bedroom and 2 bedrooms properties represent 39.3% of the active Airbnb listings in Honokaa, indicating a high concentration in these sizes.
Honokaa Vacation Rental Guest Capacity Trends (2026)
Distribution of Listings by Guest Capacity
Guest Capacity Insights for Honokaa
- The most common guest capacity trend in Honokaa vacation rentals is listings accommodating 2 guests (32.1%). This suggests the primary traveler segment is likely couples or solo travelers.
- Properties designed for 2 guests and 8+ guests dominate the Honokaa STR market, accounting for 46.4% of listings.
- 25.0% of properties accommodate 6+ guests, serving the market segment for larger families or group travel in Honokaa.
- On average, properties in Honokaa are equipped to host 3.4 guests.
Honokaa Airbnb Booking Patterns (2026): Available vs. Booked Days
Available Days Distribution
Booked Days Distribution
Booking Pattern Insights for Honokaa
- The most common availability pattern in Honokaa falls within the 181-270 days range, representing 42.9% of listings. This suggests many properties have significant open periods on their calendars.
- Approximately 64.3% of listings show high availability (181+ days open annually), indicating potential for increased bookings or specific owner usage patterns.
- For booked days, the 91-180 days range is most frequent in Honokaa (42.9%), reflecting common guest stay durations or potential owner blocking patterns.
- A notable 35.7% of properties secure long booking periods (181+ days booked per year), highlighting successful long-term rental strategies or significant owner usage.
Honokaa Airbnb Minimum Stay Requirements Analysis
Distribution of Listings by Minimum Night Requirement
1 Night
8 listings
28.6% of total
2 Nights
8 listings
28.6% of total
3 Nights
5 listings
17.9% of total
30+ Nights
7 listings
25% of total
Key Insights
- The most prevalent minimum stay requirement in Honokaa is 1 Night, adopted by 28.6% of listings. This highlights the market's preference for shorter, flexible bookings.
- A significant segment (25%) caters to monthly stays (30+ nights) in Honokaa, pointing to opportunities in the extended-stay market.
Recommendations
- Align with the market by considering a 1 Night minimum stay, as 28.6% of Honokaa hosts use this setting.
- If feasible, allowing 1-night stays, especially midweek or during low season, could capture last-minute bookings, as only 28.6% currently do.
- Explore offering discounts for stays of 30+ nights to attract the 25% of the market seeking extended stays.
- Adjust minimum nights based on seasonality – potentially shorter during low season and longer during peak demand periods in Honokaa.
Honokaa Airbnb Cancellation Policy Trends Analysis (2026)
Limited
1 listings
3.6% of total
Flexible
8 listings
28.6% of total
Moderate
11 listings
39.3% of total
Firm
5 listings
17.9% of total
Strict
3 listings
10.7% of total
Cancellation Policy Insights for Honokaa
- The prevailing Airbnb cancellation policy trend in Honokaa is Moderate, used by 39.3% of listings.
- There's a relatively balanced mix between guest-friendly (67.9%) and stricter (28.6%) policies, offering choices for different guest needs.
Recommendations for Hosts
- Consider adopting a Moderate policy to align with the 39.3% market standard in Honokaa.
- Using a Strict policy might deter some guests, as only 10.7% of listings use it. Evaluate if potential revenue protection outweighs possible lower booking rates.
- Regularly review your cancellation policy against competitors and market demand shifts in Honokaa.
Honokaa STR Booking Lead Time Analysis (2026)
Average Booking Lead Time by Month
Booking Lead Time Insights for Honokaa
- The overall average booking lead time for vacation rentals in Honokaa is 54 days.
- Guests book furthest in advance for stays during April (average 67 days), likely coinciding with peak travel demand or local events.
- The shortest booking windows occur for stays in May (average 39 days), indicating more last-minute travel plans during this time.
- Seasonally, Winter (63 days avg.) sees the longest lead times, while Fall (50 days avg.) has the shortest, reflecting typical travel planning cycles.
Recommendations for Hosts
- Use the overall average lead time (54 days) as a baseline for your pricing and availability strategy in Honokaa.
- For April stays, consider implementing length-of-stay discounts or slightly higher rates for bookings made less than 67 days out to capitalize on advance planning.
- Target marketing efforts for the Winter season well in advance (at least 63 days) to capture early planners.
- Monitor your own booking lead times against these Honokaa averages to identify opportunities for dynamic pricing adjustments.
Popular & Essential Airbnb Amenities in Honokaa (2026)
Amenity Prevalence
Amenity Insights for Honokaa
- Essential amenities in Honokaa that guests expect include: Hot water, Wifi, Coffee maker, Dishes and silverware, Free parking on premises, Essentials, Shampoo, Cooking basics. Lacking these (any) could significantly impact bookings.
- Popular amenities like Backyard, Smoke alarm are common but not universal. Offering these can provide a competitive edge.
Recommendations for Hosts
- Ensure your listing includes all essential amenities for Honokaa: Hot water, Wifi, Coffee maker, Dishes and silverware, Free parking on premises, Essentials, Shampoo, Cooking basics.
- Prioritize adding missing essentials: Essentials, Shampoo, Cooking basics.
- Consider adding popular differentiators like Backyard or Smoke alarm to increase appeal.
- Highlight unique or less common amenities you offer (e.g., hot tub, dedicated workspace, EV charger) in your listing description and photos.
- Regularly check competitor amenities in Honokaa to stay competitive.
Honokaa Airbnb Guest Demographics & Profile Analysis (2026)
Guest Profile Summary for Honokaa
- The typical guest profile for Airbnb in Honokaa consists of primarily domestic travelers (87%), often arriving from nearby Honolulu, typically belonging to the Post-2000s (Gen Z/Alpha) group (50%), primarily speaking English or French.
- Domestic travelers account for 87.1% of guests.
- Key international markets include United States (87.1%) and Canada (4.9%).
- Top languages spoken are English (57.8%) followed by French (8.7%).
- A significant demographic segment is the Post-2000s (Gen Z/Alpha) group, representing 50% of guests.
Recommendations for Hosts
- Target domestic marketing efforts towards travelers from Honolulu and Pāhoa.
- Tailor amenities and listing descriptions to appeal to the dominant Post-2000s (Gen Z/Alpha) demographic (e.g., highlight fast WiFi, smart home features, local guides).
- Highlight unique local experiences or amenities relevant to the primary guest profile.
- Consider seasonal promotions aligned with peak travel times for key origin markets.
Nearby Short-Term Rental Market Comparison
How does the Honokaa Airbnb market stack up against its neighbors? Compare key performance metrics like average monthly revenue, ADR, and occupancy rates in surrounding areas to understand the broader regional STR landscape.
| Market | Active Properties | Monthly Revenue | Daily Rate | Avg. Occupancy |
|---|---|---|---|---|
| Kula | 11 | $9,130 | $383.13 | 79% |
| Waimea | 416 | $8,098 | $819.38 | 43% |
| Puakō | 62 | $7,820 | $874.88 | 44% |
| Hana | 68 | $7,791 | $413.38 | 65% |
| Makawao | 19 | $7,315 | $437.12 | 67% |
| Kapalua | 297 | $7,140 | $741.15 | 42% |
| Honalo | 24 | $7,044 | $410.83 | 56% |
| Paia | 88 | $6,942 | $546.66 | 49% |
| Wailea-Makena | 11 | $6,581 | $787.33 | 46% |
| Waikoloa Beach Resort | 27 | $6,060 | $544.82 | 46% |