Kihei Airbnb Market Analysis 2026: Short Term Rental Data & Vacation Rental Statistics in Hawaii, United States
Is Airbnb profitable in Kihei in 2026? Explore comprehensive Airbnb analytics for Kihei, Hawaii, United States to uncover income potential. This 2026 STR market report for Kihei, based on AirROI data from February 2025 to January 2026, reveals key trends in the bustling market of 2,291 active listings.
Whether you're considering an Airbnb investment in Kihei, optimizing your existing vacation rental, or exploring rental arbitrage opportunities, understanding the Kihei Airbnb data is crucial. Navigating the high regulation landscape is key to maximizing your short term rental income potential. Let's dive into the specifics.
Key Kihei Airbnb Performance Metrics Overview
Monthly Airbnb Revenue Variations & Income Potential in Kihei (2026)
Understanding the monthly revenue variations for Airbnb listings in Kihei is key to maximizing your short term rental income potential. Seasonality significantly impacts earnings. Our analysis, based on data from the past 12 months, shows that the peak revenue month for STRs in Kihei is typically February, while September often presents the lowest earnings, highlighting opportunities for strategic pricing adjustments during shoulder and low seasons. Explore the typical Airbnb income in Kihei across different performance tiers:
- Best-in-class properties (Top 10%) achieve $11,234+ monthly, often utilizing dynamic pricing and superior guest experiences.
- Strong performing properties (Top 25%) earn $7,851 or more, indicating effective management and desirable locations/amenities.
- Typical properties (Median) generate around $5,284 per month, representing the average market performance.
- Entry-level properties (Bottom 25%) see earnings around $2,929, often with potential for optimization.
Average Monthly Airbnb Earnings Trend in Kihei
Kihei Airbnb Occupancy Rate Trends (2026)
Maximize your bookings by understanding the Kihei STR occupancy trends. Seasonal demand shifts significantly influence how often properties are booked. Typically, Februarysees the highest demand (peak season occupancy), while January experiences the lowest (low season). Effective strategies, like adjusting minimum stays or offering promotions, can boost occupancy during slower periods. Here's how different property tiers perform in Kihei:
- Best-in-class properties (Top 10%) achieve 89%+ occupancy, indicating high desirability and potentially optimized availability.
- Strong performing properties (Top 25%) maintain 80% or higher occupancy, suggesting good market fit and guest satisfaction.
- Typical properties (Median) have an occupancy rate around 59%.
- Entry-level properties (Bottom 25%) average 31% occupancy, potentially facing higher vacancy.
Average Monthly Occupancy Rate Trend in Kihei
Average Daily Rate (ADR) Airbnb Trends in Kihei (2026)
Effective short term rental pricing strategy in Kihei involves understanding monthly ADR fluctuations. The Average Daily Rate (ADR) for Airbnb in Kihei typically peaks in January and dips lowest during May. Leveraging Airbnb dynamic pricing tools or strategies based on this seasonality can significantly boost revenue. Here's a look at the typical nightly rates achieved:
- Best-in-class properties (Top 10%) command rates of $548+ per night, often due to premium features or locations.
- Strong performing properties (Top 25%) achieve nightly rates of $407 or more.
- Typical properties (Median) charge around $312 per night.
- Entry-level properties (Bottom 25%) earn around $251 per night.
Average Daily Rate (ADR) Trend by Month in Kihei
Get Live Kihei Market Intelligence 👇

Explore Real-time Analytics
Airbnb Seasonality Analysis & Trends in Kihei (2026)
Peak Season (February, March, December)
- Revenue averages $7,552 per month
- Occupancy rates average 63.4%
- Daily rates average $395
Shoulder Season
- Revenue averages $5,932 per month
- Occupancy maintains around 52.8%
- Daily rates hold near $373
Low Season (May, June, September)
- Revenue drops to average $5,338 per month
- Occupancy decreases to average 50.8%
- Daily rates adjust to average $347
Seasonality Insights for Kihei
- The Airbnb seasonality in Kihei shows moderate seasonality with distinct peak and low periods. While the sections above show seasonal averages, it's also insightful to look at the extremes:
- During the high season, the absolute peak month showcases Kihei's highest earning potential, with monthly revenues capable of climbing to $8,087, occupancy reaching a high of 72.4%, and ADRs peaking at $436.
- Conversely, the slowest single month of the year, typically falling within the low season, marks the market's lowest point. In this month, revenue might dip to $5,123, occupancy could drop to 45.5%, and ADRs may adjust down to $342.
- Understanding both the seasonal averages and these monthly peaks and troughs in revenue, occupancy, and ADR is crucial for maximizing your Airbnb profit potential in Kihei.
Seasonal Strategies for Maximizing Profit
- Peak Season: Maximize revenue through premium pricing and potentially longer minimum stays. Ensure high availability.
- Low Season: Offer competitive pricing, special promotions (e.g., extended stay discounts), and flexible cancellation policies. Target off-season travelers like remote workers or budget-conscious guests.
- Shoulder Seasons: Implement dynamic pricing that balances peak and low rates. Target weekend travelers or specific events. Offer slightly more flexible terms than peak season.
- Regularly analyze your own performance against these Kihei seasonality benchmarks and adjust your pricing and availability strategy accordingly.
Best Areas for Airbnb Investment in Kihei (2026)
Exploring the top neighborhoods for short-term rentals in Kihei? This section highlights key areas, outlining why they are attractive for hosts and guests, along with notable local attractions. Consider these locations based on your target guest profile and investment strategy.
| Neighborhood / Area | Why Host Here? (Target Guests & Appeal) | Key Attractions & Landmarks |
|---|---|---|
| Kamaole Beach Park | Popular beach park known for its golden sands and ideal swimming conditions. A favorite spot for families and vacationers, making it a prime location for Airbnb hosting. | Kamaole Beach Park I, II, III, Keawakapu Beach, Shops at Wailea, Restaurants along South Kihei Road, Snorkeling opportunities, Whale watching during season |
| Wailea | Upscale resort area known for luxury accommodations and world-class beaches. Attracts affluent travelers looking for a high-end vacation experience. | Wailea Beach, Makaiwa Park, The Shops at Wailea, Wailea Golf Club, Surfing and paddleboarding, Luxury spa resorts |
| Maalaea | Quieter area known for its scenic harbor and proximity to marine activities. Ideal for those seeking a more laid-back vacation experience with natural beauty. | Maalaea Harbor, Maui Ocean Center, Sugar Beach, Snorkeling tours, Boat tours and fishing, Molokini Crater excursions |
| North Kihei | More affordable options for families and budget travelers. Close to beaches and local eateries. | Kihei Boat Ramp, Kalepolepo Beach Park, Kihei Aquatic Center, Local shops and restaurants, Beach volleyball courts, Close to Hawaiian Cultural activities |
| South Kihei | Offers a relaxing beach lifestyle with a variety of beachfront properties. Attracts tourists for its beautiful sunsets and water activities. | Charley Young Beach, Keawakapu Beach, Kihei Kalama Village, Food trucks and local restaurants, Snorkeling and swimming, Surfing during the summer months |
| Makena | Known for its stunning beaches and natural scenery, perfect for outdoor enthusiasts and those seeking tranquility. | Big Beach (Makena Beach), Little Beach, Ahihi-Kinau Natural Area Reserve, Hiking trails in the area, Snorkeling off the shores, Scenic views |
| Kihei Town Center | The main commercial hub of Kihei, with a mix of shopping, dining, and entertainment options. Attracts tourists and locals alike. | Azeka Shopping Center, Kihei Central Shopping Plaza, Local restaurants and bars, Nightlife and entertainment, Art galleries, Community events |
| Sugar Beach | A long and quiet stretch of beach, ideal for long walks and enjoying sunsets. Attracts visitors looking for a peaceful beach experience. | Sugar Beach, Maui Ocean Center nearby, Kayaking and paddleboarding, Picnic areas, Views of Molokai Island, Quiet retreat atmosphere |
Understanding Airbnb License Requirements & STR Laws in Kihei (2026)
Yes, Kihei, Hawaii, United States enforces high STR regulations. Obtaining a license and ensuring compliance is almost certainly required according to current 2026 STR laws. Always verify the latest short term rental regulations and Airbnb license requirements directly with local government authorities for Kihei to ensure full compliance before hosting.
(Source: AirROI data, 2026, based on 96% licensed listings)
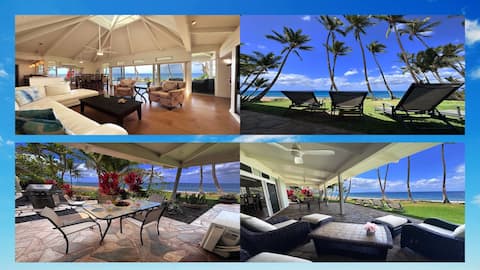
Top Performing Airbnb Properties in Kihei (2026)
Benchmark your potential! Explore examples of top-performing Airbnb properties in Kiheibased on Trailing Twelve Month (TTM) revenue. Analyze their characteristics, revenue, occupancy rate, and ADR to understand what drives success in this market.

Oceanfront Perfection with Outstanding Service
Entire Place • 8 bedrooms
3 Newly Renovated Villas, sleeps up to 20 guests!
Entire Place • 6 bedrooms
Private Kihei Luxury Villa - All 5 star reviews!
Entire Place • 6 bedrooms

Kamaole Beach Villa
Entire Place • 3 bedrooms
LUXURIOUS*DIRECT OCEANFRONT Private HOME
Entire Place • 4 bedrooms

SOUTH BEACH VILLA ON COCONUT BAY
Entire Place • 5 bedrooms
Note: Performance varies based on location, size, amenities, seasonality, and management quality. Data reflects the past 12 months.
Top Performing Airbnb Hosts in Kihei (2026)
Learn from the best! This table showcases top-performing Airbnb hosts in Kihei based on the number of properties managed and estimated total revenue over the past year. Analyze their scale and performance metrics.
| Host Name | Properties | Grossing Revenue | Stay Reviews | Avg Rating |
|---|---|---|---|---|
| Viktoria | 68 | $7,420,801 | 10256 | 4.84/5.0 |
| Gal | 23 | $4,381,680 | 1519 | 4.93/5.0 |
| Coldwell Banker Island Vacatio | 90 | $4,266,802 | 1613 | 4.68/5.0 |
| Daniel | 34 | $2,966,274 | 2340 | 4.70/5.0 |
| Rentals Maui | 106 | $2,926,271 | 670 | 4.76/5.0 |
| Stay Aloha | 27 | $2,304,748 | 894 | 4.87/5.0 |
| Vacation-Maui | 45 | $2,020,225 | 1003 | 4.81/5.0 |
| Maui Paradise Properties | 35 | $1,929,419 | 633 | 4.67/5.0 |
| Aaron | 18 | $1,894,640 | 1327 | 4.96/5.0 |
| VacaMaui | 12 | $1,825,285 | 1058 | 4.75/5.0 |
Analyzing the strategies of top hosts, such as their property selection, pricing, and guest communication, can offer valuable lessons for optimizing your own Airbnb operations in Kihei.
Dive Deeper: Advanced Kihei STR Market Data (2026)
Ready to unlock more insights? AirROI provides access to advanced metrics and comprehensive Airbnb data for Kihei. Explore detailed analytics beyond this report to refine your investment strategy, optimize pricing, and maximize your vacation rental profits.
Explore Advanced MetricsKihei Short-Term Rental Market Composition (2026): Property & Room Types
Room Type Distribution
Property Type Distribution
Market Composition Insights for Kihei
- The Kihei Airbnb market composition is heavily skewed towards Entire Home/Apt listings, which make up 99% of the 2,291 active rentals. This indicates strong guest preference for privacy and space.
- Looking at the property type distribution in Kihei, Apartment/Condo properties are the most common (94.8%), reflecting the local real estate landscape.
- Smaller segments like house, hotel/boutique, others (combined 5.2%) offer potential for unique stay experiences.
Kihei Airbnb Room Capacity Analysis (2026): Bedroom Distribution
Distribution of Listings by Number of Bedrooms
Room Capacity Insights for Kihei
- The dominant room capacity in Kihei is 1 bedroom listings, making up 54.4% of the market. This suggests a strong demand for properties suitable for couples or solo travelers.
- Together, 1 bedroom and 2 bedrooms properties represent 88.6% of the active Airbnb listings in Kihei, indicating a high concentration in these sizes.
- With over half the market (54.4%) consisting of studios or 1-bedroom units, Kihei is particularly well-suited for individuals or couples.
- Listings with 3+ bedrooms (5.7%) represent a smaller niche, potentially indicating an underserved market for larger group accommodations in Kihei.
Kihei Vacation Rental Guest Capacity Trends (2026)
Distribution of Listings by Guest Capacity
Guest Capacity Insights for Kihei
- The most common guest capacity trend in Kihei vacation rentals is listings accommodating 4 guests (47.5%). This suggests the primary traveler segment is likely small families or groups.
- Properties designed for 4 guests and 6 guests dominate the Kihei STR market, accounting for 70.7% of listings.
- 28.7% of properties accommodate 6+ guests, serving the market segment for larger families or group travel in Kihei.
- On average, properties in Kihei are equipped to host 4.4 guests.
Kihei Airbnb Booking Patterns (2026): Available vs. Booked Days
Available Days Distribution
Booked Days Distribution
Booking Pattern Insights for Kihei
- The most common availability pattern in Kihei falls within the 271-366 days range, representing 36.8% of listings. This suggests many properties have significant open periods on their calendars.
- Approximately 60.4% of listings show high availability (181+ days open annually), indicating potential for increased bookings or specific owner usage patterns.
- For booked days, the 91-180 days range is most frequent in Kihei (23.4%), reflecting common guest stay durations or potential owner blocking patterns.
- A notable 40.7% of properties secure long booking periods (181+ days booked per year), highlighting successful long-term rental strategies or significant owner usage.
Kihei Airbnb Minimum Stay Requirements Analysis
Distribution of Listings by Minimum Night Requirement
1 Night
227 listings
9.9% of total
2 Nights
211 listings
9.2% of total
3 Nights
312 listings
13.6% of total
4-6 Nights
386 listings
16.9% of total
7-29 Nights
30 listings
1.3% of total
30+ Nights
1123 listings
49.1% of total
Key Insights
- The most prevalent minimum stay requirement in Kihei is 30+ Nights, adopted by 49.1% of listings. This highlights the market's preference for longer commitments.
- Very short stays (1-2 nights) are less common (19.1%), suggesting hosts prefer slightly longer bookings to optimize turnover.
- A significant segment (49.1%) caters to monthly stays (30+ nights) in Kihei, pointing to opportunities in the extended-stay market.
Recommendations
- Align with the market by considering a 30+ Nights minimum stay, as 49.1% of Kihei hosts use this setting.
- If feasible, allowing 1-night stays, especially midweek or during low season, could capture last-minute bookings, as only 9.9% currently do.
- Explore offering discounts for stays of 30+ nights to attract the 49.1% of the market seeking extended stays.
- Adjust minimum nights based on seasonality – potentially shorter during low season and longer during peak demand periods in Kihei.
Kihei Airbnb Cancellation Policy Trends Analysis (2026)
Super Strict 30 Days
164 listings
7.2% of total
Limited
52 listings
2.3% of total
Super Strict 60 Days
216 listings
9.4% of total
Flexible
41 listings
1.8% of total
Moderate
248 listings
10.8% of total
Firm
1141 listings
49.9% of total
Strict
425 listings
18.6% of total
Cancellation Policy Insights for Kihei
- The prevailing Airbnb cancellation policy trend in Kihei is Firm, used by 49.9% of listings.
- A majority (68.5%) of hosts in Kihei utilize Firm or Strict policies, indicating a market where hosts prioritize booking security.
Recommendations for Hosts
- Consider adopting a Firm policy to align with the 49.9% market standard in Kihei.
- Regularly review your cancellation policy against competitors and market demand shifts in Kihei.
Kihei STR Booking Lead Time Analysis (2026)
Average Booking Lead Time by Month
Booking Lead Time Insights for Kihei
- The overall average booking lead time for vacation rentals in Kihei is 84 days.
- Guests book furthest in advance for stays during February (average 108 days), likely coinciding with peak travel demand or local events.
- The shortest booking windows occur for stays in August (average 69 days), indicating more last-minute travel plans during this time.
- Seasonally, Winter (100 days avg.) sees the longest lead times, while Summer (70 days avg.) has the shortest, reflecting typical travel planning cycles.
Recommendations for Hosts
- Use the overall average lead time (84 days) as a baseline for your pricing and availability strategy in Kihei.
- For February stays, consider implementing length-of-stay discounts or slightly higher rates for bookings made less than 108 days out to capitalize on advance planning.
- Target marketing efforts for the Winter season well in advance (at least 100 days) to capture early planners.
- Monitor your own booking lead times against these Kihei averages to identify opportunities for dynamic pricing adjustments.
Popular & Essential Airbnb Amenities in Kihei (2026)
Amenity Prevalence
Amenity Insights for Kihei
- Essential amenities in Kihei that guests expect include: Wifi, TV, Kitchen, Coffee maker, Smoke alarm, Free parking on premises, Pool, Air conditioning, Refrigerator, Dishes and silverware. Lacking these (any) could significantly impact bookings.
Recommendations for Hosts
- Ensure your listing includes all essential amenities for Kihei: Wifi, TV, Kitchen, Coffee maker, Smoke alarm, Free parking on premises, Pool, Air conditioning, Refrigerator, Dishes and silverware.
- Prioritize adding missing essentials: Wifi, TV, Kitchen, Coffee maker, Smoke alarm, Free parking on premises, Pool, Air conditioning, Refrigerator, Dishes and silverware.
- Highlight unique or less common amenities you offer (e.g., hot tub, dedicated workspace, EV charger) in your listing description and photos.
- Regularly check competitor amenities in Kihei to stay competitive.
Kihei Airbnb Guest Demographics & Profile Analysis (2026)
Guest Profile Summary for Kihei
- The typical guest profile for Airbnb in Kihei consists of primarily domestic travelers (85%), often arriving from nearby Seattle, typically belonging to the Post-2000s (Gen Z/Alpha) group (50%), primarily speaking English or Spanish.
- Domestic travelers account for 85.0% of guests.
- Key international markets include United States (85%) and Canada (8.1%).
- Top languages spoken are English (64.2%) followed by Spanish (11.4%).
- A significant demographic segment is the Post-2000s (Gen Z/Alpha) group, representing 50% of guests.
Recommendations for Hosts
- Target domestic marketing efforts towards travelers from Seattle and Los Angeles.
- Tailor amenities and listing descriptions to appeal to the dominant Post-2000s (Gen Z/Alpha) demographic (e.g., highlight fast WiFi, smart home features, local guides).
- Highlight unique local experiences or amenities relevant to the primary guest profile.
- Consider seasonal promotions aligned with peak travel times for key origin markets.
Nearby Short-Term Rental Market Comparison
How does the Kihei Airbnb market stack up against its neighbors? Compare key performance metrics like average monthly revenue, ADR, and occupancy rates in surrounding areas to understand the broader regional STR landscape.
| Market | Active Properties | Monthly Revenue | Daily Rate | Avg. Occupancy |
|---|---|---|---|---|
| Kahuku | 287 | $11,358 | $679.39 | 64% |
| Kula | 11 | $9,130 | $383.13 | 79% |
| Waimea | 416 | $8,098 | $819.38 | 43% |
| Puakō | 62 | $7,820 | $874.88 | 44% |
| Hana | 68 | $7,791 | $413.38 | 65% |
| Makawao | 19 | $7,315 | $437.12 | 67% |
| Kapalua | 297 | $7,140 | $741.15 | 42% |
| Honalo | 24 | $7,044 | $410.83 | 56% |
| Paia | 88 | $6,942 | $546.66 | 49% |
| Wailea-Makena | 11 | $6,581 | $787.33 | 46% |