Lihue Airbnb Market Analysis 2026: Short Term Rental Data & Vacation Rental Statistics in Hawaii, United States
Is Airbnb profitable in Lihue in 2026? Explore comprehensive Airbnb analytics for Lihue, Hawaii, United States to uncover income potential. This 2026 STR market report for Lihue, based on AirROI data from February 2025 to January 2026, reveals key trends in the market of 329 active listings.
Whether you're considering an Airbnb investment in Lihue, optimizing your existing vacation rental, or exploring rental arbitrage opportunities, understanding the Lihue Airbnb data is crucial. Navigating the high regulation landscape is key to maximizing your short term rental income potential. Let's dive into the specifics.
Key Lihue Airbnb Performance Metrics Overview
Monthly Airbnb Revenue Variations & Income Potential in Lihue (2026)
Understanding the monthly revenue variations for Airbnb listings in Lihue is key to maximizing your short term rental income potential. Seasonality significantly impacts earnings. Our analysis, based on data from the past 12 months, shows that the peak revenue month for STRs in Lihue is typically October, while April often presents the lowest earnings, highlighting opportunities for strategic pricing adjustments during shoulder and low seasons. Explore the typical Airbnb income in Lihue across different performance tiers:
- Best-in-class properties (Top 10%) achieve $10,066+ monthly, often utilizing dynamic pricing and superior guest experiences.
- Strong performing properties (Top 25%) earn $7,304 or more, indicating effective management and desirable locations/amenities.
- Typical properties (Median) generate around $4,514 per month, representing the average market performance.
- Entry-level properties (Bottom 25%) see earnings around $2,203, often with potential for optimization.
Average Monthly Airbnb Earnings Trend in Lihue
Lihue Airbnb Occupancy Rate Trends (2026)
Maximize your bookings by understanding the Lihue STR occupancy trends. Seasonal demand shifts significantly influence how often properties are booked. Typically, Februarysees the highest demand (peak season occupancy), while December experiences the lowest (low season). Effective strategies, like adjusting minimum stays or offering promotions, can boost occupancy during slower periods. Here's how different property tiers perform in Lihue:
- Best-in-class properties (Top 10%) achieve 86%+ occupancy, indicating high desirability and potentially optimized availability.
- Strong performing properties (Top 25%) maintain 74% or higher occupancy, suggesting good market fit and guest satisfaction.
- Typical properties (Median) have an occupancy rate around 46%.
- Entry-level properties (Bottom 25%) average 22% occupancy, potentially facing higher vacancy.
Average Monthly Occupancy Rate Trend in Lihue
Average Daily Rate (ADR) Airbnb Trends in Lihue (2026)
Effective short term rental pricing strategy in Lihue involves understanding monthly ADR fluctuations. The Average Daily Rate (ADR) for Airbnb in Lihue typically peaks in December and dips lowest during April. Leveraging Airbnb dynamic pricing tools or strategies based on this seasonality can significantly boost revenue. Here's a look at the typical nightly rates achieved:
- Best-in-class properties (Top 10%) command rates of $589+ per night, often due to premium features or locations.
- Strong performing properties (Top 25%) achieve nightly rates of $421 or more.
- Typical properties (Median) charge around $323 per night.
- Entry-level properties (Bottom 25%) earn around $253 per night.
Average Daily Rate (ADR) Trend by Month in Lihue
Get Live Lihue Market Intelligence 👇

Explore Real-time Analytics
Airbnb Seasonality Analysis & Trends in Lihue (2026)
Peak Season (October, January, February)
- Revenue averages $6,605 per month
- Occupancy rates average 51.9%
- Daily rates average $411
Shoulder Season
- Revenue averages $5,534 per month
- Occupancy maintains around 46.9%
- Daily rates hold near $395
Low Season (April, May, June)
- Revenue drops to average $4,938 per month
- Occupancy decreases to average 46.6%
- Daily rates adjust to average $370
Seasonality Insights for Lihue
- The Airbnb seasonality in Lihue shows moderate seasonality with distinct peak and low periods. While the sections above show seasonal averages, it's also insightful to look at the extremes:
- During the high season, the absolute peak month showcases Lihue's highest earning potential, with monthly revenues capable of climbing to $7,282, occupancy reaching a high of 61.0%, and ADRs peaking at $443.
- Conversely, the slowest single month of the year, typically falling within the low season, marks the market's lowest point. In this month, revenue might dip to $4,743, occupancy could drop to 37.3%, and ADRs may adjust down to $359.
- Understanding both the seasonal averages and these monthly peaks and troughs in revenue, occupancy, and ADR is crucial for maximizing your Airbnb profit potential in Lihue.
Seasonal Strategies for Maximizing Profit
- Peak Season: Maximize revenue through premium pricing and potentially longer minimum stays. Ensure high availability.
- Low Season: Offer competitive pricing, special promotions (e.g., extended stay discounts), and flexible cancellation policies. Target off-season travelers like remote workers or budget-conscious guests.
- Shoulder Seasons: Implement dynamic pricing that balances peak and low rates. Target weekend travelers or specific events. Offer slightly more flexible terms than peak season.
- Regularly analyze your own performance against these Lihue seasonality benchmarks and adjust your pricing and availability strategy accordingly.
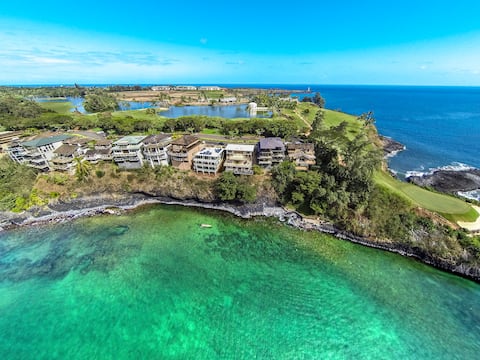
Best Areas for Airbnb Investment in Lihue (2026)
Exploring the top neighborhoods for short-term rentals in Lihue? This section highlights key areas, outlining why they are attractive for hosts and guests, along with notable local attractions. Consider these locations based on your target guest profile and investment strategy.
| Neighborhood / Area | Why Host Here? (Target Guests & Appeal) | Key Attractions & Landmarks |
|---|---|---|
| Kalapaki Beach | Stunning beach known for its calm waters, ideal for families and those looking to relax or engage in water activities. Close to hotels, dining, and shopping options, making it a favored spot for tourists. | Kalapaki Beach, Nawiliwili Harbor, Kukui Grove Center, Coconut Marketplace, Lihue Lighthouse |
| Lihue Town Center | The main commercial hub of Kauai with a mix of local shops, eateries, and historical sites. Offers a unique look into local culture and is conveniently located for visitors. | Kauai Museum, Lihue Town Park, Vidinha Stadium, Cook Island, Local restaurants and cafes |
| Nawiliwili Harbor | A working harbor that's picturesque and offers cruises and water activities. Attractive to travelers arriving by cruise ships and looking for adventures on the water. | Nawiliwili Harbor, Wailua Falls, Pedal Kayak Tours, Boat excursions |
| Puhi | A developing area close to industrial and business sectors, ideal for longer-term stays for those in business or working at local companies, with access to local dining. | Puhi Sand Dunes, Local shops and eating establishments, Garden Isle Bicycles |
| Hanamaulu | A quaint community with scenic views of the coastline, known for its beautiful beaches and local charm. Great for travelers seeking authentic local experiences. | Hanamaulu Beach Park, Kealia Beach, Local fish shacks |
| Hanalei | A little more distant from Lihue, but a stunning bay area known for its lush scenery and magical sunset views. Attractive to nature lovers and outdoor enthusiasts. | Hanalei National Wildlife Refuge, Hanalei Bay, Na Pali Coast Hiking |
| Kapa'a | A vibrant town with a lively arts scene and tourism-friendly atmosphere. Offers beautiful beaches, shopping, and dining options, great for visitors and retreats. | Kapaʻa Beach Park, Kealia Beach, Local markets and shops |
| Wailua | Renowned for its beautiful waterfalls and lush landscapes, Wailua attracts those wanting to explore Kauai's nature and culture. Great for adventure seekers and families. | Wailua Falls, Secret Falls, Wailua River Kayaking, Local luaus |
Understanding Airbnb License Requirements & STR Laws in Lihue (2026)
Yes, Lihue, Hawaii, United States enforces high STR regulations. Obtaining a license and ensuring compliance is almost certainly required according to current 2026 STR laws. Always verify the latest short term rental regulations and Airbnb license requirements directly with local government authorities for Lihue to ensure full compliance before hosting.
(Source: AirROI data, 2026, based on 92% licensed listings)
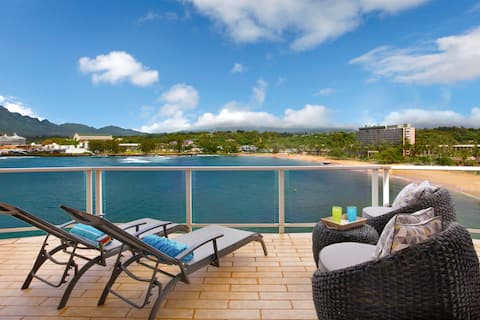
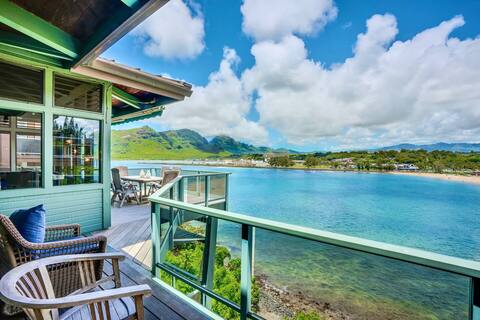
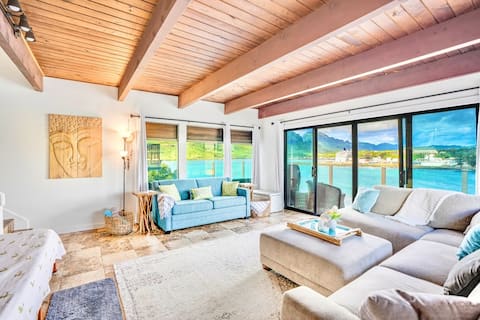
Top Performing Airbnb Properties in Lihue (2026)
Benchmark your potential! Explore examples of top-performing Airbnb properties in Lihuebased on Trailing Twelve Month (TTM) revenue. Analyze their characteristics, revenue, occupancy rate, and ADR to understand what drives success in this market.
Kalapaki Cliffside Penthouse
Entire Place • 5 bedrooms
Spectacular Oceanfront Getaway at Kalapaki Beach
Entire Place • 3 bedrooms
Private Cliffside Ohana Retreat at Kalapaki Beach!
Entire Place • 4 bedrooms

OCEAN VIEW Marriott Kauai Beach Club Parlor Suite
Entire Place • 1 bedroom

OCEAN FRONT Marriott Kauai Beach Club Parlor Suite
Entire Place • 1 bedroom
4 bedrooms & 2 sleepers @ Kalapaki Bay Oceanfront
Entire Place • 4 bedrooms
Note: Performance varies based on location, size, amenities, seasonality, and management quality. Data reflects the past 12 months.
Top Performing Airbnb Hosts in Lihue (2026)
Learn from the best! This table showcases top-performing Airbnb hosts in Lihue based on the number of properties managed and estimated total revenue over the past year. Analyze their scale and performance metrics.
| Host Name | Properties | Grossing Revenue | Stay Reviews | Avg Rating |
|---|---|---|---|---|
| Kelsi | 7 | $1,345,646 | 127 | 4.84/5.0 |
| Kanani | 15 | $1,094,398 | 382 | 4.76/5.0 |
| Susanne | 7 | $792,236 | 429 | 4.75/5.0 |
| Extra Holidays® | 12 | $641,894 | 268 | 4.44/5.0 |
| Live Suite | 20 | $636,373 | 99 | 4.79/5.0 |
| LiveSuites | 11 | $591,310 | 115 | 4.91/5.0 |
| Plushy | 3 | $505,381 | 138 | 4.73/5.0 |
| Briana | 8 | $472,079 | 1050 | 4.91/5.0 |
| Jennifer | 9 | $408,451 | 654 | 4.83/5.0 |
| Sarah | 1 | $367,436 | 64 | 4.94/5.0 |
Analyzing the strategies of top hosts, such as their property selection, pricing, and guest communication, can offer valuable lessons for optimizing your own Airbnb operations in Lihue.
Dive Deeper: Advanced Lihue STR Market Data (2026)
Ready to unlock more insights? AirROI provides access to advanced metrics and comprehensive Airbnb data for Lihue. Explore detailed analytics beyond this report to refine your investment strategy, optimize pricing, and maximize your vacation rental profits.
Explore Advanced MetricsLihue Short-Term Rental Market Composition (2026): Property & Room Types
Room Type Distribution
Property Type Distribution
Market Composition Insights for Lihue
- The Lihue Airbnb market composition is heavily skewed towards Entire Home/Apt listings, which make up 81.5% of the 329 active rentals. This indicates strong guest preference for privacy and space.
- Looking at the property type distribution in Lihue, Apartment/Condo properties are the most common (76.3%), reflecting the local real estate landscape.
- The presence of 16.1% Hotel/Boutique listings indicates integration with traditional hospitality.
- Smaller segments like outdoor/unique (combined 0.3%) offer potential for unique stay experiences.
Lihue Airbnb Room Capacity Analysis (2026): Bedroom Distribution
Distribution of Listings by Number of Bedrooms
Room Capacity Insights for Lihue
- The dominant room capacity in Lihue is 1 bedroom listings, making up 46.2% of the market. This suggests a strong demand for properties suitable for couples or solo travelers.
- Together, 1 bedroom and 2 bedrooms properties represent 76.9% of the active Airbnb listings in Lihue, indicating a high concentration in these sizes.
- Listings with 3+ bedrooms (3.9%) represent a smaller niche, potentially indicating an underserved market for larger group accommodations in Lihue.
Lihue Vacation Rental Guest Capacity Trends (2026)
Distribution of Listings by Guest Capacity
Guest Capacity Insights for Lihue
- The most common guest capacity trend in Lihue vacation rentals is listings accommodating 4 guests (39.8%). This suggests the primary traveler segment is likely small families or groups.
- Properties designed for 4 guests and 2 guests dominate the Lihue STR market, accounting for 66.9% of listings.
- 25.8% of properties accommodate 6+ guests, serving the market segment for larger families or group travel in Lihue.
- On average, properties in Lihue are equipped to host 4.0 guests.
Lihue Airbnb Booking Patterns (2026): Available vs. Booked Days
Available Days Distribution
Booked Days Distribution
Booking Pattern Insights for Lihue
- The most common availability pattern in Lihue falls within the 271-366 days range, representing 47.1% of listings. This suggests many properties have significant open periods on their calendars.
- Approximately 70.2% of listings show high availability (181+ days open annually), indicating potential for increased bookings or specific owner usage patterns.
- For booked days, the 31-90 days range is most frequent in Lihue (24.6%), reflecting common guest stay durations or potential owner blocking patterns.
- A notable 31.0% of properties secure long booking periods (181+ days booked per year), highlighting successful long-term rental strategies or significant owner usage.
Lihue Airbnb Minimum Stay Requirements Analysis
Distribution of Listings by Minimum Night Requirement
1 Night
39 listings
11.9% of total
2 Nights
112 listings
34% of total
3 Nights
23 listings
7% of total
4-6 Nights
24 listings
7.3% of total
7-29 Nights
5 listings
1.5% of total
30+ Nights
126 listings
38.3% of total
Key Insights
- The most prevalent minimum stay requirement in Lihue is 30+ Nights, adopted by 38.3% of listings. This highlights the market's preference for longer commitments.
- A significant segment (38.3%) caters to monthly stays (30+ nights) in Lihue, pointing to opportunities in the extended-stay market.
Recommendations
- Align with the market by considering a 30+ Nights minimum stay, as 38.3% of Lihue hosts use this setting.
- If feasible, allowing 1-night stays, especially midweek or during low season, could capture last-minute bookings, as only 11.9% currently do.
- A 2-night minimum appears standard (34%). Consider this for weekends or peak periods.
- Explore offering discounts for stays of 30+ nights to attract the 38.3% of the market seeking extended stays.
- Adjust minimum nights based on seasonality – potentially shorter during low season and longer during peak demand periods in Lihue.
Lihue Airbnb Cancellation Policy Trends Analysis (2026)
Super Strict 60 Days
24 listings
7.3% of total
Refundable
4 listings
1.2% of total
Super Strict 30 Days
1 listings
0.3% of total
Non-refundable
8 listings
2.4% of total
Flexible
5 listings
1.5% of total
Moderate
53 listings
16.1% of total
Firm
125 listings
38% of total
Strict
109 listings
33.1% of total
Cancellation Policy Insights for Lihue
- The prevailing Airbnb cancellation policy trend in Lihue is Firm, used by 38% of listings.
- A majority (71.1%) of hosts in Lihue utilize Firm or Strict policies, indicating a market where hosts prioritize booking security.
Recommendations for Hosts
- Consider adopting a Firm policy to align with the 38% market standard in Lihue.
- With 33.1% using Strict terms, this is a viable option in Lihue, particularly for high-value properties or during peak demand periods.
- Regularly review your cancellation policy against competitors and market demand shifts in Lihue.
Lihue STR Booking Lead Time Analysis (2026)
Average Booking Lead Time by Month
Booking Lead Time Insights for Lihue
- The overall average booking lead time for vacation rentals in Lihue is 60 days.
- Guests book furthest in advance for stays during January (average 77 days), likely coinciding with peak travel demand or local events.
- The shortest booking windows occur for stays in June (average 51 days), indicating more last-minute travel plans during this time.
- Seasonally, Fall (69 days avg.) sees the longest lead times, while Summer (54 days avg.) has the shortest, reflecting typical travel planning cycles.
Recommendations for Hosts
- Use the overall average lead time (60 days) as a baseline for your pricing and availability strategy in Lihue.
- For January stays, consider implementing length-of-stay discounts or slightly higher rates for bookings made less than 77 days out to capitalize on advance planning.
- Target marketing efforts for the Fall season well in advance (at least 69 days) to capture early planners.
- Monitor your own booking lead times against these Lihue averages to identify opportunities for dynamic pricing adjustments.
Popular & Essential Airbnb Amenities in Lihue (2026)
Amenity Prevalence
Amenity Insights for Lihue
- Essential amenities in Lihue that guests expect include: Wifi. Lacking these (this) could significantly impact bookings.
- Popular amenities like TV, Smoke alarm, Hair dryer are common but not universal. Offering these can provide a competitive edge.
- A pool is a highly desired but not standard amenity, making it a key feature for attracting guests seeking leisure in Lihue.
Recommendations for Hosts
- Ensure your listing includes all essential amenities for Lihue: Wifi.
- Consider adding popular differentiators like TV or Smoke alarm to increase appeal.
- Highlight unique or less common amenities you offer (e.g., hot tub, dedicated workspace, EV charger) in your listing description and photos.
- Regularly check competitor amenities in Lihue to stay competitive.
Lihue Airbnb Guest Demographics & Profile Analysis (2026)
Guest Profile Summary for Lihue
- The typical guest profile for Airbnb in Lihue consists of primarily domestic travelers (90%), often arriving from nearby Los Angeles, typically belonging to the Post-2000s (Gen Z/Alpha) group (50%), primarily speaking English or Spanish.
- Domestic travelers account for 89.9% of guests.
- Key international markets include United States (89.9%) and Canada (3.3%).
- Top languages spoken are English (66%) followed by Spanish (11.6%).
- A significant demographic segment is the Post-2000s (Gen Z/Alpha) group, representing 50% of guests.
Recommendations for Hosts
- Target domestic marketing efforts towards travelers from Los Angeles and Honolulu.
- Tailor amenities and listing descriptions to appeal to the dominant Post-2000s (Gen Z/Alpha) demographic (e.g., highlight fast WiFi, smart home features, local guides).
- Highlight unique local experiences or amenities relevant to the primary guest profile.
- Consider seasonal promotions aligned with peak travel times for key origin markets.
Nearby Short-Term Rental Market Comparison
How does the Lihue Airbnb market stack up against its neighbors? Compare key performance metrics like average monthly revenue, ADR, and occupancy rates in surrounding areas to understand the broader regional STR landscape.
| Market | Active Properties | Monthly Revenue | Daily Rate | Avg. Occupancy |
|---|---|---|---|---|
| Haena | 12 | $14,312 | $1130.41 | 51% |
| Anahola | 22 | $13,673 | $845.34 | 54% |
| Mākaha Valley | 96 | $13,116 | $669.71 | 70% |
| Kilauea | 45 | $9,733 | $1064.42 | 50% |
| Kekaha | 14 | $9,595 | $545.34 | 65% |
| Koloa | 266 | $8,991 | $942.59 | 48% |
| Hanalei | 426 | $6,937 | $560.08 | 50% |
| Poipu | 1,140 | $6,673 | $596.99 | 48% |
| Kapolei | 520 | $6,393 | $688.27 | 44% |
| Kapaa | 233 | $5,645 | $425.03 | 53% |