Maui County Airbnb Market Analysis 2026: Short Term Rental Data & Vacation Rental Statistics in Hawaii, United States
Is Airbnb profitable in Maui County in 2026? Explore comprehensive Airbnb analytics for Maui County, Hawaii, United States to uncover income potential. This 2026 STR market report for Maui County, based on AirROI data from February 2025 to January 2026, reveals key trends in the niche market of 19 active listings.
Whether you're considering an Airbnb investment in Maui County, optimizing your existing vacation rental, or exploring rental arbitrage opportunities, understanding the Maui County Airbnb data is crucial. Navigating the high regulation landscape is key to maximizing your short term rental income potential. Let's dive into the specifics.
Key Maui County Airbnb Performance Metrics Overview
Monthly Airbnb Revenue Variations & Income Potential in Maui County (2026)
Understanding the monthly revenue variations for Airbnb listings in Maui County is key to maximizing your short term rental income potential. Seasonality significantly impacts earnings. Our analysis, based on data from the past 12 months, shows that the peak revenue month for STRs in Maui County is typically February, while December often presents the lowest earnings, highlighting opportunities for strategic pricing adjustments during shoulder and low seasons. Explore the typical Airbnb income in Maui County across different performance tiers:
- Best-in-class properties (Top 10%) achieve $14,018+ monthly, often utilizing dynamic pricing and superior guest experiences.
- Strong performing properties (Top 25%) earn $7,576 or more, indicating effective management and desirable locations/amenities.
- Typical properties (Median) generate around $4,407 per month, representing the average market performance.
- Entry-level properties (Bottom 25%) see earnings around $2,336, often with potential for optimization.
Average Monthly Airbnb Earnings Trend in Maui County
Maui County Airbnb Occupancy Rate Trends (2026)
Maximize your bookings by understanding the Maui County STR occupancy trends. Seasonal demand shifts significantly influence how often properties are booked. Typically, Februarysees the highest demand (peak season occupancy), while December experiences the lowest (low season). Effective strategies, like adjusting minimum stays or offering promotions, can boost occupancy during slower periods. Here's how different property tiers perform in Maui County:
- Best-in-class properties (Top 10%) achieve 86%+ occupancy, indicating high desirability and potentially optimized availability.
- Strong performing properties (Top 25%) maintain 74% or higher occupancy, suggesting good market fit and guest satisfaction.
- Typical properties (Median) have an occupancy rate around 46%.
- Entry-level properties (Bottom 25%) average 28% occupancy, potentially facing higher vacancy.
Average Monthly Occupancy Rate Trend in Maui County
Average Daily Rate (ADR) Airbnb Trends in Maui County (2026)
Effective short term rental pricing strategy in Maui County involves understanding monthly ADR fluctuations. The Average Daily Rate (ADR) for Airbnb in Maui County typically peaks in December and dips lowest during May. Leveraging Airbnb dynamic pricing tools or strategies based on this seasonality can significantly boost revenue. Here's a look at the typical nightly rates achieved:
- Best-in-class properties (Top 10%) command rates of $582+ per night, often due to premium features or locations.
- Strong performing properties (Top 25%) achieve nightly rates of $380 or more.
- Typical properties (Median) charge around $311 per night.
- Entry-level properties (Bottom 25%) earn around $214 per night.
Average Daily Rate (ADR) Trend by Month in Maui County
Get Live Maui County Market Intelligence 👇

Explore Real-time Analytics
Airbnb Seasonality Analysis & Trends in Maui County (2026)
Peak Season (February, November, March)
- Revenue averages $7,516 per month
- Occupancy rates average 62.5%
- Daily rates average $346
Shoulder Season
- Revenue averages $5,567 per month
- Occupancy maintains around 49.9%
- Daily rates hold near $329
Low Season (January, September, December)
- Revenue drops to average $4,238 per month
- Occupancy decreases to average 38.0%
- Daily rates adjust to average $351
Seasonality Insights for Maui County
- The Airbnb seasonality in Maui County shows highly seasonal trends requiring careful strategy. While the sections above show seasonal averages, it's also insightful to look at the extremes:
- During the high season, the absolute peak month showcases Maui County's highest earning potential, with monthly revenues capable of climbing to $8,317, occupancy reaching a high of 75.2%, and ADRs peaking at $362.
- Conversely, the slowest single month of the year, typically falling within the low season, marks the market's lowest point. In this month, revenue might dip to $3,520, occupancy could drop to 29.9%, and ADRs may adjust down to $319.
- Understanding both the seasonal averages and these monthly peaks and troughs in revenue, occupancy, and ADR is crucial for maximizing your Airbnb profit potential in Maui County.
Seasonal Strategies for Maximizing Profit
- Peak Season: Maximize revenue through premium pricing and potentially longer minimum stays. Ensure high availability.
- Low Season: Offer competitive pricing, special promotions (e.g., extended stay discounts), and flexible cancellation policies. Target off-season travelers like remote workers or budget-conscious guests.
- Shoulder Seasons: Implement dynamic pricing that balances peak and low rates. Target weekend travelers or specific events. Offer slightly more flexible terms than peak season.
- Regularly analyze your own performance against these Maui County seasonality benchmarks and adjust your pricing and availability strategy accordingly.
Best Areas for Airbnb Investment in Maui County (2026)
Exploring the top neighborhoods for short-term rentals in Maui County? This section highlights key areas, outlining why they are attractive for hosts and guests, along with notable local attractions. Consider these locations based on your target guest profile and investment strategy.
| Neighborhood / Area | Why Host Here? (Target Guests & Appeal) | Key Attractions & Landmarks |
|---|---|---|
| Lahaina | Historic town known for its rich history, art galleries, and beautiful beaches. Popular with tourists looking for a charming atmosphere and cultural experiences. | Lahaina Historic District, Banyan Tree Park, Whalers Village, Kaanapali Beach, Lahaina Harbor |
| Kaanapali | Famous resort area with stunning beaches, golf courses, and luxury hotels. Attracts visitors looking for a resort experience and water activities. | Kaanapali Beach, Black Rock, Whalers Village, Kaanapali Golf Courses, snorkeling and diving spots |
| Wailea | Upscale resort community known for its beautiful beaches, high-end resorts, and golf courses. Popular among affluent travelers seeking a luxury experience. | Wailea Beach, Makena State Park, Shopping at The Shops at Wailea, Wailea Golf Club, Maui Ocean Center |
| Makena | Secluded and serene area with gorgeous beaches and natural beauty. Ideal for visitors looking for a quieter retreat away from the crowds. | Makena Beach, Ahihi-Kinau Natural Area Reserve, Little Beach, Big Beach, Maui’s Lava Fields |
| Paia | Hip town known for its bohemian vibe, surf culture, and proximity to the Road to Hana. Attracts surfers and travelers looking for a laid-back atmosphere. | Ho'okipa Beach Park, Paia Town, Baldwin Beach Park, Mama's Fish House, Surfing spots |
| Hana | Remote and picturesque town famous for its scenic beauty and waterfalls. Perfect for travelers seeking adventure and natural wonders. | Hana Highway, Wai'anapanapa State Park, Hamoa Beach, Ohe'o Gulch (Seven Sacred Pools), Red Sand Beach |
| Kihei | Family-friendly beach town known for its affordable accommodations and access to beautiful beaches. Great for travelers looking for a more casual atmosphere without the luxury price tag. | Kamaole Beach Parks, Sugar Beach, Wailea Beach Path, Kihei Kalama Village, Snorkeling spots |
| Molokai | Less touristy island with a rich Hawaiian culture and natural beauty. Good for those looking to experience authentic Hawaiian life away from the hustle and bustle. | Kalaupapa National Historical Park, Halawa Valley, Papohaku Beach, Molokai Museum and Cultural Center, Molokai's stunning cliffs |
Understanding Airbnb License Requirements & STR Laws in Maui County (2026)
Yes, Maui County, Hawaii, United States enforces high STR regulations. Obtaining a license and ensuring compliance is almost certainly required according to current 2026 STR laws. Always verify the latest short term rental regulations and Airbnb license requirements directly with local government authorities for Maui County to ensure full compliance before hosting.
(Source: AirROI data, 2026, based on 100% licensed listings)
Top Performing Airbnb Properties in Maui County (2026)
Benchmark your potential! Explore examples of top-performing Airbnb properties in Maui Countybased on Trailing Twelve Month (TTM) revenue. Analyze their characteristics, revenue, occupancy rate, and ADR to understand what drives success in this market.

Cliff House w/ Ocean View Haiku, Maui Road to Hana
Entire Place • 1 bedroom
House w/ Ocean Views in Haiku Maui on Road to Hana
Entire Place • 1 bedroom

Jasmine Suite Farm Stay in Haiku on Road to Hana
Entire Place • 1 bedroom
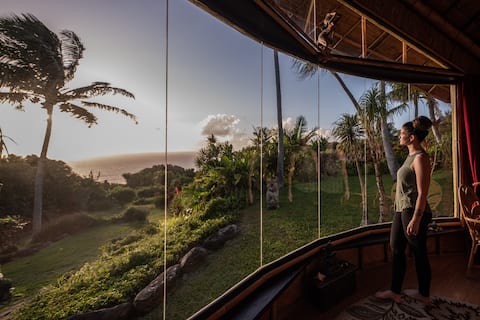
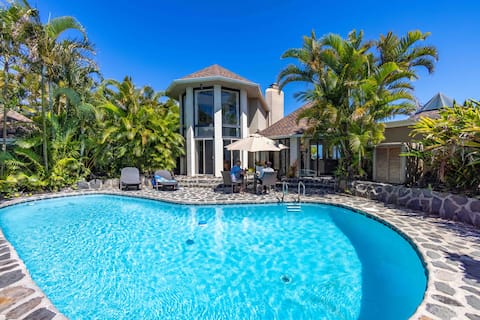
Honeymoon Haven: Ocean Vista & Bamboo Temple Bliss
Entire Place • 1 bedroom
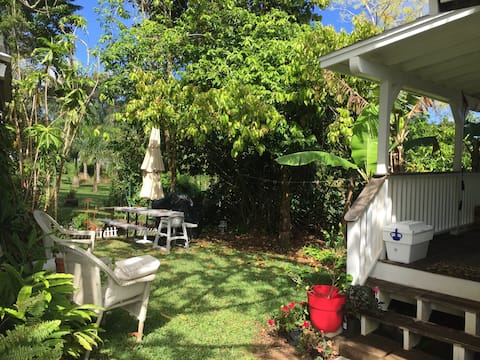
sweet country cottage on 2 acres; palm trees birds
Entire Place • 1 bedroom
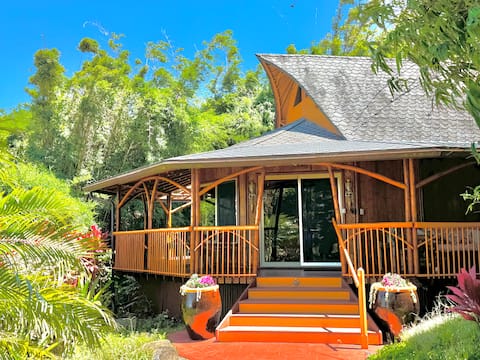
Thai Hale: Eco Retreat with OCEAN VIEW & Waterfall
Entire Place • 2 bedrooms
Note: Performance varies based on location, size, amenities, seasonality, and management quality. Data reflects the past 12 months.
Top Performing Airbnb Hosts in Maui County (2026)
Learn from the best! This table showcases top-performing Airbnb hosts in Maui County based on the number of properties managed and estimated total revenue over the past year. Analyze their scale and performance metrics.
| Host Name | Properties | Grossing Revenue | Stay Reviews | Avg Rating |
|---|---|---|---|---|
| Lori | 5 | $495,546 | 291 | 4.78/5.0 |
| Maui Eco Retreat | 5 | $230,378 | 584 | 4.74/5.0 |
| Audrey | 2 | $85,163 | 222 | 4.81/5.0 |
| Hawaii Life Rentals | 1 | $58,397 | 3 | 5.00/5.0 |
| Maggie & John | 1 | $48,750 | 100 | 4.93/5.0 |
| Fei | 1 | $48,540 | 53 | 4.77/5.0 |
| John & Maggie | 1 | $41,815 | 231 | 4.91/5.0 |
| Polina | 1 | $31,674 | 27 | 5.00/5.0 |
| Tommy | 1 | $14,018 | 22 | 4.77/5.0 |
| Diane | 1 | $2,970 | 17 | 4.71/5.0 |
Analyzing the strategies of top hosts, such as their property selection, pricing, and guest communication, can offer valuable lessons for optimizing your own Airbnb operations in Maui County.
Dive Deeper: Advanced Maui County STR Market Data (2026)
Ready to unlock more insights? AirROI provides access to advanced metrics and comprehensive Airbnb data for Maui County. Explore detailed analytics beyond this report to refine your investment strategy, optimize pricing, and maximize your vacation rental profits.
Explore Advanced MetricsMaui County Short-Term Rental Market Composition (2026): Property & Room Types
Room Type Distribution
Property Type Distribution
Market Composition Insights for Maui County
- The Maui County Airbnb market composition is heavily skewed towards Entire Home/Apt listings, which make up 73.7% of the 19 active rentals. This indicates strong guest preference for privacy and space.
- Looking at the property type distribution in Maui County, House properties are the most common (42.1%), reflecting the local real estate landscape.
- Houses represent a significant 42.1% portion, catering likely to families or larger groups.
- The presence of 21.1% Hotel/Boutique listings indicates integration with traditional hospitality.
Maui County Airbnb Room Capacity Analysis (2026): Bedroom Distribution
Distribution of Listings by Number of Bedrooms
Room Capacity Insights for Maui County
- The dominant room capacity in Maui County is 1 bedroom listings, making up 68.4% of the market. This suggests a strong demand for properties suitable for couples or solo travelers.
- Together, 1 bedroom and 2 bedrooms properties represent 94.7% of the active Airbnb listings in Maui County, indicating a high concentration in these sizes.
- With over half the market (68.4%) consisting of studios or 1-bedroom units, Maui County is particularly well-suited for individuals or couples.
Maui County Vacation Rental Guest Capacity Trends (2026)
Distribution of Listings by Guest Capacity
Guest Capacity Insights for Maui County
- The most common guest capacity trend in Maui County vacation rentals is listings accommodating 2 guests (52.6%). This suggests the primary traveler segment is likely couples or solo travelers.
- Properties designed for 2 guests and 4 guests dominate the Maui County STR market, accounting for 73.7% of listings.
- A significant 52.6% of listings cater specifically to 1-2 guests, highlighting strong demand from couples and solo travelers in Maui County.
- 10.5% of properties accommodate 6+ guests, serving the market segment for larger families or group travel in Maui County.
- On average, properties in Maui County are equipped to host 2.9 guests.
Maui County Airbnb Booking Patterns (2026): Available vs. Booked Days
Available Days Distribution
Booked Days Distribution
Booking Pattern Insights for Maui County
- The most common availability pattern in Maui County falls within the 181-270 days range, representing 42.1% of listings. This suggests many properties have significant open periods on their calendars.
- Approximately 63.2% of listings show high availability (181+ days open annually), indicating potential for increased bookings or specific owner usage patterns.
- For booked days, the 91-180 days range is most frequent in Maui County (42.1%), reflecting common guest stay durations or potential owner blocking patterns.
- A notable 36.9% of properties secure long booking periods (181+ days booked per year), highlighting successful long-term rental strategies or significant owner usage.
Maui County Airbnb Minimum Stay Requirements Analysis
Distribution of Listings by Minimum Night Requirement
1 Night
3 listings
15.8% of total
2 Nights
1 listings
5.3% of total
3 Nights
1 listings
5.3% of total
30+ Nights
14 listings
73.7% of total
Key Insights
- The most prevalent minimum stay requirement in Maui County is 30+ Nights, adopted by 73.7% of listings. This highlights the market's preference for longer commitments.
- A significant segment (73.7%) caters to monthly stays (30+ nights) in Maui County, pointing to opportunities in the extended-stay market.
Recommendations
- Align with the market by considering a 30+ Nights minimum stay, as 73.7% of Maui County hosts use this setting.
- If feasible, allowing 1-night stays, especially midweek or during low season, could capture last-minute bookings, as only 15.8% currently do.
- Explore offering discounts for stays of 30+ nights to attract the 73.7% of the market seeking extended stays.
- Adjust minimum nights based on seasonality – potentially shorter during low season and longer during peak demand periods in Maui County.
Maui County Airbnb Cancellation Policy Trends Analysis (2026)
Limited
2 listings
10.5% of total
Moderate
6 listings
31.6% of total
Firm
9 listings
47.4% of total
Strict
2 listings
10.5% of total
Cancellation Policy Insights for Maui County
- The prevailing Airbnb cancellation policy trend in Maui County is Firm, used by 47.4% of listings.
- A majority (57.9%) of hosts in Maui County utilize Firm or Strict policies, indicating a market where hosts prioritize booking security.
Recommendations for Hosts
- Consider adopting a Firm policy to align with the 47.4% market standard in Maui County.
- Using a Strict policy might deter some guests, as only 10.5% of listings use it. Evaluate if potential revenue protection outweighs possible lower booking rates.
- Regularly review your cancellation policy against competitors and market demand shifts in Maui County.
Maui County STR Booking Lead Time Analysis (2026)
Average Booking Lead Time by Month
Booking Lead Time Insights for Maui County
- The overall average booking lead time for vacation rentals in Maui County is 58 days.
- Guests book furthest in advance for stays during December (average 67 days), likely coinciding with peak travel demand or local events.
- The shortest booking windows occur for stays in April (average 44 days), indicating more last-minute travel plans during this time.
- Seasonally, Winter (60 days avg.) sees the longest lead times, while Spring (48 days avg.) has the shortest, reflecting typical travel planning cycles.
Recommendations for Hosts
- Use the overall average lead time (58 days) as a baseline for your pricing and availability strategy in Maui County.
- Target marketing efforts for the Winter season well in advance (at least 60 days) to capture early planners.
- Monitor your own booking lead times against these Maui County averages to identify opportunities for dynamic pricing adjustments.
Popular & Essential Airbnb Amenities in Maui County (2026)
Amenity Prevalence
Amenity Insights for Maui County
- Essential amenities in Maui County that guests expect include: Free parking on premises, Wifi, Smoke alarm, Dishes and silverware, Cooking basics, Kitchen. Lacking these (any) could significantly impact bookings.
- Popular amenities like Fire extinguisher, Hair dryer, Hot water are common but not universal. Offering these can provide a competitive edge.
Recommendations for Hosts
- Ensure your listing includes all essential amenities for Maui County: Free parking on premises, Wifi, Smoke alarm, Dishes and silverware, Cooking basics, Kitchen.
- Consider adding popular differentiators like Fire extinguisher or Hair dryer to increase appeal.
- Highlight unique or less common amenities you offer (e.g., hot tub, dedicated workspace, EV charger) in your listing description and photos.
- Regularly check competitor amenities in Maui County to stay competitive.
Maui County Airbnb Guest Demographics & Profile Analysis (2026)
Guest Profile Summary for Maui County
- The typical guest profile for Airbnb in Maui County consists of primarily domestic travelers (87%), often arriving from nearby San Diego, typically belonging to the Post-2000s (Gen Z/Alpha) group (50%), primarily speaking English or Spanish.
- Domestic travelers account for 86.7% of guests.
- Key international markets include United States (86.7%) and Canada (3.9%).
- Top languages spoken are English (63.3%) followed by Spanish (12.2%).
- A significant demographic segment is the Post-2000s (Gen Z/Alpha) group, representing 50% of guests.
Recommendations for Hosts
- Target domestic marketing efforts towards travelers from San Diego and Los Angeles.
- Tailor amenities and listing descriptions to appeal to the dominant Post-2000s (Gen Z/Alpha) demographic (e.g., highlight fast WiFi, smart home features, local guides).
- Highlight unique local experiences or amenities relevant to the primary guest profile.
- Consider seasonal promotions aligned with peak travel times for key origin markets.
Nearby Short-Term Rental Market Comparison
How does the Maui County Airbnb market stack up against its neighbors? Compare key performance metrics like average monthly revenue, ADR, and occupancy rates in surrounding areas to understand the broader regional STR landscape.
| Market | Active Properties | Monthly Revenue | Daily Rate | Avg. Occupancy |
|---|---|---|---|---|
| Kahuku | 287 | $11,358 | $679.39 | 64% |
| Kula | 11 | $9,130 | $383.13 | 79% |
| Waimea | 416 | $8,098 | $819.38 | 43% |
| Puakō | 62 | $7,820 | $874.88 | 44% |
| Hana | 68 | $7,791 | $413.38 | 65% |
| Makawao | 19 | $7,315 | $437.12 | 67% |
| Kapalua | 297 | $7,140 | $741.15 | 42% |
| Honalo | 24 | $7,044 | $410.83 | 56% |
| Paia | 88 | $6,942 | $546.66 | 49% |
| Wailea-Makena | 11 | $6,581 | $787.33 | 46% |