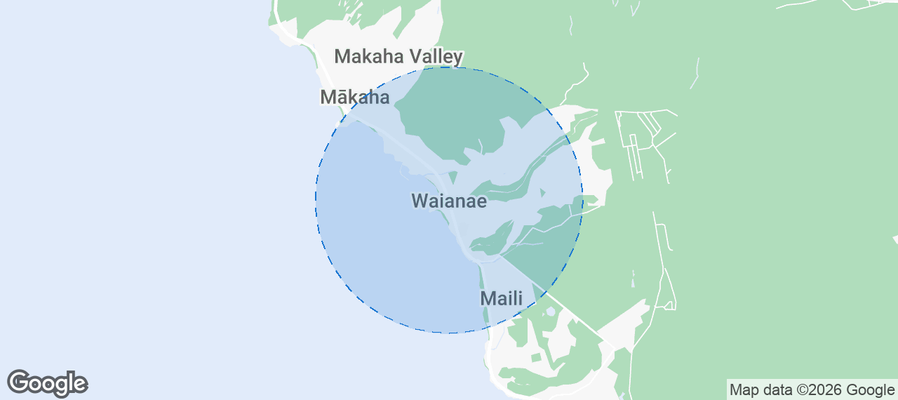
Waianae Airbnb Market Analysis 2026: Short Term Rental Data & Vacation Rental Statistics in Hawaii, United States
Is Airbnb profitable in Waianae in 2026? Explore comprehensive Airbnb analytics for Waianae, Hawaii, United States to uncover income potential. This 2026 STR market report for Waianae, based on AirROI data from February 2025 to January 2026, reveals key trends in the niche market of 23 active listings.
Whether you're considering an Airbnb investment in Waianae, optimizing your existing vacation rental, or exploring rental arbitrage opportunities, understanding the Waianae Airbnb data is crucial. Navigating the high regulation landscape is key to maximizing your short term rental income potential. Let's dive into the specifics.
Key Waianae Airbnb Performance Metrics Overview
Monthly Airbnb Revenue Variations & Income Potential in Waianae (2026)
Understanding the monthly revenue variations for Airbnb listings in Waianae is key to maximizing your short term rental income potential. Seasonality significantly impacts earnings. Our analysis, based on data from the past 12 months, shows that the peak revenue month for STRs in Waianae is typically December, while May often presents the lowest earnings, highlighting opportunities for strategic pricing adjustments during shoulder and low seasons. Explore the typical Airbnb income in Waianae across different performance tiers:
- Best-in-class properties (Top 10%) achieve $16,573+ monthly, often utilizing dynamic pricing and superior guest experiences.
- Strong performing properties (Top 25%) earn $10,709 or more, indicating effective management and desirable locations/amenities.
- Typical properties (Median) generate around $5,205 per month, representing the average market performance.
- Entry-level properties (Bottom 25%) see earnings around $1,809, often with potential for optimization.
Average Monthly Airbnb Earnings Trend in Waianae
Waianae Airbnb Occupancy Rate Trends (2026)
Maximize your bookings by understanding the Waianae STR occupancy trends. Seasonal demand shifts significantly influence how often properties are booked. Typically, Octobersees the highest demand (peak season occupancy), while May experiences the lowest (low season). Effective strategies, like adjusting minimum stays or offering promotions, can boost occupancy during slower periods. Here's how different property tiers perform in Waianae:
- Best-in-class properties (Top 10%) achieve 81%+ occupancy, indicating high desirability and potentially optimized availability.
- Strong performing properties (Top 25%) maintain 64% or higher occupancy, suggesting good market fit and guest satisfaction.
- Typical properties (Median) have an occupancy rate around 39%.
- Entry-level properties (Bottom 25%) average 26% occupancy, potentially facing higher vacancy.
Average Monthly Occupancy Rate Trend in Waianae
Average Daily Rate (ADR) Airbnb Trends in Waianae (2026)
Effective short term rental pricing strategy in Waianae involves understanding monthly ADR fluctuations. The Average Daily Rate (ADR) for Airbnb in Waianae typically peaks in December and dips lowest during August. Leveraging Airbnb dynamic pricing tools or strategies based on this seasonality can significantly boost revenue. Here's a look at the typical nightly rates achieved:
- Best-in-class properties (Top 10%) command rates of $711+ per night, often due to premium features or locations.
- Strong performing properties (Top 25%) achieve nightly rates of $572 or more.
- Typical properties (Median) charge around $332 per night.
- Entry-level properties (Bottom 25%) earn around $109 per night.
Average Daily Rate (ADR) Trend by Month in Waianae
Get Live Waianae Market Intelligence 👇
Explore Real-time Analytics
Airbnb Seasonality Analysis & Trends in Waianae (2026)
Peak Season (December, October, November)
- Revenue averages $10,832 per month
- Occupancy rates average 54.8%
- Daily rates average $456
Shoulder Season
- Revenue averages $7,476 per month
- Occupancy maintains around 47.2%
- Daily rates hold near $383
Low Season (February, March, May)
- Revenue drops to average $4,651 per month
- Occupancy decreases to average 36.7%
- Daily rates adjust to average $351
Seasonality Insights for Waianae
- The Airbnb seasonality in Waianae shows highly seasonal trends requiring careful strategy. While the sections above show seasonal averages, it's also insightful to look at the extremes:
- During the high season, the absolute peak month showcases Waianae's highest earning potential, with monthly revenues capable of climbing to $12,336, occupancy reaching a high of 60.6%, and ADRs peaking at $510.
- Conversely, the slowest single month of the year, typically falling within the low season, marks the market's lowest point. In this month, revenue might dip to $4,217, occupancy could drop to 23.8%, and ADRs may adjust down to $330.
- Understanding both the seasonal averages and these monthly peaks and troughs in revenue, occupancy, and ADR is crucial for maximizing your Airbnb profit potential in Waianae.
Seasonal Strategies for Maximizing Profit
- Peak Season: Maximize revenue through premium pricing and potentially longer minimum stays. Ensure high availability.
- Low Season: Offer competitive pricing, special promotions (e.g., extended stay discounts), and flexible cancellation policies. Target off-season travelers like remote workers or budget-conscious guests.
- Shoulder Seasons: Implement dynamic pricing that balances peak and low rates. Target weekend travelers or specific events. Offer slightly more flexible terms than peak season.
- Regularly analyze your own performance against these Waianae seasonality benchmarks and adjust your pricing and availability strategy accordingly.
Best Areas for Airbnb Investment in Waianae (2026)
Exploring the top neighborhoods for short-term rentals in Waianae? This section highlights key areas, outlining why they are attractive for hosts and guests, along with notable local attractions. Consider these locations based on your target guest profile and investment strategy.
| Neighborhood / Area | Why Host Here? (Target Guests & Appeal) | Key Attractions & Landmarks |
|---|---|---|
| Makaha Beach | Known for its beautiful sandy shores and stunning sunsets, Makaha Beach is a peaceful paradise. It attracts both local and visiting beach lovers looking for a relaxing getaway, making it a prime spot for Airbnb hosting. | Makaha Beach Park, Makaha Surfing Beach, Makua Beach, Kaena Point, Turtle Cove |
| Kaena Point | Kaena Point is a remote and scenic area that offers stunning views and a sense of adventure. It's perfect for outdoor enthusiasts and nature lovers, which makes it appealing for unique Airbnb experiences. | Kaena Point Trail, Nature Reserve, Hiking Trails, Wildlife Viewing |
| Waianae Coast | This area includes various secluded beaches and is less commercialized than other parts of Oahu. It's ideal for visitors wanting a true Hawaiian experience away from the crowded tourist spots. | Makaha Valley, Pokai Bay Beach Park, Nanakuli Beach Park, Paradise Cove, Yokohama Bay |
| Maili Beach | Maili Beach is a family-friendly beach that offers soft sand and calm waters, making it ideal for families with children. It's a great place to relax and enjoy the sun, attracting families for vacation rentals. | Maili Beach Park, Kuʻuloa Mini Golf, Historical Sites, Beach Activities |
| Makua Beach | With its picturesque scenery and fewer crowds, Makua Beach is a hidden gem on the Waianae Coast, attracting visitors looking for a serene experience combined with natural beauty. | Makua Cave, Snorkeling, Scenic Views, Hiking Opportunities |
| Laie Point | While technically outside of Waianae, Laie Point is nearby and offers stunning ocean views and activities, making it a desirable location for those looking to capture the beauty of Hawaii through Airbnb. | Laie Point State Wayside, Snorkeling Areas, Scenic Cliffs |
| Keaau Beach Park | This less-developed beach area provides an authentic experience and is often frequented by locals seeking a getaway, making it an appealing option for hosted rentals that highlight a true Hawaiian lifestyle. | Keaau Beach, Local Food Stands, Nature Trails, Fishing Spots |
| Waianae Harbor | The harbor offers great access to fishing, boating, and cultural experiences, making it a great place for visitors interested in water activities and exploring local culture, favorable for Airbnb hosts. | Fishing Charters, Boat Tours, Local Restaurants, Cultural Events |
Understanding Airbnb License Requirements & STR Laws in Waianae (2026)
Yes, Waianae, Hawaii, United States enforces high STR regulations. Obtaining a license and ensuring compliance is almost certainly required according to current 2026 STR laws. Always verify the latest short term rental regulations and Airbnb license requirements directly with local government authorities for Waianae to ensure full compliance before hosting.
(Source: AirROI data, 2026, based on 78% licensed listings)
Top Performing Airbnb Properties in Waianae (2026)
Benchmark your potential! Explore examples of top-performing Airbnb properties in Waianaebased on Trailing Twelve Month (TTM) revenue. Analyze their characteristics, revenue, occupancy rate, and ADR to understand what drives success in this market.

Hina & Honu Hideout
Entire Place • 7 bedrooms

Airbnb's Top 1% Budget Friendly Home Near Beach
Entire Place • 4 bedrooms

4 beds, Near Beach, Pool, Spa, Gym, Ocean Views
Entire Place • 4 bedrooms

Ocean View Exquisite Home at Cottages at Mauna Olu
Entire Place • 4 bedrooms

Top 5% Family-Friendly Home By Beach -Honu Hideout
Entire Place • 3 bedrooms

Ocean Views Serene Vacation Escape Home Near Beach
Entire Place • 4 bedrooms
Note: Performance varies based on location, size, amenities, seasonality, and management quality. Data reflects the past 12 months.
Top Performing Airbnb Hosts in Waianae (2026)
Learn from the best! This table showcases top-performing Airbnb hosts in Waianae based on the number of properties managed and estimated total revenue over the past year. Analyze their scale and performance metrics.
| Host Name | Properties | Grossing Revenue | Stay Reviews | Avg Rating |
|---|---|---|---|---|
| Richard | 3 | $495,998 | 48 | 5.00/5.0 |
| Ali'I Beach Rentals | 5 | $315,111 | 104 | 4.90/5.0 |
| Ali'I Beach Rentals | 2 | $212,251 | 60 | 4.92/5.0 |
| Kerstan | 2 | $124,594 | 27 | 4.85/5.0 |
| Nicolas | 1 | $84,215 | 86 | 4.92/5.0 |
| Travis And Emi | 1 | $84,080 | 9 | 5.00/5.0 |
| Fred | 1 | $69,083 | 10 | 5.00/5.0 |
| Kiril | 1 | $29,578 | 4 | 5.00/5.0 |
| James | 1 | $16,972 | 21 | 4.95/5.0 |
| Wesley | 1 | $13,464 | 5 | 5.00/5.0 |
Analyzing the strategies of top hosts, such as their property selection, pricing, and guest communication, can offer valuable lessons for optimizing your own Airbnb operations in Waianae.
Dive Deeper: Advanced Waianae STR Market Data (2026)
Ready to unlock more insights? AirROI provides access to advanced metrics and comprehensive Airbnb data for Waianae. Explore detailed analytics beyond this report to refine your investment strategy, optimize pricing, and maximize your vacation rental profits.
Explore Advanced MetricsWaianae Short-Term Rental Market Composition (2026): Property & Room Types
Room Type Distribution
Property Type Distribution
Market Composition Insights for Waianae
- The Waianae Airbnb market composition is heavily skewed towards Entire Home/Apt listings, which make up 91.3% of the 23 active rentals. This indicates strong guest preference for privacy and space.
- Looking at the property type distribution in Waianae, House properties are the most common (87%), reflecting the local real estate landscape.
- Houses represent a significant 87% portion, catering likely to families or larger groups.
Waianae Airbnb Room Capacity Analysis (2026): Bedroom Distribution
Distribution of Listings by Number of Bedrooms
Room Capacity Insights for Waianae
- The dominant room capacity in Waianae is 4 bedrooms listings, making up 34.8% of the market. This suggests a strong demand for properties suitable for families or small groups.
- Together, 4 bedrooms and 3 bedrooms properties represent 69.6% of the active Airbnb listings in Waianae, indicating a high concentration in these sizes.
- A significant 73.9% of listings offer 3+ bedrooms, catering to larger groups and families seeking more space in Waianae.
Waianae Vacation Rental Guest Capacity Trends (2026)
Distribution of Listings by Guest Capacity
Guest Capacity Insights for Waianae
- The most common guest capacity trend in Waianae vacation rentals is listings accommodating 8+ guests (65.2%). This suggests the primary traveler segment is likely larger groups.
- Properties designed for 8+ guests and 6 guests dominate the Waianae STR market, accounting for 78.2% of listings.
- 78.2% of properties accommodate 6+ guests, serving the market segment for larger families or group travel in Waianae.
- On average, properties in Waianae are equipped to host 6.6 guests.
Waianae Airbnb Booking Patterns (2026): Available vs. Booked Days
Available Days Distribution
Booked Days Distribution
Booking Pattern Insights for Waianae
- The most common availability pattern in Waianae falls within the 181-270 days range, representing 69.6% of listings. This suggests many properties have significant open periods on their calendars.
- Approximately 95.7% of listings show high availability (181+ days open annually), indicating potential for increased bookings or specific owner usage patterns.
- For booked days, the 91-180 days range is most frequent in Waianae (73.9%), reflecting common guest stay durations or potential owner blocking patterns.
- A notable 4.3% of properties secure long booking periods (181+ days booked per year), highlighting successful long-term rental strategies or significant owner usage.
Waianae Airbnb Minimum Stay Requirements Analysis
Distribution of Listings by Minimum Night Requirement
1 Night
1 listings
4.3% of total
2 Nights
2 listings
8.7% of total
3 Nights
7 listings
30.4% of total
7-29 Nights
5 listings
21.7% of total
30+ Nights
8 listings
34.8% of total
Key Insights
- The most prevalent minimum stay requirement in Waianae is 30+ Nights, adopted by 34.8% of listings. This highlights the market's preference for longer commitments.
- Very short stays (1-2 nights) are less common (13.0%), suggesting hosts prefer slightly longer bookings to optimize turnover.
- A significant segment (34.8%) caters to monthly stays (30+ nights) in Waianae, pointing to opportunities in the extended-stay market.
Recommendations
- Align with the market by considering a 30+ Nights minimum stay, as 34.8% of Waianae hosts use this setting.
- If feasible, allowing 1-night stays, especially midweek or during low season, could capture last-minute bookings, as only 4.3% currently do.
- Explore offering discounts for stays of 30+ nights to attract the 34.8% of the market seeking extended stays.
- Adjust minimum nights based on seasonality – potentially shorter during low season and longer during peak demand periods in Waianae.
Waianae Airbnb Cancellation Policy Trends Analysis (2026)
Flexible
2 listings
8.7% of total
Moderate
8 listings
34.8% of total
Firm
12 listings
52.2% of total
Strict
1 listings
4.3% of total
Cancellation Policy Insights for Waianae
- The prevailing Airbnb cancellation policy trend in Waianae is Firm, used by 52.2% of listings.
- A majority (56.5%) of hosts in Waianae utilize Firm or Strict policies, indicating a market where hosts prioritize booking security.
- Strict cancellation policies are quite rare (4.3%), potentially making listings with this policy less competitive unless justified by high demand or property type.
Recommendations for Hosts
- Consider adopting a Firm policy to align with the 52.2% market standard in Waianae.
- Using a Strict policy might deter some guests, as only 4.3% of listings use it. Evaluate if potential revenue protection outweighs possible lower booking rates.
- Regularly review your cancellation policy against competitors and market demand shifts in Waianae.
Waianae STR Booking Lead Time Analysis (2026)
Average Booking Lead Time by Month
Booking Lead Time Insights for Waianae
- The overall average booking lead time for vacation rentals in Waianae is 44 days.
- Guests book furthest in advance for stays during December (average 72 days), likely coinciding with peak travel demand or local events.
- The shortest booking windows occur for stays in May (average 22 days), indicating more last-minute travel plans during this time.
- Seasonally, Fall (50 days avg.) sees the longest lead times, while Summer (32 days avg.) has the shortest, reflecting typical travel planning cycles.
Recommendations for Hosts
- Use the overall average lead time (44 days) as a baseline for your pricing and availability strategy in Waianae.
- For December stays, consider implementing length-of-stay discounts or slightly higher rates for bookings made less than 72 days out to capitalize on advance planning.
- Target marketing efforts for the Fall season well in advance (at least 50 days) to capture early planners.
- Monitor your own booking lead times against these Waianae averages to identify opportunities for dynamic pricing adjustments.
Popular & Essential Airbnb Amenities in Waianae (2026)
Amenity Prevalence
Amenity Insights for Waianae
- Essential amenities in Waianae that guests expect include: TV, Wifi, Air conditioning, Free parking on premises, Coffee maker. Lacking these (any) could significantly impact bookings.
- Popular amenities like Kitchen, Hair dryer, Bed linens are common but not universal. Offering these can provide a competitive edge.
Recommendations for Hosts
- Ensure your listing includes all essential amenities for Waianae: TV, Wifi, Air conditioning, Free parking on premises, Coffee maker.
- Prioritize adding missing essentials: Wifi, Air conditioning, Free parking on premises, Coffee maker.
- Consider adding popular differentiators like Kitchen or Hair dryer to increase appeal.
- Highlight unique or less common amenities you offer (e.g., hot tub, dedicated workspace, EV charger) in your listing description and photos.
- Regularly check competitor amenities in Waianae to stay competitive.
Waianae Airbnb Guest Demographics & Profile Analysis (2026)
Guest Profile Summary for Waianae
- The typical guest profile for Airbnb in Waianae consists of primarily domestic travelers (88%), often arriving from nearby Aurora, typically belonging to the Post-2000s (Gen Z/Alpha) group (50%), primarily speaking English or Spanish.
- Domestic travelers account for 88.3% of guests.
- Key international markets include United States (88.3%) and Australia (2.6%).
- Top languages spoken are English (70.3%) followed by Spanish (10.8%).
- A significant demographic segment is the Post-2000s (Gen Z/Alpha) group, representing 50% of guests.
Recommendations for Hosts
- Target domestic marketing efforts towards travelers from Aurora and Lehi.
- Tailor amenities and listing descriptions to appeal to the dominant Post-2000s (Gen Z/Alpha) demographic (e.g., highlight fast WiFi, smart home features, local guides).
- Highlight unique local experiences or amenities relevant to the primary guest profile.
- Consider seasonal promotions aligned with peak travel times for key origin markets.
Nearby Short-Term Rental Market Comparison
How does the Waianae Airbnb market stack up against its neighbors? Compare key performance metrics like average monthly revenue, ADR, and occupancy rates in surrounding areas to understand the broader regional STR landscape.
| Market | Active Properties | Monthly Revenue | Daily Rate | Avg. Occupancy |
|---|---|---|---|---|
| Haena | 12 | $14,312 | $1130.41 | 51% |
| Anahola | 22 | $13,673 | $845.34 | 54% |
| Mākaha Valley | 96 | $13,116 | $669.71 | 70% |
| Kahuku | 287 | $11,358 | $679.39 | 64% |
| Kilauea | 45 | $9,733 | $1064.42 | 50% |
| Kekaha | 14 | $9,595 | $545.34 | 65% |
| Koloa | 266 | $8,991 | $942.59 | 48% |
| Hanalei | 426 | $6,937 | $560.08 | 50% |
| Poipu | 1,140 | $6,673 | $596.99 | 48% |
| Kapolei | 520 | $6,393 | $688.27 | 44% |