Lee County Airbnb Market Analysis 2026: Short Term Rental Data & Vacation Rental Statistics in Kentucky, United States
Is Airbnb profitable in Lee County in 2026? Explore comprehensive Airbnb analytics for Lee County, Kentucky, United States to uncover income potential. This 2026 STR market report for Lee County, based on AirROI data from February 2025 to January 2026, reveals key trends in the niche market of 22 active listings.
Whether you're considering an Airbnb investment in Lee County, optimizing your existing vacation rental, or exploring rental arbitrage opportunities, understanding the Lee County Airbnb data is crucial. Leveraging the low regulation environment is key to maximizing your short term rental income potential. Let's dive into the specifics.
Key Lee County Airbnb Performance Metrics Overview
Monthly Airbnb Revenue Variations & Income Potential in Lee County (2026)
Understanding the monthly revenue variations for Airbnb listings in Lee County is key to maximizing your short term rental income potential. Seasonality significantly impacts earnings. Our analysis, based on data from the past 12 months, shows that the peak revenue month for STRs in Lee County is typically October, while February often presents the lowest earnings, highlighting opportunities for strategic pricing adjustments during shoulder and low seasons. Explore the typical Airbnb income in Lee County across different performance tiers:
- Best-in-class properties (Top 10%) achieve $4,637+ monthly, often utilizing dynamic pricing and superior guest experiences.
- Strong performing properties (Top 25%) earn $3,342 or more, indicating effective management and desirable locations/amenities.
- Typical properties (Median) generate around $2,364 per month, representing the average market performance.
- Entry-level properties (Bottom 25%) see earnings around $1,413, often with potential for optimization.
Average Monthly Airbnb Earnings Trend in Lee County
Lee County Airbnb Occupancy Rate Trends (2026)
Maximize your bookings by understanding the Lee County STR occupancy trends. Seasonal demand shifts significantly influence how often properties are booked. Typically, Octobersees the highest demand (peak season occupancy), while January experiences the lowest (low season). Effective strategies, like adjusting minimum stays or offering promotions, can boost occupancy during slower periods. Here's how different property tiers perform in Lee County:
- Best-in-class properties (Top 10%) achieve 64%+ occupancy, indicating high desirability and potentially optimized availability.
- Strong performing properties (Top 25%) maintain 52% or higher occupancy, suggesting good market fit and guest satisfaction.
- Typical properties (Median) have an occupancy rate around 33%.
- Entry-level properties (Bottom 25%) average 21% occupancy, potentially facing higher vacancy.
Average Monthly Occupancy Rate Trend in Lee County
Average Daily Rate (ADR) Airbnb Trends in Lee County (2026)
Effective short term rental pricing strategy in Lee County involves understanding monthly ADR fluctuations. The Average Daily Rate (ADR) for Airbnb in Lee County typically peaks in October and dips lowest during February. Leveraging Airbnb dynamic pricing tools or strategies based on this seasonality can significantly boost revenue. Here's a look at the typical nightly rates achieved:
- Best-in-class properties (Top 10%) command rates of $363+ per night, often due to premium features or locations.
- Strong performing properties (Top 25%) achieve nightly rates of $275 or more.
- Typical properties (Median) charge around $216 per night.
- Entry-level properties (Bottom 25%) earn around $161 per night.
Average Daily Rate (ADR) Trend by Month in Lee County
Get Live Lee County Market Intelligence 👇
Explore Real-time Analytics
Airbnb Seasonality Analysis & Trends in Lee County (2026)
Peak Season (October, November, June)
- Revenue averages $3,439 per month
- Occupancy rates average 44.4%
- Daily rates average $244
Shoulder Season
- Revenue averages $2,473 per month
- Occupancy maintains around 37.3%
- Daily rates hold near $228
Low Season (January, February, December)
- Revenue drops to average $1,935 per month
- Occupancy decreases to average 30.3%
- Daily rates adjust to average $222
Seasonality Insights for Lee County
- The Airbnb seasonality in Lee County shows highly seasonal trends requiring careful strategy. While the sections above show seasonal averages, it's also insightful to look at the extremes:
- During the high season, the absolute peak month showcases Lee County's highest earning potential, with monthly revenues capable of climbing to $4,174, occupancy reaching a high of 54.5%, and ADRs peaking at $252.
- Conversely, the slowest single month of the year, typically falling within the low season, marks the market's lowest point. In this month, revenue might dip to $1,687, occupancy could drop to 25.6%, and ADRs may adjust down to $202.
- Understanding both the seasonal averages and these monthly peaks and troughs in revenue, occupancy, and ADR is crucial for maximizing your Airbnb profit potential in Lee County.
Seasonal Strategies for Maximizing Profit
- Peak Season: Maximize revenue through premium pricing and potentially longer minimum stays. Ensure high availability.
- Low Season: Offer competitive pricing, special promotions (e.g., extended stay discounts), and flexible cancellation policies. Target off-season travelers like remote workers or budget-conscious guests.
- Shoulder Seasons: Implement dynamic pricing that balances peak and low rates. Target weekend travelers or specific events. Offer slightly more flexible terms than peak season.
- Regularly analyze your own performance against these Lee County seasonality benchmarks and adjust your pricing and availability strategy accordingly.
Best Areas for Airbnb Investment in Lee County (2026)
Exploring the top neighborhoods for short-term rentals in Lee County? This section highlights key areas, outlining why they are attractive for hosts and guests, along with notable local attractions. Consider these locations based on your target guest profile and investment strategy.
| Neighborhood / Area | Why Host Here? (Target Guests & Appeal) | Key Attractions & Landmarks |
|---|---|---|
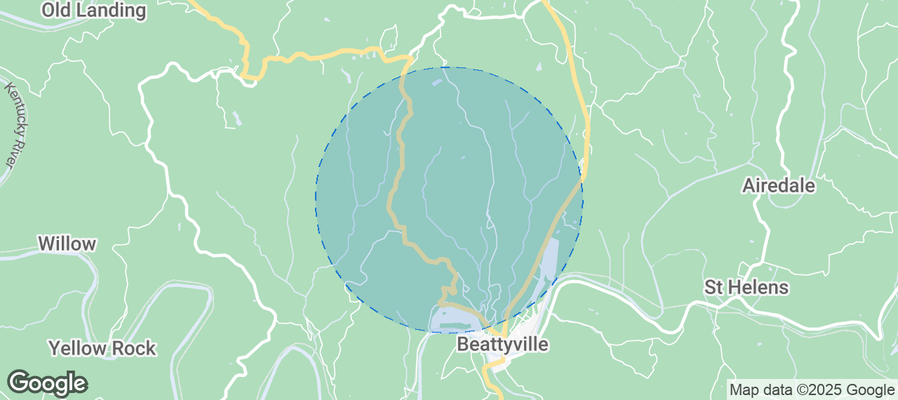
| Beattyville | Small town charm with access to outdoor adventures in the Daniel Boone National Forest. It's appealing for tourists looking for a quiet getaway with nature activities like hiking and fishing. | Daniel Boone National Forest, Red River Gorge, Cane Creek State Park, Lee County Historical Society, Lost Falls |
| Wooton | A serene location with proximity to natural attractions, ideal for leisure travelers and families looking for a peaceful retreat. | Pine Ridge Trail, Cumberland Falls State Resort Park, Local fishing spots, Hiking trails, Picnic areas by the river |
| Jackson | A nearby city offering a blend of outdoor activities and local culture. Attracts visitors interested in the natural beauty and local festivals. | Breathitt County Courthouse, Jenkins Park, River Park, Local art galleries, Annual Country Music Festival |
| Bourbon County Wine Trail | An emerging tourist destination featuring local vineyards and wineries. Perfect for wine enthusiasts and those looking to explore local flavors. | Wineries, Wine festivals, Scenic countryside, Local farms, Food and wine pairing events |
| Frankfort | The state capital offers cultural attractions and government tourism. Ideal for business travelers and history buffs. | Kentucky State Capitol, Museum of Kentucky History, Daniel Boone's gravesite, Local dining options, Historical tours |
| Red River Gorge | A renowned destination for rock climbing and outdoor tourism, appealing to adventure seekers and nature lovers. | Natural Bridge State Park, Sky Bridge, Hiking trails, Camping sites, Scenic overlooks |
| Owingsville | A small, welcoming town that appeals to visitors looking for local history and community events. | Owingsville Water Park, Historic downtown, Local markets, Community festivals, Nearby state parks |
| Morehead | Home to Morehead State University, it attracts both students and visitors interested in academic programs and local events. | Morehead State University, Carter Caves State Resort Park, Local museums, Historic sites, Outdoor recreational areas |
Understanding Airbnb License Requirements & STR Laws in Lee County (2026)
While Lee County, Kentucky, United States currently shows low STR regulations, specific Airbnb license requirements might still exist or change. Always verify the latest short term rental regulations and Airbnb license requirements directly with local government authorities for Lee County to ensure full compliance before hosting.
(Source: AirROI data, 2026, finding no licensed listings among those analyzed)
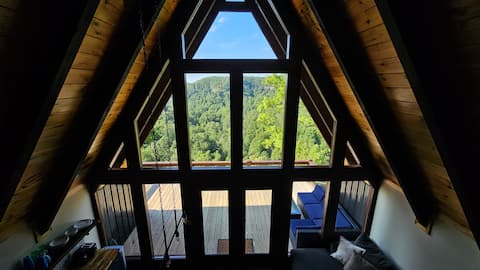
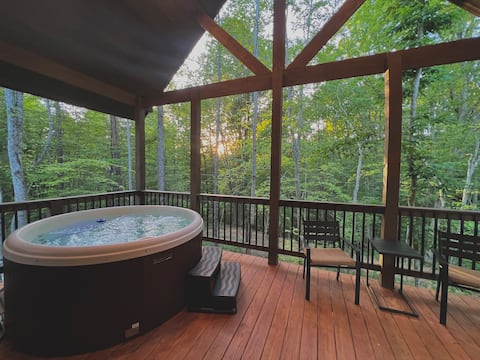
Top Performing Airbnb Properties in Lee County (2026)
Benchmark your potential! Explore examples of top-performing Airbnb properties in Lee Countybased on Trailing Twelve Month (TTM) revenue. Analyze their characteristics, revenue, occupancy rate, and ADR to understand what drives success in this market.
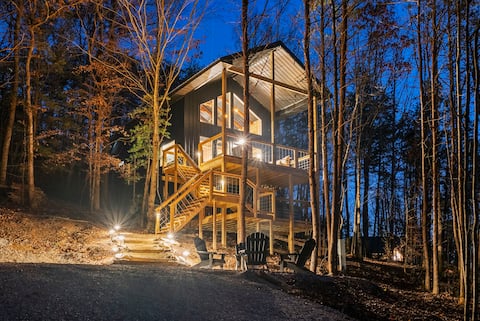
The Maverick | RRG | Hot Tub
Entire Place • 2 bedrooms
Romper Ridge
Entire Place • 2 bedrooms
Timber Pines at Red River Gorge
Entire Place • 1 bedroom
Camelot
Entire Place • 2 bedrooms

The Lazy Maple in RRG - Hot tub/Fire pit/Arcade
Entire Place • 2 bedrooms
Camp Moose- Red River Gorge
Entire Place • 4 bedrooms
Note: Performance varies based on location, size, amenities, seasonality, and management quality. Data reflects the past 12 months.
Top Performing Airbnb Hosts in Lee County (2026)
Learn from the best! This table showcases top-performing Airbnb hosts in Lee County based on the number of properties managed and estimated total revenue over the past year. Analyze their scale and performance metrics.
| Host Name | Properties | Grossing Revenue | Stay Reviews | Avg Rating |
|---|---|---|---|---|
| Kyle | 2 | $81,451 | 306 | 4.91/5.0 |
| Ian | 3 | $78,219 | 26 | 4.94/5.0 |
| Cassidy | 2 | $77,364 | 121 | 4.95/5.0 |
| Nancy | 2 | $71,694 | 86 | 4.70/5.0 |
| Jess | 1 | $65,612 | 56 | 5.00/5.0 |
| Janice | 2 | $49,089 | 62 | 4.96/5.0 |
| David | 1 | $35,636 | 89 | 4.99/5.0 |
| Beverly | 2 | $34,460 | 83 | 4.94/5.0 |
| Greg | 2 | $30,288 | 19 | 4.88/5.0 |
| Tristan | 1 | $17,548 | 31 | 4.71/5.0 |
Analyzing the strategies of top hosts, such as their property selection, pricing, and guest communication, can offer valuable lessons for optimizing your own Airbnb operations in Lee County.
Dive Deeper: Advanced Lee County STR Market Data (2026)
Ready to unlock more insights? AirROI provides access to advanced metrics and comprehensive Airbnb data for Lee County. Explore detailed analytics beyond this report to refine your investment strategy, optimize pricing, and maximize your vacation rental profits.
Explore Advanced MetricsLee County Short-Term Rental Market Composition (2026): Property & Room Types
Room Type Distribution
Property Type Distribution
Market Composition Insights for Lee County
- The Lee County Airbnb market composition is heavily skewed towards Entire Home/Apt listings, which make up 100% of the 22 active rentals. This indicates strong guest preference for privacy and space.
- Looking at the property type distribution in Lee County, Outdoor/Unique properties are the most common (90.9%), reflecting the local real estate landscape.
Lee County Airbnb Room Capacity Analysis (2026): Bedroom Distribution
Distribution of Listings by Number of Bedrooms
Room Capacity Insights for Lee County
- The dominant room capacity in Lee County is 2 bedrooms listings, making up 45.5% of the market. This suggests a strong demand for properties suitable for couples or solo travelers.
- Together, 2 bedrooms and 1 bedroom properties represent 72.8% of the active Airbnb listings in Lee County, indicating a high concentration in these sizes.
- A significant 27.3% of listings offer 3+ bedrooms, catering to larger groups and families seeking more space in Lee County.
Lee County Vacation Rental Guest Capacity Trends (2026)
Distribution of Listings by Guest Capacity
Guest Capacity Insights for Lee County
- The most common guest capacity trend in Lee County vacation rentals is listings accommodating 8+ guests (40.9%). This suggests the primary traveler segment is likely larger groups.
- Properties designed for 8+ guests and 4 guests dominate the Lee County STR market, accounting for 63.6% of listings.
- 54.5% of properties accommodate 6+ guests, serving the market segment for larger families or group travel in Lee County.
- On average, properties in Lee County are equipped to host 5.8 guests.
Lee County Airbnb Booking Patterns (2026): Available vs. Booked Days
Available Days Distribution
Booked Days Distribution
Booking Pattern Insights for Lee County
- The most common availability pattern in Lee County falls within the 271-366 days range, representing 45.5% of listings. This suggests many properties have significant open periods on their calendars.
- Approximately 81.9% of listings show high availability (181+ days open annually), indicating potential for increased bookings or specific owner usage patterns.
- For booked days, the 91-180 days range is most frequent in Lee County (45.5%), reflecting common guest stay durations or potential owner blocking patterns.
- A notable 18.2% of properties secure long booking periods (181+ days booked per year), highlighting successful long-term rental strategies or significant owner usage.
Lee County Airbnb Minimum Stay Requirements Analysis
Distribution of Listings by Minimum Night Requirement
2 Nights
14 listings
63.6% of total
30+ Nights
8 listings
36.4% of total
Key Insights
- The most prevalent minimum stay requirement in Lee County is 2 Nights, adopted by 63.6% of listings. This highlights the market's preference for shorter, flexible bookings.
- A strong majority (63.6%) of the Lee County Airbnb data shows acceptance of very short stays (1-2 nights), indicating a dynamic, high-turnover market.
- A significant segment (36.4%) caters to monthly stays (30+ nights) in Lee County, pointing to opportunities in the extended-stay market.
Recommendations
- Align with the market by considering a 2 Nights minimum stay, as 63.6% of Lee County hosts use this setting.
- A 2-night minimum appears standard (63.6%). Consider this for weekends or peak periods.
- Explore offering discounts for stays of 30+ nights to attract the 36.4% of the market seeking extended stays.
- Adjust minimum nights based on seasonality – potentially shorter during low season and longer during peak demand periods in Lee County.
Lee County Airbnb Cancellation Policy Trends Analysis (2026)
Flexible
1 listings
4.5% of total
Moderate
4 listings
18.2% of total
Firm
17 listings
77.3% of total
Cancellation Policy Insights for Lee County
- The prevailing Airbnb cancellation policy trend in Lee County is Firm, used by 77.3% of listings.
- A majority (77.3%) of hosts in Lee County utilize Firm or Strict policies, indicating a market where hosts prioritize booking security.
Recommendations for Hosts
- Consider adopting a Firm policy to align with the 77.3% market standard in Lee County.
- Regularly review your cancellation policy against competitors and market demand shifts in Lee County.
Lee County STR Booking Lead Time Analysis (2026)
Average Booking Lead Time by Month
Booking Lead Time Insights for Lee County
- The overall average booking lead time for vacation rentals in Lee County is 45 days.
- Guests book furthest in advance for stays during October (average 63 days), likely coinciding with peak travel demand or local events.
- The shortest booking windows occur for stays in February (average 26 days), indicating more last-minute travel plans during this time.
- Seasonally, Fall (57 days avg.) sees the longest lead times, while Winter (32 days avg.) has the shortest, reflecting typical travel planning cycles.
Recommendations for Hosts
- Use the overall average lead time (45 days) as a baseline for your pricing and availability strategy in Lee County.
- For October stays, consider implementing length-of-stay discounts or slightly higher rates for bookings made less than 63 days out to capitalize on advance planning.
- Target marketing efforts for the Fall season well in advance (at least 57 days) to capture early planners.
- Monitor your own booking lead times against these Lee County averages to identify opportunities for dynamic pricing adjustments.
Popular & Essential Airbnb Amenities in Lee County (2026)
Amenity Prevalence
Amenity Insights for Lee County
- Essential amenities in Lee County that guests expect include: Kitchen, Smoke alarm, Wifi, Refrigerator, Heating, Free parking on premises, Air conditioning. Lacking these (any) could significantly impact bookings.
- Popular amenities like Coffee maker, Fire pit, Cooking basics are common but not universal. Offering these can provide a competitive edge.
Recommendations for Hosts
- Ensure your listing includes all essential amenities for Lee County: Kitchen, Smoke alarm, Wifi, Refrigerator, Heating, Free parking on premises, Air conditioning.
- Prioritize adding missing essentials: Wifi, Refrigerator, Heating, Free parking on premises, Air conditioning.
- Consider adding popular differentiators like Coffee maker or Fire pit to increase appeal.
- Highlight unique or less common amenities you offer (e.g., hot tub, dedicated workspace, EV charger) in your listing description and photos.
- Regularly check competitor amenities in Lee County to stay competitive.
Lee County Airbnb Guest Demographics & Profile Analysis (2026)
Guest Profile Summary for Lee County
- The typical guest profile for Airbnb in Lee County consists of primarily domestic travelers (98%), often arriving from nearby Louisville, typically belonging to the Post-2000s (Gen Z/Alpha) group (50%), primarily speaking English or Spanish.
- Domestic travelers account for 98.1% of guests.
- Key international markets include United States (98.1%) and Canada (0.9%).
- Top languages spoken are English (87.7%) followed by Spanish (4.1%).
- A significant demographic segment is the Post-2000s (Gen Z/Alpha) group, representing 50% of guests.
Recommendations for Hosts
- Target domestic marketing efforts towards travelers from Louisville and Cincinnati.
- Tailor amenities and listing descriptions to appeal to the dominant Post-2000s (Gen Z/Alpha) demographic (e.g., highlight fast WiFi, smart home features, local guides).
- Highlight unique local experiences or amenities relevant to the primary guest profile.
- Consider seasonal promotions aligned with peak travel times for key origin markets.
Nearby Short-Term Rental Market Comparison
How does the Lee County Airbnb market stack up against its neighbors? Compare key performance metrics like average monthly revenue, ADR, and occupancy rates in surrounding areas to understand the broader regional STR landscape.
| Market | Active Properties | Monthly Revenue | Daily Rate | Avg. Occupancy |
|---|---|---|---|---|
| Lawrenceburg | 65 | $4,477 | $360.32 | 45% |
| Crittenden | 18 | $3,944 | $261.97 | 48% |
| Strawberry Plains | 13 | $3,880 | $222.81 | 54% |
| Walton | 22 | $3,840 | $225.35 | 58% |
| Williamstown | 204 | $3,674 | $263.96 | 49% |
| Rogers | 115 | $3,484 | $255.43 | 45% |
| Caryville | 17 | $3,478 | $410.81 | 34% |
| Corinth | 17 | $3,457 | $270.49 | 48% |
| Versailles | 61 | $3,375 | $350.32 | 44% |
| LaFollette | 157 | $3,289 | $476.63 | 32% |