Clawson Airbnb Market Analysis 2026: Short Term Rental Data & Vacation Rental Statistics in Michigan, United States
Is Airbnb profitable in Clawson in 2026? Explore comprehensive Airbnb analytics for Clawson, Michigan, United States to uncover income potential. This 2026 STR market report for Clawson, based on AirROI data from January 2025 to December 2025, reveals key trends in the niche market of 19 active listings.
Whether you're considering an Airbnb investment in Clawson, optimizing your existing vacation rental, or exploring rental arbitrage opportunities, understanding the Clawson Airbnb data is crucial. Leveraging the low regulation environment is key to maximizing your short term rental income potential. Let's dive into the specifics.
Key Clawson Airbnb Performance Metrics Overview
Monthly Airbnb Revenue Variations & Income Potential in Clawson (2026)
Understanding the monthly revenue variations for Airbnb listings in Clawson is key to maximizing your short term rental income potential. Seasonality significantly impacts earnings. Our analysis, based on data from the past 12 months, shows that the peak revenue month for STRs in Clawson is typically July, while March often presents the lowest earnings, highlighting opportunities for strategic pricing adjustments during shoulder and low seasons. Explore the typical Airbnb income in Clawson across different performance tiers:
- Best-in-class properties (Top 10%) achieve $5,970+ monthly, often utilizing dynamic pricing and superior guest experiences.
- Strong performing properties (Top 25%) earn $4,979 or more, indicating effective management and desirable locations/amenities.
- Typical properties (Median) generate around $3,339 per month, representing the average market performance.
- Entry-level properties (Bottom 25%) see earnings around $1,971, often with potential for optimization.
Average Monthly Airbnb Earnings Trend in Clawson
Clawson Airbnb Occupancy Rate Trends (2026)
Maximize your bookings by understanding the Clawson STR occupancy trends. Seasonal demand shifts significantly influence how often properties are booked. Typically, Junesees the highest demand (peak season occupancy), while January experiences the lowest (low season). Effective strategies, like adjusting minimum stays or offering promotions, can boost occupancy during slower periods. Here's how different property tiers perform in Clawson:
- Best-in-class properties (Top 10%) achieve 82%+ occupancy, indicating high desirability and potentially optimized availability.
- Strong performing properties (Top 25%) maintain 73% or higher occupancy, suggesting good market fit and guest satisfaction.
- Typical properties (Median) have an occupancy rate around 57%.
- Entry-level properties (Bottom 25%) average 37% occupancy, potentially facing higher vacancy.
Average Monthly Occupancy Rate Trend in Clawson
Average Daily Rate (ADR) Airbnb Trends in Clawson (2026)
Effective short term rental pricing strategy in Clawson involves understanding monthly ADR fluctuations. The Average Daily Rate (ADR) for Airbnb in Clawson typically peaks in December and dips lowest during March. Leveraging Airbnb dynamic pricing tools or strategies based on this seasonality can significantly boost revenue. Here's a look at the typical nightly rates achieved:
- Best-in-class properties (Top 10%) command rates of $267+ per night, often due to premium features or locations.
- Strong performing properties (Top 25%) achieve nightly rates of $212 or more.
- Typical properties (Median) charge around $152 per night.
- Entry-level properties (Bottom 25%) earn around $82 per night.
Average Daily Rate (ADR) Trend by Month in Clawson
Get Live Clawson Market Intelligence 👇
Explore Real-time Analytics
Airbnb Seasonality Analysis & Trends in Clawson (2025)
Peak Season (July, June, December)
- Revenue averages $4,341 per month
- Occupancy rates average 60.9%
- Daily rates average $177
Shoulder Season
- Revenue averages $3,523 per month
- Occupancy maintains around 54.1%
- Daily rates hold near $164
Low Season (January, March, April)
- Revenue drops to average $2,881 per month
- Occupancy decreases to average 54.3%
- Daily rates adjust to average $133
Seasonality Insights for Clawson
- The Airbnb seasonality in Clawson shows moderate seasonality with distinct peak and low periods. While the sections above show seasonal averages, it's also insightful to look at the extremes:
- During the high season, the absolute peak month showcases Clawson's highest earning potential, with monthly revenues capable of climbing to $4,755, occupancy reaching a high of 64.9%, and ADRs peaking at $184.
- Conversely, the slowest single month of the year, typically falling within the low season, marks the market's lowest point. In this month, revenue might dip to $2,815, occupancy could drop to 46.0%, and ADRs may adjust down to $131.
- Understanding both the seasonal averages and these monthly peaks and troughs in revenue, occupancy, and ADR is crucial for maximizing your Airbnb profit potential in Clawson.
Seasonal Strategies for Maximizing Profit
- Peak Season: Maximize revenue through premium pricing and potentially longer minimum stays. Ensure high availability.
- Low Season: Offer competitive pricing, special promotions (e.g., extended stay discounts), and flexible cancellation policies. Target off-season travelers like remote workers or budget-conscious guests.
- Shoulder Seasons: Implement dynamic pricing that balances peak and low rates. Target weekend travelers or specific events. Offer slightly more flexible terms than peak season.
- Regularly analyze your own performance against these Clawson seasonality benchmarks and adjust your pricing and availability strategy accordingly.
Best Areas for Airbnb Investment in Clawson (2026)
Exploring the top neighborhoods for short-term rentals in Clawson? This section highlights key areas, outlining why they are attractive for hosts and guests, along with notable local attractions. Consider these locations based on your target guest profile and investment strategy.
| Neighborhood / Area | Why Host Here? (Target Guests & Appeal) | Key Attractions & Landmarks |
|---|---|---|
| Clawson City Center | The heart of Clawson, featuring a charming downtown area with local shops, restaurants, and easy access to community events. Ideal for guests wanting to experience the local culture and amenities. | Clawson City Park, Local Shops and Cafes, Annual Clawson Chili Cookoff, Clawson Historical Museum |
| Clawson Parks | Neighborhoods surrounding Clawson's parks appeal to families and outdoor enthusiasts. Offering a peaceful suburban experience with proximity to recreational activities. | Clawson Park, Baldwin Park, Neighborhood Walking Trails |
| Clawson Schools District | Areas near highly rated schools attract families and those looking for a community feel. A great choice for long-term rentals and family visitors. | Clawson High School, Clawson Middle School, Community Sports Facilities |
| Lahser Road Corridor | A busy thoroughfare providing easy access to local businesses and dining options. Attractive for travelers needing conveniences and quick transport. | Nearby Shopping Centers, Restaurants, Popular Coffee Shops |
| Local Breweries | Clawson is home to several microbreweries that draw both locals and tourists. Ideal for guests looking for a vibrant drink scene and social atmosphere. | Clawson Brewery, Craft Beer Events, Brewery Tours |
| Birmingham Nearby | Just a short drive or public transit away from Birmingham, offering upscale amenities and attractions. Appeals to guests seeking a more luxurious experience with cultural events. | Birmingham Shopping District, Parks and Recreational Areas, Art Galleries |
| Royal Oak Association | The close proximity to Royal Oak enhances rental opportunities, appealing to guests interested in nightlife and dining. Ideal for younger travelers. | Royal Oak Music Theatre, Dining Hotspots, The Detroit Zoo |
| Cultural and Historical Sites | Clawson's historical sites attract tourists interested in cultural enrichment. Ideal for weekend travelers and history buffs. | Local Historical Sites, Cultural Events, Art and Music Festivals |
Understanding Airbnb License Requirements & STR Laws in Clawson (2026)
While Clawson, Michigan, United States currently shows low STR regulations, specific Airbnb license requirements might still exist or change. Always verify the latest short term rental regulations and Airbnb license requirements directly with local government authorities for Clawson to ensure full compliance before hosting.
(Source: AirROI data, 2026, finding no licensed listings among those analyzed)
Top Performing Airbnb Properties in Clawson (2026)
Benchmark your potential! Explore examples of top-performing Airbnb properties in Clawsonbased on Trailing Twelve Month (TTM) revenue. Analyze their characteristics, revenue, occupancy rate, and ADR to understand what drives success in this market.
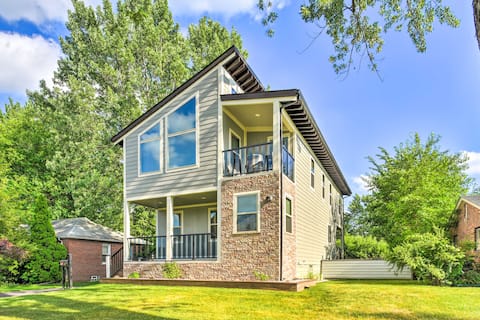
Sunny Clawson Home w/ Yard - Walk to Main St!
Entire Place • 4 bedrooms
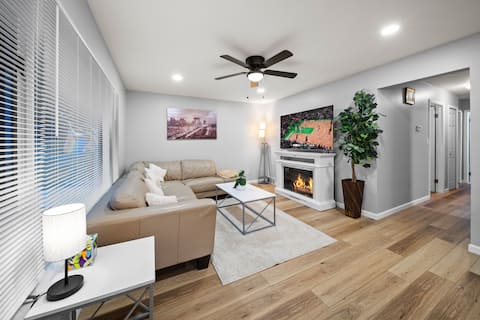
4-BR Family Getaway – Free Parking & WiFi
Entire Place • 4 bedrooms
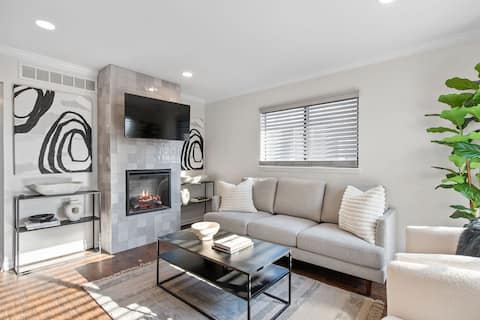
Stylish 4 BD/2 BA Home Near *Royal Oak* Birmingham
Entire Place • 4 bedrooms

Gorgeous Comfy Downtown Clawson Home
Entire Place • 3 bedrooms
Cozy & Updated Gem Near DT Clawson
Entire Place • 3 bedrooms

Cute Downtown Clawson 2BR
Entire Place • 2 bedrooms
Note: Performance varies based on location, size, amenities, seasonality, and management quality. Data reflects the past 12 months.
Top Performing Airbnb Hosts in Clawson (2026)
Learn from the best! This table showcases top-performing Airbnb hosts in Clawson based on the number of properties managed and estimated total revenue over the past year. Analyze their scale and performance metrics.
| Host Name | Properties | Grossing Revenue | Stay Reviews | Avg Rating |
|---|---|---|---|---|
| Evolve | 1 | $71,529 | 107 | 4.93/5.0 |
| Jesse | 1 | $55,083 | 55 | 4.62/5.0 |
| Samantha | 1 | $54,890 | 120 | 4.87/5.0 |
| Matthew | 1 | $54,306 | 79 | 4.96/5.0 |
| Nicole | 1 | $51,355 | 30 | 4.90/5.0 |
| Jessica | 1 | $35,609 | 63 | 5.00/5.0 |
| Nicole | 1 | $32,147 | 25 | 4.96/5.0 |
| Moza | 1 | $27,540 | 20 | 5.00/5.0 |
| Andrea | 1 | $27,276 | 30 | 4.93/5.0 |
| Brent | 1 | $26,434 | 80 | 4.99/5.0 |
Analyzing the strategies of top hosts, such as their property selection, pricing, and guest communication, can offer valuable lessons for optimizing your own Airbnb operations in Clawson.
Dive Deeper: Advanced Clawson STR Market Data (2026)
Ready to unlock more insights? AirROI provides access to advanced metrics and comprehensive Airbnb data for Clawson. Explore detailed analytics beyond this report to refine your investment strategy, optimize pricing, and maximize your vacation rental profits.
Explore Advanced MetricsClawson Short-Term Rental Market Composition (2026): Property & Room Types
Room Type Distribution
Property Type Distribution
Market Composition Insights for Clawson
- The Clawson Airbnb market composition is heavily skewed towards Entire Home/Apt listings, which make up 78.9% of the 19 active rentals. This indicates strong guest preference for privacy and space.
- Looking at the property type distribution in Clawson, House properties are the most common (94.7%), reflecting the local real estate landscape.
- Houses represent a significant 94.7% portion, catering likely to families or larger groups.
Clawson Airbnb Room Capacity Analysis (2026): Bedroom Distribution
Distribution of Listings by Number of Bedrooms
Room Capacity Insights for Clawson
- The dominant room capacity in Clawson is 3 bedrooms listings, making up 21.1% of the market. This suggests a strong demand for properties suitable for families or small groups.
- Together, 3 bedrooms and 4 bedrooms properties represent 42.2% of the active Airbnb listings in Clawson, indicating a high concentration in these sizes.
- A significant 47.5% of listings offer 3+ bedrooms, catering to larger groups and families seeking more space in Clawson.
Clawson Vacation Rental Guest Capacity Trends (2026)
Distribution of Listings by Guest Capacity
Guest Capacity Insights for Clawson
- The most common guest capacity trend in Clawson vacation rentals is listings accommodating 8+ guests (31.6%). This suggests the primary traveler segment is likely larger groups.
- Properties designed for 8+ guests and 4 guests dominate the Clawson STR market, accounting for 52.7% of listings.
- 52.7% of properties accommodate 6+ guests, serving the market segment for larger families or group travel in Clawson.
- On average, properties in Clawson are equipped to host 4.7 guests.
Clawson Airbnb Booking Patterns (2026): Available vs. Booked Days
Available Days Distribution
Booked Days Distribution
Booking Pattern Insights for Clawson
- The most common availability pattern in Clawson falls within the 91-180 days range, representing 31.6% of listings. This suggests many properties have significant open periods on their calendars.
- Approximately 63.2% of listings show high availability (181+ days open annually), indicating potential for increased bookings or specific owner usage patterns.
- For booked days, the 181-270 days range is most frequent in Clawson (36.8%), reflecting common guest stay durations or potential owner blocking patterns.
- A notable 42.1% of properties secure long booking periods (181+ days booked per year), highlighting successful long-term rental strategies or significant owner usage.
Clawson Airbnb Minimum Stay Requirements Analysis
Distribution of Listings by Minimum Night Requirement
1 Night
5 listings
26.3% of total
2 Nights
7 listings
36.8% of total
4-6 Nights
2 listings
10.5% of total
7-29 Nights
3 listings
15.8% of total
30+ Nights
2 listings
10.5% of total
Key Insights
- The most prevalent minimum stay requirement in Clawson is 2 Nights, adopted by 36.8% of listings. This highlights the market's preference for shorter, flexible bookings.
- A strong majority (63.1%) of the Clawson Airbnb data shows acceptance of very short stays (1-2 nights), indicating a dynamic, high-turnover market.
- A significant segment (10.5%) caters to monthly stays (30+ nights) in Clawson, pointing to opportunities in the extended-stay market.
Recommendations
- Align with the market by considering a 2 Nights minimum stay, as 36.8% of Clawson hosts use this setting.
- If feasible, allowing 1-night stays, especially midweek or during low season, could capture last-minute bookings, as only 26.3% currently do.
- Explore offering discounts for stays of 30+ nights to attract the 10.5% of the market seeking extended stays.
- Adjust minimum nights based on seasonality – potentially shorter during low season and longer during peak demand periods in Clawson.
Clawson Airbnb Cancellation Policy Trends Analysis (2026)
Super Strict 30 Days
3 listings
15.8% of total
Flexible
6 listings
31.6% of total
Moderate
5 listings
26.3% of total
Firm
3 listings
15.8% of total
Strict
2 listings
10.5% of total
Cancellation Policy Insights for Clawson
- The prevailing Airbnb cancellation policy trend in Clawson is Flexible, used by 31.6% of listings.
- There's a relatively balanced mix between guest-friendly (57.9%) and stricter (26.3%) policies, offering choices for different guest needs.
Recommendations for Hosts
- Consider adopting a Flexible policy to align with the 31.6% market standard in Clawson.
- Using a Strict policy might deter some guests, as only 10.5% of listings use it. Evaluate if potential revenue protection outweighs possible lower booking rates.
- Regularly review your cancellation policy against competitors and market demand shifts in Clawson.
Clawson STR Booking Lead Time Analysis (2026)
Average Booking Lead Time by Month
Booking Lead Time Insights for Clawson
- The overall average booking lead time for vacation rentals in Clawson is 32 days.
- Guests book furthest in advance for stays during July (average 56 days), likely coinciding with peak travel demand or local events.
- The shortest booking windows occur for stays in February (average 15 days), indicating more last-minute travel plans during this time.
- Seasonally, Summer (37 days avg.) sees the longest lead times, while Fall (25 days avg.) has the shortest, reflecting typical travel planning cycles.
Recommendations for Hosts
- Use the overall average lead time (32 days) as a baseline for your pricing and availability strategy in Clawson.
- For July stays, consider implementing length-of-stay discounts or slightly higher rates for bookings made less than 56 days out to capitalize on advance planning.
- Target marketing efforts for the Summer season well in advance (at least 37 days) to capture early planners.
- Monitor your own booking lead times against these Clawson averages to identify opportunities for dynamic pricing adjustments.
Popular & Essential Airbnb Amenities in Clawson (2026)
Amenity Prevalence
Amenity Insights for Clawson
- Essential amenities in Clawson that guests expect include: Kitchen, Air conditioning, Wifi, Smoke alarm, Free parking on premises. Lacking these (any) could significantly impact bookings.
- Popular amenities like Heating, Carbon monoxide alarm, Shampoo are common but not universal. Offering these can provide a competitive edge.
Recommendations for Hosts
- Ensure your listing includes all essential amenities for Clawson: Kitchen, Air conditioning, Wifi, Smoke alarm, Free parking on premises.
- Consider adding popular differentiators like Heating or Carbon monoxide alarm to increase appeal.
- Highlight unique or less common amenities you offer (e.g., hot tub, dedicated workspace, EV charger) in your listing description and photos.
- Regularly check competitor amenities in Clawson to stay competitive.
Clawson Airbnb Guest Demographics & Profile Analysis (2026)
Guest Profile Summary for Clawson
- The typical guest profile for Airbnb in Clawson consists of primarily domestic travelers (96%), often arriving from nearby Chicago, typically belonging to the Post-2000s (Gen Z/Alpha) group (50%), primarily speaking English or Spanish.
- Domestic travelers account for 95.7% of guests.
- Key international markets include United States (95.7%) and Canada (1.6%).
- Top languages spoken are English (69.5%) followed by Spanish (11.6%).
- A significant demographic segment is the Post-2000s (Gen Z/Alpha) group, representing 50% of guests.
Recommendations for Hosts
- Target domestic marketing efforts towards travelers from Chicago and Columbus.
- Tailor amenities and listing descriptions to appeal to the dominant Post-2000s (Gen Z/Alpha) demographic (e.g., highlight fast WiFi, smart home features, local guides).
- Highlight unique local experiences or amenities relevant to the primary guest profile.
- Consider seasonal promotions aligned with peak travel times for key origin markets.
Nearby Short-Term Rental Market Comparison
How does the Clawson Airbnb market stack up against its neighbors? Compare key performance metrics like average monthly revenue, ADR, and occupancy rates in surrounding areas to understand the broader regional STR landscape.
| Market | Active Properties | Monthly Revenue | Daily Rate | Avg. Occupancy |
|---|---|---|---|---|
| Forester | 12 | $5,284 | $414.30 | 39% |
| Huron Township | 17 | $5,002 | $477.56 | 39% |
| City of Frankenmuth | 31 | $4,881 | $322.01 | 51% |
| Port Sanilac | 32 | $4,816 | $491.47 | 37% |
| Scio Township | 20 | $4,545 | $723.97 | 39% |
| Grass Lake Charter Township | 14 | $4,407 | $360.74 | 44% |
| Ann Arbor | 490 | $4,102 | $439.66 | 43% |
| Norvell Township | 12 | $4,061 | $319.27 | 49% |
| Marblehead | 12 | $3,890 | $573.37 | 39% |
| Erie Township | 10 | $3,850 | $242.82 | 51% |