Inkster Airbnb Market Analysis 2025: Short Term Rental Data & Vacation Rental Statistics in Michigan, United States
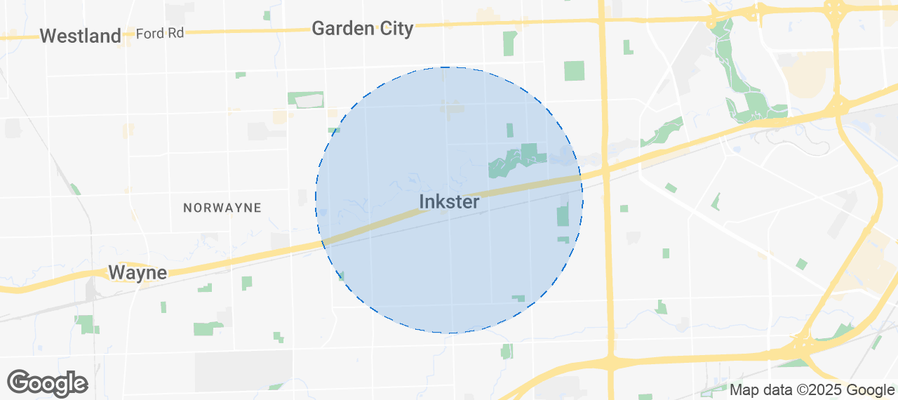
Is Airbnb profitable in Inkster in 2025? Explore comprehensive Airbnb analytics for Inkster, Michigan, United States to uncover income potential. This 2025 STR market report for Inkster, based on AirROI data from September 2024 to August 2025, reveals key trends in the niche market of 18 active listings.
Whether you're considering an Airbnb investment in Inkster, optimizing your existing vacation rental, or exploring rental arbitrage opportunities, understanding the Inkster Airbnb data is crucial. Leveraging the low regulation environment is key to maximizing your short term rental income potential. Let's dive into the specifics.
Key Inkster Airbnb Performance Metrics Overview
Monthly Airbnb Revenue Variations & Income Potential in Inkster (2025)
Understanding the monthly revenue variations for Airbnb listings in Inkster is key to maximizing your short term rental income potential. Seasonality significantly impacts earnings. Our analysis, based on data from the past 12 months, shows that the peak revenue month for STRs in Inkster is typically July, while February often presents the lowest earnings, highlighting opportunities for strategic pricing adjustments during shoulder and low seasons. Explore the typical Airbnb income in Inkster across different performance tiers:
- Best-in-class properties (Top 10%) achieve $3,100+ monthly, often utilizing dynamic pricing and superior guest experiences.
- Strong performing properties (Top 25%) earn $2,350 or more, indicating effective management and desirable locations/amenities.
- Typical properties (Median) generate around $1,183 per month, representing the average market performance.
- Entry-level properties (Bottom 25%) see earnings around $532, often with potential for optimization.
Average Monthly Airbnb Earnings Trend in Inkster
Inkster Airbnb Occupancy Rate Trends (2025)
Maximize your bookings by understanding the Inkster STR occupancy trends. Seasonal demand shifts significantly influence how often properties are booked. Typically, Septembersees the highest demand (peak season occupancy), while February experiences the lowest (low season). Effective strategies, like adjusting minimum stays or offering promotions, can boost occupancy during slower periods. Here's how different property tiers perform in Inkster:
- Best-in-class properties (Top 10%) achieve 83%+ occupancy, indicating high desirability and potentially optimized availability.
- Strong performing properties (Top 25%) maintain 67% or higher occupancy, suggesting good market fit and guest satisfaction.
- Typical properties (Median) have an occupancy rate around 44%.
- Entry-level properties (Bottom 25%) average 23% occupancy, potentially facing higher vacancy.
Average Monthly Occupancy Rate Trend in Inkster
Average Daily Rate (ADR) Airbnb Trends in Inkster (2025)
Effective short term rental pricing strategy in Inkster involves understanding monthly ADR fluctuations. The Average Daily Rate (ADR) for Airbnb in Inkster typically peaks in July and dips lowest during April. Leveraging Airbnb dynamic pricing tools or strategies based on this seasonality can significantly boost revenue. Here's a look at the typical nightly rates achieved:
- Best-in-class properties (Top 10%) command rates of $190+ per night, often due to premium features or locations.
- Strong performing properties (Top 25%) achieve nightly rates of $141 or more.
- Typical properties (Median) charge around $101 per night.
- Entry-level properties (Bottom 25%) earn around $41 per night.
Average Daily Rate (ADR) Trend by Month in Inkster
Get Live Inkster Market Intelligence 👇
Explore Real-time Analytics
Airbnb Seasonality Analysis & Trends in Inkster (2025)
Peak Season (July, September, August)
- Revenue averages $2,273 per month
- Occupancy rates average 52.6%
- Daily rates average $118
Shoulder Season
- Revenue averages $1,551 per month
- Occupancy maintains around 50.6%
- Daily rates hold near $112
Low Season (January, February, March)
- Revenue drops to average $837 per month
- Occupancy decreases to average 36.8%
- Daily rates adjust to average $112
Seasonality Insights for Inkster
- The Airbnb seasonality in Inkster shows highly seasonal trends requiring careful strategy. While the sections above show seasonal averages, it's also insightful to look at the extremes:
- During the high season, the absolute peak month showcases Inkster's highest earning potential, with monthly revenues capable of climbing to $2,611, occupancy reaching a high of 61.3%, and ADRs peaking at $121.
- Conversely, the slowest single month of the year, typically falling within the low season, marks the market's lowest point. In this month, revenue might dip to $655, occupancy could drop to 34.4%, and ADRs may adjust down to $98.
- Understanding both the seasonal averages and these monthly peaks and troughs in revenue, occupancy, and ADR is crucial for maximizing your Airbnb profit potential in Inkster.
Seasonal Strategies for Maximizing Profit
- Peak Season: Maximize revenue through premium pricing and potentially longer minimum stays. Ensure high availability.
- Low Season: Offer competitive pricing, special promotions (e.g., extended stay discounts), and flexible cancellation policies. Target off-season travelers like remote workers or budget-conscious guests.
- Shoulder Seasons: Implement dynamic pricing that balances peak and low rates. Target weekend travelers or specific events. Offer slightly more flexible terms than peak season.
- Regularly analyze your own performance against these Inkster seasonality benchmarks and adjust your pricing and availability strategy accordingly.
Best Areas for Airbnb Investment in Inkster (2025)
Exploring the top neighborhoods for short-term rentals in Inkster? This section highlights key areas, outlining why they are attractive for hosts and guests, along with notable local attractions. Consider these locations based on your target guest profile and investment strategy.
| Neighborhood / Area | Why Host Here? (Target Guests & Appeal) | Key Attractions & Landmarks |
|---|---|---|
| Downtown Inkster | The central hub of Inkster, featuring access to various local businesses and amenities. Attractive for short-term visitors looking for a convenient stay close to shops and restaurants. | Inkster Valley Golf Club, Inkster City Park, Shifi Park, Walnut Park, local food markets |
| Inkster Gardens | A residential neighborhood offering a suburban feel with family-friendly parks and nearby schools, popular for families visiting loved ones in the area. | Gardens Park, Inkster Public Library, local community events, popular restaurants, nearby schools |
| Ruthar Park | A quieter area known for its green spaces and residential vibe, making it ideal for those looking to escape the hustle and bustle. | Ruthar Park, local walking trails, family-friendly facilities, proximity to nearby shopping, community centers |
| Michigan Avenue Area | Centrally located with easy access to various routes for travelers; features many local dining and coffee options. | Michigan Avenue businesses, Howard Park, local coffee shops, dining options, proximity to main road access |
| Inkster Recreational Area | Known for outdoor activities and recreational facilities, this area attracts those looking for a nature-oriented stay. | Inkster Recreational Center, sporting events, community parks, picnic areas, hiking trails |
| South Inkster | A growing neighborhood with diverse culture and community, attracting visitors interested in local experiences and events. | local cultural events, community markets, small businesses, cozy cafes, parks and recreational areas |
| North Inkster | A quieter, residential area appealing for extended stays with family-like amenities and comfortable surroundings. | local parks, family-oriented activities, proximity to schools, shopping areas, community centers |
| Inkster Lake | A serene lakeside area providing opportunities for outdoor activities and relaxation, attractive for a peaceful getaway. | lake activities, fishing, local beaches, nature trails, picnic spots |
Understanding Airbnb License Requirements & STR Laws in Inkster (2025)
While Inkster, Michigan, United States currently shows low STR regulations, specific Airbnb license requirements might still exist or change. Always verify the latest short term rental regulations and Airbnb license requirements directly with local government authorities for Inkster to ensure full compliance before hosting.
(Source: AirROI data, 2025, finding no licensed listings among those analyzed)
Top Performing Airbnb Properties in Inkster (2025)
Benchmark your potential! Explore examples of top-performing Airbnb properties in Inksterbased on Trailing Twelve Month (TTM) revenue. Analyze their characteristics, revenue, occupancy rate, and ADR to understand what drives success in this market.
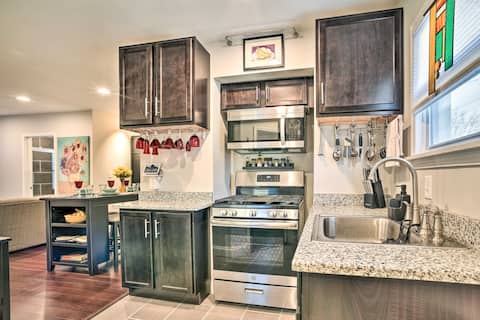
Lovely Dearborn Home w/ Gas Grill & Backyard!
Entire Place • 2 bedrooms
![[2BD]-w/Fast Wi-Fi/Free Parking-](https://a0.muscache.com/im/pictures/miso/Hosting-763351607745755791/original/9025a742-d5a7-40ea-8cfe-afe7e8a52c6d.jpeg?im_w=480&im_format=avif)
[2BD]-w/Fast Wi-Fi/Free Parking-
Entire Place • 2 bedrooms

Modern Home in the Detroit Metropolitan Area
Entire Place • 2 bedrooms
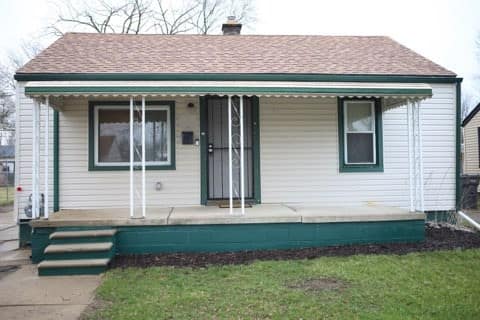
2Cozy
Entire Place • 2 bedrooms
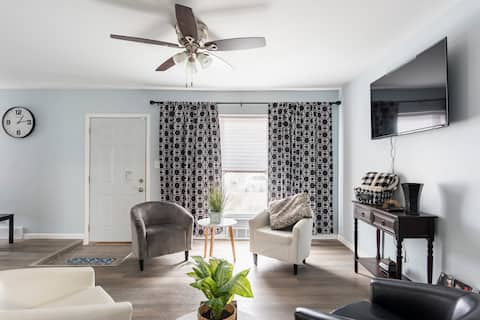
The Marvelous One
Entire Place • 3 bedrooms
Private Master Room near DTW Airport
Private Room • N/A
Note: Performance varies based on location, size, amenities, seasonality, and management quality. Data reflects the past 12 months.
Top Performing Airbnb Hosts in Inkster (2025)
Learn from the best! This table showcases top-performing Airbnb hosts in Inkster based on the number of properties managed and estimated total revenue over the past year. Analyze their scale and performance metrics.
| Host Name | Properties | Grossing Revenue | Stay Reviews | Avg Rating |
|---|---|---|---|---|
| Evolve | 1 | $42,173 | 54 | 4.98/5.0 |
| K- Stays | 1 | $30,974 | 73 | 4.59/5.0 |
| Shenay | 1 | $23,721 | 59 | 4.88/5.0 |
| Durrell | 1 | $17,872 | 39 | 4.87/5.0 |
| LaTronda | 1 | $12,018 | 134 | 4.69/5.0 |
| David | 3 | $8,530 | 170 | 4.86/5.0 |
| Mohamed | 1 | $7,992 | 49 | 4.86/5.0 |
| RedAwning | 1 | $6,732 | 2 | Not Rated |
| Ashley | 1 | $6,364 | 28 | 4.93/5.0 |
| Yatta | 2 | $4,419 | 17 | 4.82/5.0 |
Analyzing the strategies of top hosts, such as their property selection, pricing, and guest communication, can offer valuable lessons for optimizing your own Airbnb operations in Inkster.
Dive Deeper: Advanced Inkster STR Market Data (2025)
Ready to unlock more insights? AirROI provides access to advanced metrics and comprehensive Airbnb data for Inkster. Explore detailed analytics beyond this report to refine your investment strategy, optimize pricing, and maximize your vacation rental profits.
Explore Advanced MetricsInkster Short-Term Rental Market Composition (2025): Property & Room Types
Room Type Distribution
Property Type Distribution
Market Composition Insights for Inkster
- The Inkster Airbnb market composition is heavily skewed towards Entire Home/Apt listings, which make up 61.1% of the 18 active rentals. This indicates strong guest preference for privacy and space.
- However, a notable 38.9% share for Private Rooms suggests opportunities for budget-conscious travelers or hosts renting out spare rooms.
- Looking at the property type distribution in Inkster, House properties are the most common (100%), reflecting the local real estate landscape.
- Houses represent a significant 100% portion, catering likely to families or larger groups.
Inkster Airbnb Room Capacity Analysis (2025): Bedroom Distribution
Distribution of Listings by Number of Bedrooms
Room Capacity Insights for Inkster
- The dominant room capacity in Inkster is 3 bedrooms listings, making up 27.8% of the market. This suggests a strong demand for properties suitable for families or small groups.
- Together, 3 bedrooms and 2 bedrooms properties represent 50.0% of the active Airbnb listings in Inkster, indicating a high concentration in these sizes.
- A significant 33.4% of listings offer 3+ bedrooms, catering to larger groups and families seeking more space in Inkster.
Inkster Vacation Rental Guest Capacity Trends (2025)
Distribution of Listings by Guest Capacity
Guest Capacity Insights for Inkster
- The most common guest capacity trend in Inkster vacation rentals is listings accommodating 4 guests (22.2%). This suggests the primary traveler segment is likely small families or groups.
- Properties designed for 4 guests and 5 guests dominate the Inkster STR market, accounting for 33.3% of listings.
- 22.2% of properties accommodate 6+ guests, serving the market segment for larger families or group travel in Inkster.
- On average, properties in Inkster are equipped to host 3.2 guests.
Inkster Airbnb Booking Patterns (2025): Available vs. Booked Days
Available Days Distribution
Booked Days Distribution
Booking Pattern Insights for Inkster
- The most common availability pattern in Inkster falls within the 271-366 days range, representing 61.1% of listings. This suggests many properties have significant open periods on their calendars.
- Approximately 83.3% of listings show high availability (181+ days open annually), indicating potential for increased bookings or specific owner usage patterns.
- For booked days, the 31-90 days range is most frequent in Inkster (44.4%), reflecting common guest stay durations or potential owner blocking patterns.
- A notable 16.7% of properties secure long booking periods (181+ days booked per year), highlighting successful long-term rental strategies or significant owner usage.
Inkster Airbnb Minimum Stay Requirements Analysis
Distribution of Listings by Minimum Night Requirement
1 Night
6 listings
35.3% of total
2 Nights
5 listings
29.4% of total
3 Nights
1 listings
5.9% of total
4-6 Nights
3 listings
17.6% of total
30+ Nights
2 listings
11.8% of total
Key Insights
- The most prevalent minimum stay requirement in Inkster is 1 Night, adopted by 35.3% of listings. This highlights the market's preference for shorter, flexible bookings.
- A strong majority (64.7%) of the Inkster Airbnb data shows acceptance of very short stays (1-2 nights), indicating a dynamic, high-turnover market.
- A significant segment (11.8%) caters to monthly stays (30+ nights) in Inkster, pointing to opportunities in the extended-stay market.
Recommendations
- Align with the market by considering a 1 Night minimum stay, as 35.3% of Inkster hosts use this setting.
- Explore offering discounts for stays of 30+ nights to attract the 11.8% of the market seeking extended stays.
- Adjust minimum nights based on seasonality – potentially shorter during low season and longer during peak demand periods in Inkster.
Inkster Airbnb Cancellation Policy Trends Analysis (2025)
Flexible
3 listings
17.6% of total
Moderate
6 listings
35.3% of total
Strict
8 listings
47.1% of total
Cancellation Policy Insights for Inkster
- The prevailing Airbnb cancellation policy trend in Inkster is Strict, used by 47.1% of listings.
- There's a relatively balanced mix between guest-friendly (52.9%) and stricter (47.1%) policies, offering choices for different guest needs.
Recommendations for Hosts
- Consider adopting a Strict policy to align with the 47.1% market standard in Inkster.
- With 47.1% using Strict terms, this is a viable option in Inkster, particularly for high-value properties or during peak demand periods.
- Regularly review your cancellation policy against competitors and market demand shifts in Inkster.
Inkster STR Booking Lead Time Analysis (2025)
Average Booking Lead Time by Month
Booking Lead Time Insights for Inkster
- The overall average booking lead time for vacation rentals in Inkster is 17 days.
- Guests book furthest in advance for stays during August (average 36 days), likely coinciding with peak travel demand or local events.
- The shortest booking windows occur for stays in January (average 11 days), indicating more last-minute travel plans during this time.
- Seasonally, Summer (24 days avg.) sees the longest lead times, while Fall (22 days avg.) has the shortest, reflecting typical travel planning cycles.
Recommendations for Hosts
- Use the overall average lead time (17 days) as a baseline for your pricing and availability strategy in Inkster.
- For August stays, consider implementing length-of-stay discounts or slightly higher rates for bookings made less than 36 days out to capitalize on advance planning.
- Target marketing efforts for the Summer season well in advance (at least 24 days) to capture early planners.
- Monitor your own booking lead times against these Inkster averages to identify opportunities for dynamic pricing adjustments.
Popular & Essential Airbnb Amenities in Inkster (2025)
Amenity Prevalence
Amenity Insights for Inkster
- Essential amenities in Inkster that guests expect include: Wifi. Lacking these (this) could significantly impact bookings.
- Popular amenities like Hot water, TV, Heating are common but not universal. Offering these can provide a competitive edge.
Recommendations for Hosts
- Ensure your listing includes all essential amenities for Inkster: Wifi.
- Consider adding popular differentiators like Hot water or TV to increase appeal.
- Highlight unique or less common amenities you offer (e.g., hot tub, dedicated workspace, EV charger) in your listing description and photos.
- Regularly check competitor amenities in Inkster to stay competitive.
Inkster Airbnb Guest Demographics & Profile Analysis (2025)
Guest Profile Summary for Inkster
- The typical guest profile for Airbnb in Inkster consists of primarily domestic travelers (85%), often arriving from nearby Detroit, typically belonging to the Post-2000s (Gen Z/Alpha) group (50%), primarily speaking English or Spanish.
- Domestic travelers account for 84.9% of guests.
- Key international markets include United States (84.9%) and Canada (5%).
- Top languages spoken are English (67.3%) followed by Spanish (11.8%).
- A significant demographic segment is the Post-2000s (Gen Z/Alpha) group, representing 50% of guests.
Recommendations for Hosts
- Target domestic marketing efforts towards travelers from Detroit and New York.
- Tailor amenities and listing descriptions to appeal to the dominant Post-2000s (Gen Z/Alpha) demographic (e.g., highlight fast WiFi, smart home features, local guides).
- Highlight unique local experiences or amenities relevant to the primary guest profile.
- Consider seasonal promotions aligned with peak travel times for key origin markets.
Nearby Short-Term Rental Market Comparison
How does the Inkster Airbnb market stack up against its neighbors? Compare key performance metrics like average monthly revenue, ADR, and occupancy rates in surrounding areas to understand the broader regional STR landscape.
| Market | Active Properties | Monthly Revenue | Daily Rate | Avg. Occupancy |
|---|---|---|---|---|
| Forester | 13 | $4,779 | $397.23 | 39% |
| City of Frankenmuth | 31 | $4,726 | $313.11 | 51% |
| Huron Township | 16 | $4,605 | $462.68 | 39% |
| Scio Township | 23 | $4,485 | $685.92 | 43% |
| Port Sanilac | 35 | $4,073 | $515.80 | 34% |
| Grass Lake Charter Township | 16 | $4,025 | $338.17 | 43% |
| Ann Arbor | 512 | $3,990 | $432.70 | 45% |
| Norvell Township | 11 | $3,905 | $301.71 | 46% |
| Erie Township | 10 | $3,609 | $221.22 | 51% |
| Huron | 124 | $3,515 | $353.69 | 40% |