Mullett Township Airbnb Market Analysis 2025: Short Term Rental Data & Vacation Rental Statistics in Michigan, United States
Is Airbnb profitable in Mullett Township in 2025? Explore comprehensive Airbnb analytics for Mullett Township, Michigan, United States to uncover income potential. This 2025 STR market report for Mullett Township, based on AirROI data from October 2024 to September 2025, reveals key trends in the niche market of 19 active listings.
Whether you're considering an Airbnb investment in Mullett Township, optimizing your existing vacation rental, or exploring rental arbitrage opportunities, understanding the Mullett Township Airbnb data is crucial. Leveraging the low regulation environment is key to maximizing your short term rental income potential. Let's dive into the specifics.
Key Mullett Township Airbnb Performance Metrics Overview
Monthly Airbnb Revenue Variations & Income Potential in Mullett Township (2025)
Understanding the monthly revenue variations for Airbnb listings in Mullett Township is key to maximizing your short term rental income potential. Seasonality significantly impacts earnings. Our analysis, based on data from the past 12 months, shows that the peak revenue month for STRs in Mullett Township is typically July, while March often presents the lowest earnings, highlighting opportunities for strategic pricing adjustments during shoulder and low seasons. Explore the typical Airbnb income in Mullett Township across different performance tiers:
- Best-in-class properties (Top 10%) achieve $8,902+ monthly, often utilizing dynamic pricing and superior guest experiences.
- Strong performing properties (Top 25%) earn $5,223 or more, indicating effective management and desirable locations/amenities.
- Typical properties (Median) generate around $2,977 per month, representing the average market performance.
- Entry-level properties (Bottom 25%) see earnings around $1,527, often with potential for optimization.
Average Monthly Airbnb Earnings Trend in Mullett Township
Mullett Township Airbnb Occupancy Rate Trends (2025)
Maximize your bookings by understanding the Mullett Township STR occupancy trends. Seasonal demand shifts significantly influence how often properties are booked. Typically, Julysees the highest demand (peak season occupancy), while March experiences the lowest (low season). Effective strategies, like adjusting minimum stays or offering promotions, can boost occupancy during slower periods. Here's how different property tiers perform in Mullett Township:
- Best-in-class properties (Top 10%) achieve 73%+ occupancy, indicating high desirability and potentially optimized availability.
- Strong performing properties (Top 25%) maintain 52% or higher occupancy, suggesting good market fit and guest satisfaction.
- Typical properties (Median) have an occupancy rate around 32%.
- Entry-level properties (Bottom 25%) average 20% occupancy, potentially facing higher vacancy.
Average Monthly Occupancy Rate Trend in Mullett Township
Average Daily Rate (ADR) Airbnb Trends in Mullett Township (2025)
Effective short term rental pricing strategy in Mullett Township involves understanding monthly ADR fluctuations. The Average Daily Rate (ADR) for Airbnb in Mullett Township typically peaks in August and dips lowest during April. Leveraging Airbnb dynamic pricing tools or strategies based on this seasonality can significantly boost revenue. Here's a look at the typical nightly rates achieved:
- Best-in-class properties (Top 10%) command rates of $642+ per night, often due to premium features or locations.
- Strong performing properties (Top 25%) achieve nightly rates of $436 or more.
- Typical properties (Median) charge around $286 per night.
- Entry-level properties (Bottom 25%) earn around $185 per night.
Average Daily Rate (ADR) Trend by Month in Mullett Township
Get Live Mullett Township Market Intelligence 👇
Explore Real-time Analytics
Airbnb Seasonality Analysis & Trends in Mullett Township (2025)
Peak Season (July, August, June)
- Revenue averages $8,269 per month
- Occupancy rates average 60.5%
- Daily rates average $420
Shoulder Season
- Revenue averages $3,132 per month
- Occupancy maintains around 34.5%
- Daily rates hold near $337
Low Season (March, November, December)
- Revenue drops to average $1,270 per month
- Occupancy decreases to average 22.7%
- Daily rates adjust to average $315
Seasonality Insights for Mullett Township
- The Airbnb seasonality in Mullett Township shows highly seasonal trends requiring careful strategy. While the sections above show seasonal averages, it's also insightful to look at the extremes:
- During the high season, the absolute peak month showcases Mullett Township's highest earning potential, with monthly revenues capable of climbing to $11,359, occupancy reaching a high of 78.9%, and ADRs peaking at $428.
- Conversely, the slowest single month of the year, typically falling within the low season, marks the market's lowest point. In this month, revenue might dip to $978, occupancy could drop to 13.6%, and ADRs may adjust down to $307.
- Understanding both the seasonal averages and these monthly peaks and troughs in revenue, occupancy, and ADR is crucial for maximizing your Airbnb profit potential in Mullett Township.
Seasonal Strategies for Maximizing Profit
- Peak Season: Maximize revenue through premium pricing and potentially longer minimum stays. Ensure high availability.
- Low Season: Offer competitive pricing, special promotions (e.g., extended stay discounts), and flexible cancellation policies. Target off-season travelers like remote workers or budget-conscious guests.
- Shoulder Seasons: Implement dynamic pricing that balances peak and low rates. Target weekend travelers or specific events. Offer slightly more flexible terms than peak season.
- Regularly analyze your own performance against these Mullett Township seasonality benchmarks and adjust your pricing and availability strategy accordingly.
Best Areas for Airbnb Investment in Mullett Township (2025)
Exploring the top neighborhoods for short-term rentals in Mullett Township? This section highlights key areas, outlining why they are attractive for hosts and guests, along with notable local attractions. Consider these locations based on your target guest profile and investment strategy.
| Neighborhood / Area | Why Host Here? (Target Guests & Appeal) | Key Attractions & Landmarks |
|---|---|---|
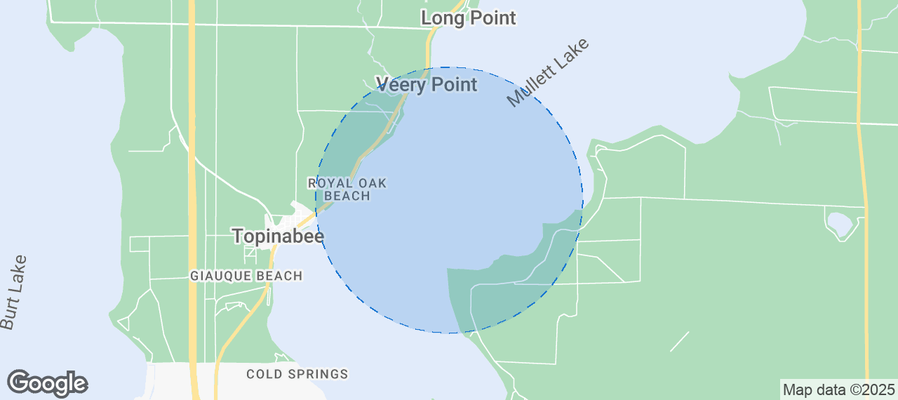
| Mullett Lake | Scenic lakefront community with family-friendly activities and beautiful nature views. Ideal for summer vacations and water sports enthusiasts. | Mullett Lake, Sturgeon Point Lighthouse, Cheboygan State Park, Indian River, Hiking Trails |
| Indian River | Charming small town known as the 'Mouth of the Inland Waterway', perfect for fishing, boating, and outdoor adventures. | Inland Waterway, Burt Lake, Indian River Golf Club, Hiking and Biking Trails |
| Cheboygan | Historic town with waterfront access to Lake Huron. Popular for fishing and boating, attracting tourists from nearby areas. | Cheboygan State Park, Cheboygan River, Historic Downtown Cheboygan, Lake Huron Beaches |
| Onaway | Quaint town surrounded by forests and lakes, appealing to nature lovers and outdoor enthusiasts. | Onaway State Park, Black Lake, Pine River |
| Aloha State Park | Beautiful park offering camping and recreational activities, great for families looking for outdoor experiences. | Aloha State Park, Picnic Areas, Fishing and Swimming spots |
| Nunda Lake | Private lake setting ideal for a quiet retreat, popular among families seeking a peaceful getaway. | Swimming and Fishing, Nature Trails |
| Mullett Township Park | Local park featuring waterfront access and picnic areas, perfect for summer fun and social gatherings. | Picnic Areas, Playgrounds, Beach Access |
| Long Lake | Relaxing area with beautiful landscapes, ideal for those seeking outdoor recreation and water activities. | Long Lake Beach, Fishing, Paddleboarding, Kayaking |
Understanding Airbnb License Requirements & STR Laws in Mullett Township (2025)
While Mullett Township, Michigan, United States currently shows low STR regulations, specific Airbnb license requirements might still exist or change. Always verify the latest short term rental regulations and Airbnb license requirements directly with local government authorities for Mullett Township to ensure full compliance before hosting.
(Source: AirROI data, 2025, finding no licensed listings among those analyzed)
Top Performing Airbnb Properties in Mullett Township (2025)
Benchmark your potential! Explore examples of top-performing Airbnb properties in Mullett Townshipbased on Trailing Twelve Month (TTM) revenue. Analyze their characteristics, revenue, occupancy rate, and ADR to understand what drives success in this market.
Mullet Lake Getaway | Waterfront
Entire Place • 4 bedrooms
Anchor Lodge : Sun, Sand, & Kayaks
Entire Place • 4 bedrooms
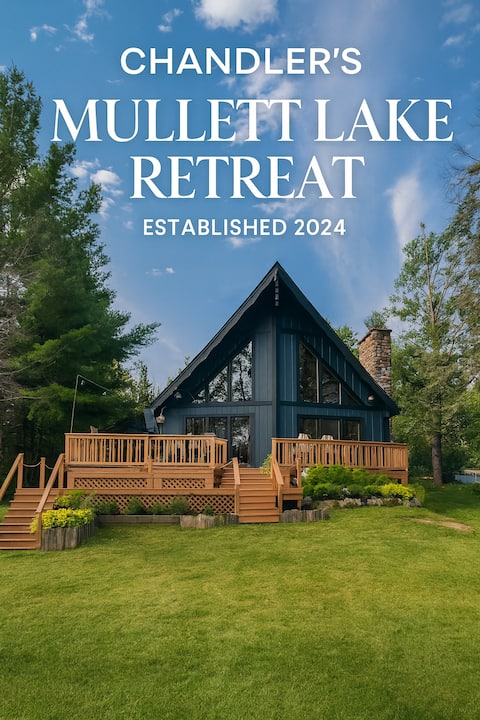
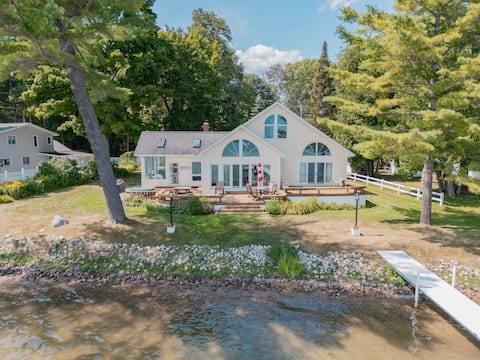
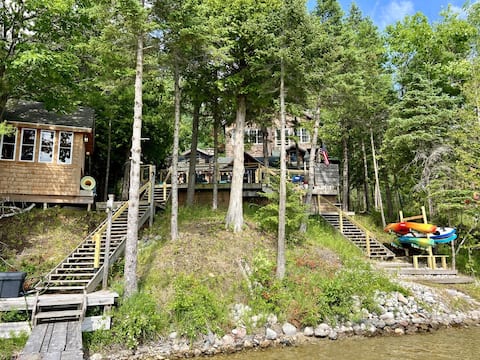
Chandler's Mullett Lake Retreat
Entire Place • 4 bedrooms
Beautiful log home in Indian River
Entire Place • 4 bedrooms
Beautiful Mullett Lake Sunrises!
Entire Place • 3 bedrooms
A fun cottage right on Mullett Lake!
Entire Place • 6 bedrooms
Note: Performance varies based on location, size, amenities, seasonality, and management quality. Data reflects the past 12 months.
Top Performing Airbnb Hosts in Mullett Township (2025)
Learn from the best! This table showcases top-performing Airbnb hosts in Mullett Township based on the number of properties managed and estimated total revenue over the past year. Analyze their scale and performance metrics.
| Host Name | Properties | Grossing Revenue | Stay Reviews | Avg Rating |
|---|---|---|---|---|
| Nicole | 1 | $75,221 | 19 | 4.84/5.0 |
| Freshwater Vacation Rentals | 1 | $62,136 | 17 | 5.00/5.0 |
| Jessica | 1 | $60,247 | 10 | 5.00/5.0 |
| Susan | 1 | $56,161 | 54 | 4.93/5.0 |
| Denise | 1 | $53,822 | 18 | 4.94/5.0 |
| Anthony | 1 | $52,825 | 87 | 4.59/5.0 |
| Monica | 1 | $49,062 | 26 | 4.92/5.0 |
| Andrew | 2 | $47,698 | 10 | 5.00/5.0 |
| Brent | 1 | $47,614 | 51 | 4.80/5.0 |
| Bethany | 1 | $41,831 | 49 | 4.94/5.0 |
Analyzing the strategies of top hosts, such as their property selection, pricing, and guest communication, can offer valuable lessons for optimizing your own Airbnb operations in Mullett Township.
Dive Deeper: Advanced Mullett Township STR Market Data (2025)
Ready to unlock more insights? AirROI provides access to advanced metrics and comprehensive Airbnb data for Mullett Township. Explore detailed analytics beyond this report to refine your investment strategy, optimize pricing, and maximize your vacation rental profits.
Explore Advanced MetricsMullett Township Short-Term Rental Market Composition (2025): Property & Room Types
Room Type Distribution
Property Type Distribution
Market Composition Insights for Mullett Township
- The Mullett Township Airbnb market composition is heavily skewed towards Entire Home/Apt listings, which make up 100% of the 19 active rentals. This indicates strong guest preference for privacy and space.
- Looking at the property type distribution in Mullett Township, House properties are the most common (73.7%), reflecting the local real estate landscape.
- Houses represent a significant 73.7% portion, catering likely to families or larger groups.
Mullett Township Airbnb Room Capacity Analysis (2025): Bedroom Distribution
Distribution of Listings by Number of Bedrooms
Room Capacity Insights for Mullett Township
- The dominant room capacity in Mullett Township is 3 bedrooms listings, making up 42.1% of the market. This suggests a strong demand for properties suitable for families or small groups.
- Together, 3 bedrooms and 4 bedrooms properties represent 63.2% of the active Airbnb listings in Mullett Township, indicating a high concentration in these sizes.
- A significant 79.0% of listings offer 3+ bedrooms, catering to larger groups and families seeking more space in Mullett Township.
Mullett Township Vacation Rental Guest Capacity Trends (2025)
Distribution of Listings by Guest Capacity
Guest Capacity Insights for Mullett Township
- The most common guest capacity trend in Mullett Township vacation rentals is listings accommodating 8+ guests (63.2%). This suggests the primary traveler segment is likely larger groups.
- Properties designed for 8+ guests and 6 guests dominate the Mullett Township STR market, accounting for 84.3% of listings.
- 84.3% of properties accommodate 6+ guests, serving the market segment for larger families or group travel in Mullett Township.
- On average, properties in Mullett Township are equipped to host 7.0 guests.
Mullett Township Airbnb Booking Patterns (2025): Available vs. Booked Days
Available Days Distribution
Booked Days Distribution
Booking Pattern Insights for Mullett Township
- The most common availability pattern in Mullett Township falls within the 271-366 days range, representing 57.9% of listings. This suggests many properties have significant open periods on their calendars.
- Approximately 94.7% of listings show high availability (181+ days open annually), indicating potential for increased bookings or specific owner usage patterns.
- For booked days, the 31-90 days range is most frequent in Mullett Township (52.6%), reflecting common guest stay durations or potential owner blocking patterns.
- A notable 5.3% of properties secure long booking periods (181+ days booked per year), highlighting successful long-term rental strategies or significant owner usage.
Mullett Township Airbnb Minimum Stay Requirements Analysis
Distribution of Listings by Minimum Night Requirement
2 Nights
5 listings
26.3% of total
3 Nights
5 listings
26.3% of total
30+ Nights
9 listings
47.4% of total
Key Insights
- The most prevalent minimum stay requirement in Mullett Township is 30+ Nights, adopted by 47.4% of listings. This highlights the market's preference for longer commitments.
- A significant segment (47.4%) caters to monthly stays (30+ nights) in Mullett Township, pointing to opportunities in the extended-stay market.
Recommendations
- Align with the market by considering a 30+ Nights minimum stay, as 47.4% of Mullett Township hosts use this setting.
- Explore offering discounts for stays of 30+ nights to attract the 47.4% of the market seeking extended stays.
- Adjust minimum nights based on seasonality – potentially shorter during low season and longer during peak demand periods in Mullett Township.
Mullett Township Airbnb Cancellation Policy Trends Analysis (2025)
Moderate
3 listings
15.8% of total
Firm
12 listings
63.2% of total
Strict
4 listings
21.1% of total
Cancellation Policy Insights for Mullett Township
- The prevailing Airbnb cancellation policy trend in Mullett Township is Firm, used by 63.2% of listings.
- A majority (84.3%) of hosts in Mullett Township utilize Firm or Strict policies, indicating a market where hosts prioritize booking security.
Recommendations for Hosts
- Consider adopting a Firm policy to align with the 63.2% market standard in Mullett Township.
- Regularly review your cancellation policy against competitors and market demand shifts in Mullett Township.
Mullett Township STR Booking Lead Time Analysis (2025)
Average Booking Lead Time by Month
Booking Lead Time Insights for Mullett Township
- The overall average booking lead time for vacation rentals in Mullett Township is 86 days.
- Guests book furthest in advance for stays during July (average 156 days), likely coinciding with peak travel demand or local events.
- The shortest booking windows occur for stays in February (average 19 days), indicating more last-minute travel plans during this time.
- Seasonally, Summer (121 days avg.) sees the longest lead times, while Winter (34 days avg.) has the shortest, reflecting typical travel planning cycles.
Recommendations for Hosts
- Use the overall average lead time (86 days) as a baseline for your pricing and availability strategy in Mullett Township.
- For July stays, consider implementing length-of-stay discounts or slightly higher rates for bookings made less than 156 days out to capitalize on advance planning.
- Target marketing efforts for the Summer season well in advance (at least 121 days) to capture early planners.
- Monitor your own booking lead times against these Mullett Township averages to identify opportunities for dynamic pricing adjustments.
Popular & Essential Airbnb Amenities in Mullett Township (2025)
Amenity Prevalence
Amenity Insights for Mullett Township
- Essential amenities in Mullett Township that guests expect include: Free parking on premises, Hot water, Kitchen, TV, Smoke alarm. Lacking these (any) could significantly impact bookings.
- Popular amenities like Dishes and silverware, Microwave, Heating are common but not universal. Offering these can provide a competitive edge.
- Warning: Wifi is not universally provided but is considered essential globally. Ensure reliable Wifi is offered.
Recommendations for Hosts
- Ensure your listing includes all essential amenities for Mullett Township: Free parking on premises, Hot water, Kitchen, TV, Smoke alarm.
- Consider adding popular differentiators like Dishes and silverware or Microwave to increase appeal.
- Highlight unique or less common amenities you offer (e.g., hot tub, dedicated workspace, EV charger) in your listing description and photos.
- Regularly check competitor amenities in Mullett Township to stay competitive.
Mullett Township Airbnb Guest Demographics & Profile Analysis (2025)
Guest Profile Summary for Mullett Township
- The typical guest profile for Airbnb in Mullett Township consists of primarily domestic travelers (94%), often arriving from nearby Cleveland, typically belonging to the Post-2000s (Gen Z/Alpha) group (50%), primarily speaking English or Spanish.
- Domestic travelers account for 94.2% of guests.
- Key international markets include United States (94.2%) and Germany (2.9%).
- Top languages spoken are English (91.7%) followed by Spanish (4.2%).
- A significant demographic segment is the Post-2000s (Gen Z/Alpha) group, representing 50% of guests.
Recommendations for Hosts
- Target domestic marketing efforts towards travelers from Cleveland and Detroit.
- Tailor amenities and listing descriptions to appeal to the dominant Post-2000s (Gen Z/Alpha) demographic (e.g., highlight fast WiFi, smart home features, local guides).
- Highlight unique local experiences or amenities relevant to the primary guest profile.
- Consider seasonal promotions aligned with peak travel times for key origin markets.
Nearby Short-Term Rental Market Comparison
How does the Mullett Township Airbnb market stack up against its neighbors? Compare key performance metrics like average monthly revenue, ADR, and occupancy rates in surrounding areas to understand the broader regional STR landscape.
| Market | Active Properties | Monthly Revenue | Daily Rate | Avg. Occupancy |
|---|---|---|---|---|
| Friendship Township | 13 | $6,062 | $445.07 | 55% |
| Greilickville | 39 | $5,998 | $502.93 | 48% |
| Walloon Lake | 24 | $4,936 | $456.08 | 40% |
| Blair Township | 54 | $4,851 | $470.01 | 45% |
| Bingham Township | 29 | $4,586 | $471.76 | 43% |
| Livingston Township | 12 | $4,456 | $313.20 | 51% |
| Elmwood Charter Township | 73 | $4,252 | $375.18 | 45% |
| Leelanau Township | 50 | $4,181 | $402.01 | 47% |
| Beaugrand Township | 22 | $4,148 | $334.51 | 50% |
| West Traverse Township | 34 | $4,101 | $507.84 | 39% |