Onota Township Airbnb Market Analysis 2025: Short Term Rental Data & Vacation Rental Statistics in Michigan, United States
Is Airbnb profitable in Onota Township in 2025? Explore comprehensive Airbnb analytics for Onota Township, Michigan, United States to uncover income potential. This 2025 STR market report for Onota Township, based on AirROI data from October 2024 to September 2025, reveals key trends in the niche market of 18 active listings.
Whether you're considering an Airbnb investment in Onota Township, optimizing your existing vacation rental, or exploring rental arbitrage opportunities, understanding the Onota Township Airbnb data is crucial. Leveraging the low regulation environment is key to maximizing your short term rental income potential. Let's dive into the specifics.
Key Onota Township Airbnb Performance Metrics Overview
Monthly Airbnb Revenue Variations & Income Potential in Onota Township (2025)
Understanding the monthly revenue variations for Airbnb listings in Onota Township is key to maximizing your short term rental income potential. Seasonality significantly impacts earnings. Our analysis, based on data from the past 12 months, shows that the peak revenue month for STRs in Onota Township is typically July, while November often presents the lowest earnings, highlighting opportunities for strategic pricing adjustments during shoulder and low seasons. Explore the typical Airbnb income in Onota Township across different performance tiers:
- Best-in-class properties (Top 10%) achieve $9,403+ monthly, often utilizing dynamic pricing and superior guest experiences.
- Strong performing properties (Top 25%) earn $6,448 or more, indicating effective management and desirable locations/amenities.
- Typical properties (Median) generate around $3,754 per month, representing the average market performance.
- Entry-level properties (Bottom 25%) see earnings around $2,587, often with potential for optimization.
Average Monthly Airbnb Earnings Trend in Onota Township
Onota Township Airbnb Occupancy Rate Trends (2025)
Maximize your bookings by understanding the Onota Township STR occupancy trends. Seasonal demand shifts significantly influence how often properties are booked. Typically, Augustsees the highest demand (peak season occupancy), while November experiences the lowest (low season). Effective strategies, like adjusting minimum stays or offering promotions, can boost occupancy during slower periods. Here's how different property tiers perform in Onota Township:
- Best-in-class properties (Top 10%) achieve 82%+ occupancy, indicating high desirability and potentially optimized availability.
- Strong performing properties (Top 25%) maintain 66% or higher occupancy, suggesting good market fit and guest satisfaction.
- Typical properties (Median) have an occupancy rate around 46%.
- Entry-level properties (Bottom 25%) average 34% occupancy, potentially facing higher vacancy.
Average Monthly Occupancy Rate Trend in Onota Township
Average Daily Rate (ADR) Airbnb Trends in Onota Township (2025)
Effective short term rental pricing strategy in Onota Township involves understanding monthly ADR fluctuations. The Average Daily Rate (ADR) for Airbnb in Onota Township typically peaks in July and dips lowest during December. Leveraging Airbnb dynamic pricing tools or strategies based on this seasonality can significantly boost revenue. Here's a look at the typical nightly rates achieved:
- Best-in-class properties (Top 10%) command rates of $517+ per night, often due to premium features or locations.
- Strong performing properties (Top 25%) achieve nightly rates of $371 or more.
- Typical properties (Median) charge around $263 per night.
- Entry-level properties (Bottom 25%) earn around $185 per night.
Average Daily Rate (ADR) Trend by Month in Onota Township
Get Live Onota Township Market Intelligence 👇
Explore Real-time Analytics
Airbnb Seasonality Analysis & Trends in Onota Township (2025)
Peak Season (July, August, October)
- Revenue averages $8,242 per month
- Occupancy rates average 75.3%
- Daily rates average $336
Shoulder Season
- Revenue averages $4,236 per month
- Occupancy maintains around 47.6%
- Daily rates hold near $311
Low Season (March, November, December)
- Revenue drops to average $2,352 per month
- Occupancy decreases to average 31.9%
- Daily rates adjust to average $291
Seasonality Insights for Onota Township
- The Airbnb seasonality in Onota Township shows highly seasonal trends requiring careful strategy. While the sections above show seasonal averages, it's also insightful to look at the extremes:
- During the high season, the absolute peak month showcases Onota Township's highest earning potential, with monthly revenues capable of climbing to $9,590, occupancy reaching a high of 81.3%, and ADRs peaking at $357.
- Conversely, the slowest single month of the year, typically falling within the low season, marks the market's lowest point. In this month, revenue might dip to $2,126, occupancy could drop to 29.0%, and ADRs may adjust down to $290.
- Understanding both the seasonal averages and these monthly peaks and troughs in revenue, occupancy, and ADR is crucial for maximizing your Airbnb profit potential in Onota Township.
Seasonal Strategies for Maximizing Profit
- Peak Season: Maximize revenue through premium pricing and potentially longer minimum stays. Ensure high availability.
- Low Season: Offer competitive pricing, special promotions (e.g., extended stay discounts), and flexible cancellation policies. Target off-season travelers like remote workers or budget-conscious guests.
- Shoulder Seasons: Implement dynamic pricing that balances peak and low rates. Target weekend travelers or specific events. Offer slightly more flexible terms than peak season.
- Regularly analyze your own performance against these Onota Township seasonality benchmarks and adjust your pricing and availability strategy accordingly.
Best Areas for Airbnb Investment in Onota Township (2025)
Exploring the top neighborhoods for short-term rentals in Onota Township? This section highlights key areas, outlining why they are attractive for hosts and guests, along with notable local attractions. Consider these locations based on your target guest profile and investment strategy.
| Neighborhood / Area | Why Host Here? (Target Guests & Appeal) | Key Attractions & Landmarks |
|---|---|---|
| Onota Lake | A beautiful and serene location perfect for nature lovers and families seeking a peaceful getaway. Offers plenty of water activities, including fishing and boating, making it a great spot for summer vacations. | Onota Lake, Biking and hiking trails, Fishing spots, Campgrounds, Local park areas |
| Lakeside Beach | One of the most popular public beaches in Onota Township with sandy shores and swimming areas. Ideal for families and tourists looking for a beach experience in Michigan. | Lakeside Beach, Picnic areas, Water sports, Swimming, Scenic views |
| Downtown Berrien Springs | A charming small town area that features local shops, dining options, and a community feel. Attractive for visitors wanting to experience local culture and dining. | Berrien Springs Historic District, Local shops and cafes, Community events, Fruit orchards, Riverfront trails |
| Sandy Lake | A quiet retreat known for its peaceful environment, perfect for those looking to escape the noise of city life. Great for fishing and outdoor activities. | Sandy Lake, Hiking trails nearby, Fishing spots, Camping areas, Nature observation |
| Anderson Lake | A lesser-known gem that offers tranquility and beautiful sunsets. Ideal for those seeking privacy and natural settings during their stay. | Anderson Lake, Kayaking opportunities, Wildlife watching, Scenic picnic spots, Forest trails |
| New Buffalo | A nearby popular resort town along Lake Michigan, great for investing in short-term rentals due to its tourist appeal, restaurants, and beaches. | New Buffalo Beach, Dining and entertainment options, Shopping, Water sports, New Buffalo Railroad Museum |
| St. Joseph | A charming town with beautiful beaches, vibrant art scene, and local wineries. Attracts visitors year-round for its events and natural beauty. | Silver Beach, St. Joseph Lighthouse, Krasl Art Center, Local vineyards, Waterfront park |
| Saugatuck | Known for its arts community and beautiful lakeshore, Saugatuck offers unique shopping, dining, and beautiful scenery, making it a desirable location for tourists. | Oval Beach, Saugatuck Dunes State Park, Art galleries, Boat trips, Downtown shopping district |
Understanding Airbnb License Requirements & STR Laws in Onota Township (2025)
While Onota Township, Michigan, United States currently shows low STR regulations, specific Airbnb license requirements might still exist or change. Always verify the latest short term rental regulations and Airbnb license requirements directly with local government authorities for Onota Township to ensure full compliance before hosting.
(Source: AirROI data, 2025, finding no licensed listings among those analyzed)
Top Performing Airbnb Properties in Onota Township (2025)
Benchmark your potential! Explore examples of top-performing Airbnb properties in Onota Townshipbased on Trailing Twelve Month (TTM) revenue. Analyze their characteristics, revenue, occupancy rate, and ADR to understand what drives success in this market.

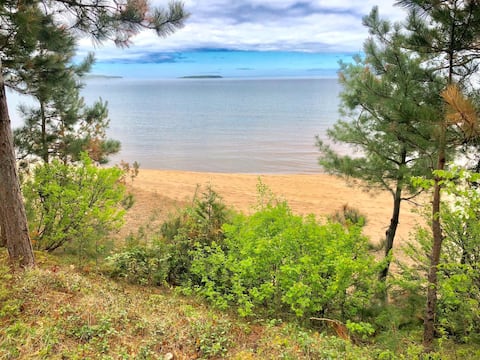
Beautiful waterfront home on Lake Superior
Entire Place • 3 bedrooms
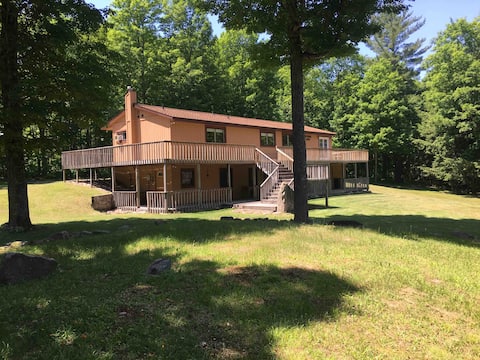
Atv/Snowmobile Trail. On Laughing Whitefish River
Entire Place • 6 bedrooms

Sand River • Lake Superior Views • Kayaks • Sauna
Entire Place • 4 bedrooms
Sandy Shores of Lake Superior! Near Pictured Rocks
Entire Place • 4 bedrooms
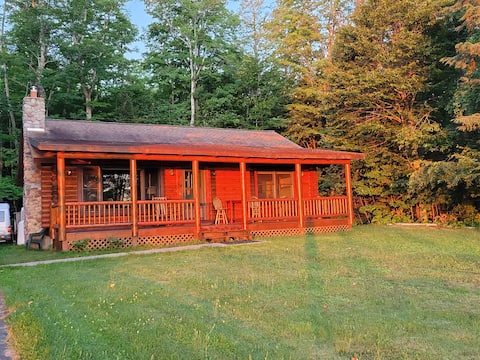
Log home overlooks Lake Superior in Michigans U P
Entire Place • 2 bedrooms
Lake Superior Honeymoon Suite near Pictured Rocks
Entire Place • N/A
Note: Performance varies based on location, size, amenities, seasonality, and management quality. Data reflects the past 12 months.
Top Performing Airbnb Hosts in Onota Township (2025)
Learn from the best! This table showcases top-performing Airbnb hosts in Onota Township based on the number of properties managed and estimated total revenue over the past year. Analyze their scale and performance metrics.
| Host Name | Properties | Grossing Revenue | Stay Reviews | Avg Rating |
|---|---|---|---|---|
| Sarah | 8 | $200,398 | 168 | 4.81/5.0 |
| Kayla | 1 | $111,988 | 49 | 4.88/5.0 |
| Nikki | 1 | $96,356 | 41 | 4.93/5.0 |
| Jenny | 1 | $68,426 | 129 | 4.86/5.0 |
| Erin | 1 | $64,910 | 73 | 4.66/5.0 |
| Michael | 1 | $56,145 | 86 | 5.00/5.0 |
| Autrain | 1 | $51,387 | 139 | 4.92/5.0 |
| Bea | 1 | $45,037 | 5 | 4.80/5.0 |
| Pictured Rocks Real Estate | 1 | $36,943 | 65 | 4.82/5.0 |
| Buddha | 1 | $35,152 | 32 | 4.97/5.0 |
Analyzing the strategies of top hosts, such as their property selection, pricing, and guest communication, can offer valuable lessons for optimizing your own Airbnb operations in Onota Township.
Dive Deeper: Advanced Onota Township STR Market Data (2025)
Ready to unlock more insights? AirROI provides access to advanced metrics and comprehensive Airbnb data for Onota Township. Explore detailed analytics beyond this report to refine your investment strategy, optimize pricing, and maximize your vacation rental profits.
Explore Advanced MetricsOnota Township Short-Term Rental Market Composition (2025): Property & Room Types
Room Type Distribution
Property Type Distribution
Market Composition Insights for Onota Township
- The Onota Township Airbnb market composition is heavily skewed towards Entire Home/Apt listings, which make up 100% of the 18 active rentals. This indicates strong guest preference for privacy and space.
- Looking at the property type distribution in Onota Township, Outdoor/Unique properties are the most common (66.7%), reflecting the local real estate landscape.
- Houses represent a significant 27.8% portion, catering likely to families or larger groups.
Onota Township Airbnb Room Capacity Analysis (2025): Bedroom Distribution
Distribution of Listings by Number of Bedrooms
Room Capacity Insights for Onota Township
- The dominant room capacity in Onota Township is 2 bedrooms listings, making up 27.8% of the market. This suggests a strong demand for properties suitable for couples or solo travelers.
- Together, 2 bedrooms and 4 bedrooms properties represent 55.6% of the active Airbnb listings in Onota Township, indicating a high concentration in these sizes.
- A significant 50.1% of listings offer 3+ bedrooms, catering to larger groups and families seeking more space in Onota Township.
Onota Township Vacation Rental Guest Capacity Trends (2025)
Distribution of Listings by Guest Capacity
Guest Capacity Insights for Onota Township
- The most common guest capacity trend in Onota Township vacation rentals is listings accommodating 8+ guests (38.9%). This suggests the primary traveler segment is likely larger groups.
- Properties designed for 8+ guests and 2 guests dominate the Onota Township STR market, accounting for 61.1% of listings.
- 50.0% of properties accommodate 6+ guests, serving the market segment for larger families or group travel in Onota Township.
- On average, properties in Onota Township are equipped to host 5.3 guests.
Onota Township Airbnb Booking Patterns (2025): Available vs. Booked Days
Available Days Distribution
Booked Days Distribution
Booking Pattern Insights for Onota Township
- The most common availability pattern in Onota Township falls within the 181-270 days range, representing 44.4% of listings. This suggests many properties have significant open periods on their calendars.
- Approximately 72.2% of listings show high availability (181+ days open annually), indicating potential for increased bookings or specific owner usage patterns.
- For booked days, the 91-180 days range is most frequent in Onota Township (50%), reflecting common guest stay durations or potential owner blocking patterns.
- A notable 27.8% of properties secure long booking periods (181+ days booked per year), highlighting successful long-term rental strategies or significant owner usage.
Onota Township Airbnb Minimum Stay Requirements Analysis
Distribution of Listings by Minimum Night Requirement
1 Night
3 listings
16.7% of total
2 Nights
1 listings
5.6% of total
3 Nights
1 listings
5.6% of total
4-6 Nights
2 listings
11.1% of total
30+ Nights
11 listings
61.1% of total
Key Insights
- The most prevalent minimum stay requirement in Onota Township is 30+ Nights, adopted by 61.1% of listings. This highlights the market's preference for longer commitments.
- A significant segment (61.1%) caters to monthly stays (30+ nights) in Onota Township, pointing to opportunities in the extended-stay market.
Recommendations
- Align with the market by considering a 30+ Nights minimum stay, as 61.1% of Onota Township hosts use this setting.
- If feasible, allowing 1-night stays, especially midweek or during low season, could capture last-minute bookings, as only 16.7% currently do.
- Explore offering discounts for stays of 30+ nights to attract the 61.1% of the market seeking extended stays.
- Adjust minimum nights based on seasonality – potentially shorter during low season and longer during peak demand periods in Onota Township.
Onota Township Airbnb Cancellation Policy Trends Analysis (2025)
Super Strict 30 Days
2 listings
11.8% of total
Flexible
1 listings
5.9% of total
Moderate
2 listings
11.8% of total
Firm
8 listings
47.1% of total
Strict
4 listings
23.5% of total
Cancellation Policy Insights for Onota Township
- The prevailing Airbnb cancellation policy trend in Onota Township is Firm, used by 47.1% of listings.
- A majority (70.6%) of hosts in Onota Township utilize Firm or Strict policies, indicating a market where hosts prioritize booking security.
Recommendations for Hosts
- Consider adopting a Firm policy to align with the 47.1% market standard in Onota Township.
- Regularly review your cancellation policy against competitors and market demand shifts in Onota Township.
Onota Township STR Booking Lead Time Analysis (2025)
Average Booking Lead Time by Month
Booking Lead Time Insights for Onota Township
- The overall average booking lead time for vacation rentals in Onota Township is 81 days.
- Guests book furthest in advance for stays during July (average 124 days), likely coinciding with peak travel demand or local events.
- The shortest booking windows occur for stays in December (average 32 days), indicating more last-minute travel plans during this time.
- Seasonally, Summer (108 days avg.) sees the longest lead times, while Winter (62 days avg.) has the shortest, reflecting typical travel planning cycles.
Recommendations for Hosts
- Use the overall average lead time (81 days) as a baseline for your pricing and availability strategy in Onota Township.
- For July stays, consider implementing length-of-stay discounts or slightly higher rates for bookings made less than 124 days out to capitalize on advance planning.
- Target marketing efforts for the Summer season well in advance (at least 108 days) to capture early planners.
- Monitor your own booking lead times against these Onota Township averages to identify opportunities for dynamic pricing adjustments.
Popular & Essential Airbnb Amenities in Onota Township (2025)
Amenity Prevalence
No amenities with partial availability (less than 100%) were found to display in the chart. All essential amenities might be present in all listings. Check insights below.
Amenity Insights for Onota Township
- Essential amenities in Onota Township that guests expect include: Refrigerator, Smoke alarm, Stove, Kitchen, Heating, Bed linens, Wifi, Oven, Dishes and silverware, Coffee maker. Lacking these (any) could significantly impact bookings.
Recommendations for Hosts
- Ensure your listing includes all essential amenities for Onota Township: Refrigerator, Smoke alarm, Stove, Kitchen, Heating, Bed linens, Wifi, Oven, Dishes and silverware, Coffee maker.
- Highlight unique or less common amenities you offer (e.g., hot tub, dedicated workspace, EV charger) in your listing description and photos.
- Regularly check competitor amenities in Onota Township to stay competitive.
Onota Township Airbnb Guest Demographics & Profile Analysis (2025)
Guest Profile Summary for Onota Township
- The typical guest profile for Airbnb in Onota Township consists of primarily domestic travelers (97%), often arriving from nearby Chicago, typically belonging to the Post-2000s (Gen Z/Alpha) group (50%), primarily speaking English or Spanish.
- Domestic travelers account for 96.6% of guests.
- Key international markets include United States (96.6%) and United Kingdom (0.9%).
- Top languages spoken are English (77.6%) followed by Spanish (8.2%).
- A significant demographic segment is the Post-2000s (Gen Z/Alpha) group, representing 50% of guests.
Recommendations for Hosts
- Target domestic marketing efforts towards travelers from Chicago and Ann Arbor.
- Tailor amenities and listing descriptions to appeal to the dominant Post-2000s (Gen Z/Alpha) demographic (e.g., highlight fast WiFi, smart home features, local guides).
- Highlight unique local experiences or amenities relevant to the primary guest profile.
- Consider seasonal promotions aligned with peak travel times for key origin markets.
Nearby Short-Term Rental Market Comparison
How does the Onota Township Airbnb market stack up against its neighbors? Compare key performance metrics like average monthly revenue, ADR, and occupancy rates in surrounding areas to understand the broader regional STR landscape.
| Market | Active Properties | Monthly Revenue | Daily Rate | Avg. Occupancy |
|---|---|---|---|---|
| Friendship Township | 13 | $6,062 | $445.07 | 55% |
| Rowleys Bay | 19 | $5,051 | $406.64 | 46% |
| Ellison Bay | 17 | $4,862 | $399.88 | 47% |
| Marquette Township | 16 | $4,624 | $331.06 | 50% |
| Sister Bay | 87 | $4,561 | $409.58 | 44% |
| Town of Liberty Grove | 57 | $4,537 | $398.96 | 50% |
| Town of Egg Harbor | 42 | $4,397 | $352.10 | 46% |
| Egg Harbor | 84 | $4,229 | $421.41 | 43% |
| Leelanau Township | 50 | $4,181 | $402.01 | 47% |
| West Traverse Township | 34 | $4,101 | $507.84 | 39% |