Oxford Charter Township Airbnb Market Analysis 2025: Short Term Rental Data & Vacation Rental Statistics in Michigan, United States
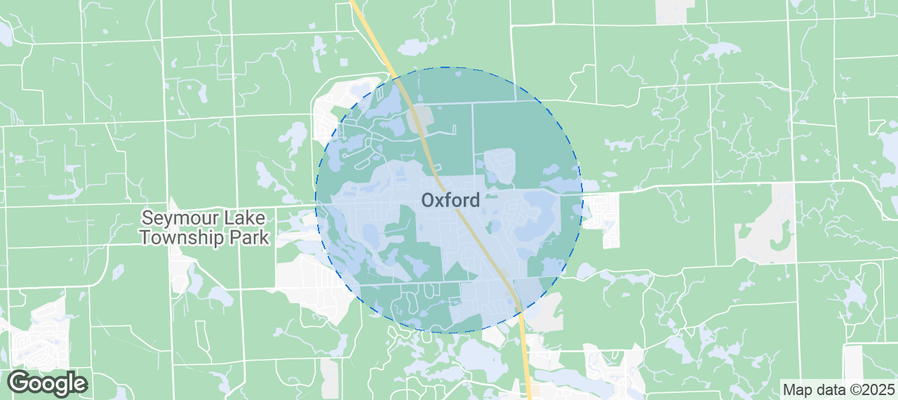
Is Airbnb profitable in Oxford Charter Township in 2025? Explore comprehensive Airbnb analytics for Oxford Charter Township, Michigan, United States to uncover income potential. This 2025 STR market report for Oxford Charter Township, based on AirROI data from November 2024 to October 2025, reveals key trends in the niche market of 18 active listings.
Whether you're considering an Airbnb investment in Oxford Charter Township, optimizing your existing vacation rental, or exploring rental arbitrage opportunities, understanding the Oxford Charter Township Airbnb data is crucial. Leveraging the low regulation environment is key to maximizing your short term rental income potential. Let's dive into the specifics.
Key Oxford Charter Township Airbnb Performance Metrics Overview
Monthly Airbnb Revenue Variations & Income Potential in Oxford Charter Township (2025)
Understanding the monthly revenue variations for Airbnb listings in Oxford Charter Township is key to maximizing your short term rental income potential. Seasonality significantly impacts earnings. Our analysis, based on data from the past 12 months, shows that the peak revenue month for STRs in Oxford Charter Township is typically July, while January often presents the lowest earnings, highlighting opportunities for strategic pricing adjustments during shoulder and low seasons. Explore the typical Airbnb income in Oxford Charter Township across different performance tiers:
- Best-in-class properties (Top 10%) achieve $5,231+ monthly, often utilizing dynamic pricing and superior guest experiences.
- Strong performing properties (Top 25%) earn $3,663 or more, indicating effective management and desirable locations/amenities.
- Typical properties (Median) generate around $2,253 per month, representing the average market performance.
- Entry-level properties (Bottom 25%) see earnings around $768, often with potential for optimization.
Average Monthly Airbnb Earnings Trend in Oxford Charter Township
Oxford Charter Township Airbnb Occupancy Rate Trends (2025)
Maximize your bookings by understanding the Oxford Charter Township STR occupancy trends. Seasonal demand shifts significantly influence how often properties are booked. Typically, Julysees the highest demand (peak season occupancy), while January experiences the lowest (low season). Effective strategies, like adjusting minimum stays or offering promotions, can boost occupancy during slower periods. Here's how different property tiers perform in Oxford Charter Township:
- Best-in-class properties (Top 10%) achieve 80%+ occupancy, indicating high desirability and potentially optimized availability.
- Strong performing properties (Top 25%) maintain 52% or higher occupancy, suggesting good market fit and guest satisfaction.
- Typical properties (Median) have an occupancy rate around 34%.
- Entry-level properties (Bottom 25%) average 17% occupancy, potentially facing higher vacancy.
Average Monthly Occupancy Rate Trend in Oxford Charter Township
Average Daily Rate (ADR) Airbnb Trends in Oxford Charter Township (2025)
Effective short term rental pricing strategy in Oxford Charter Township involves understanding monthly ADR fluctuations. The Average Daily Rate (ADR) for Airbnb in Oxford Charter Township typically peaks in July and dips lowest during March. Leveraging Airbnb dynamic pricing tools or strategies based on this seasonality can significantly boost revenue. Here's a look at the typical nightly rates achieved:
- Best-in-class properties (Top 10%) command rates of $359+ per night, often due to premium features or locations.
- Strong performing properties (Top 25%) achieve nightly rates of $263 or more.
- Typical properties (Median) charge around $162 per night.
- Entry-level properties (Bottom 25%) earn around $115 per night.
Average Daily Rate (ADR) Trend by Month in Oxford Charter Township
Get Live Oxford Charter Township Market Intelligence 👇
Explore Real-time Analytics
Airbnb Seasonality Analysis & Trends in Oxford Charter Township (2025)
Peak Season (July, June, August)
- Revenue averages $3,465 per month
- Occupancy rates average 48.6%
- Daily rates average $215
Shoulder Season
- Revenue averages $2,376 per month
- Occupancy maintains around 38.0%
- Daily rates hold near $195
Low Season (January, February, March)
- Revenue drops to average $1,708 per month
- Occupancy decreases to average 31.2%
- Daily rates adjust to average $184
Seasonality Insights for Oxford Charter Township
- The Airbnb seasonality in Oxford Charter Township shows highly seasonal trends requiring careful strategy. While the sections above show seasonal averages, it's also insightful to look at the extremes:
- During the high season, the absolute peak month showcases Oxford Charter Township's highest earning potential, with monthly revenues capable of climbing to $4,079, occupancy reaching a high of 53.9%, and ADRs peaking at $216.
- Conversely, the slowest single month of the year, typically falling within the low season, marks the market's lowest point. In this month, revenue might dip to $1,280, occupancy could drop to 26.1%, and ADRs may adjust down to $176.
- Understanding both the seasonal averages and these monthly peaks and troughs in revenue, occupancy, and ADR is crucial for maximizing your Airbnb profit potential in Oxford Charter Township.
Seasonal Strategies for Maximizing Profit
- Peak Season: Maximize revenue through premium pricing and potentially longer minimum stays. Ensure high availability.
- Low Season: Offer competitive pricing, special promotions (e.g., extended stay discounts), and flexible cancellation policies. Target off-season travelers like remote workers or budget-conscious guests.
- Shoulder Seasons: Implement dynamic pricing that balances peak and low rates. Target weekend travelers or specific events. Offer slightly more flexible terms than peak season.
- Regularly analyze your own performance against these Oxford Charter Township seasonality benchmarks and adjust your pricing and availability strategy accordingly.
Best Areas for Airbnb Investment in Oxford Charter Township (2025)
Exploring the top neighborhoods for short-term rentals in Oxford Charter Township? This section highlights key areas, outlining why they are attractive for hosts and guests, along with notable local attractions. Consider these locations based on your target guest profile and investment strategy.
| Neighborhood / Area | Why Host Here? (Target Guests & Appeal) | Key Attractions & Landmarks |
|---|---|---|
| Lakeville | A picturesque area ideal for nature lovers and those seeking tranquility, offering access to beautiful lakes and parks. Great for guests looking for a quiet getaway. | Lakeville Lake, Hyde Lake, Oakland County Parks','Bald Mountain State Recreation Area, Lakeside Park |
| Oxford Village | A charming small town with a friendly ambiance, featuring local shops and restaurants. Perfect for visitors who enjoy a close-knit community feel. | Oxford Downtown Historic District, Buzzi's Pizzeria, Oxford Museum, Seymour Lake Park, Lake Orion |
| Seymour Lake | A popular spot for water activities and recreational opportunities, appealing to families and outdoor enthusiasts. | Seymour Lake Park, Seymour Lake, Boating and Fishing, Picnic Areas, Nature Trails |
| Balck Lake | A serene setting for those looking to unwind in nature, with opportunities for fishing and hiking. | Black Lake Park, Fishing Spots, Nature Trails, Hiking Areas, Scenic Views |
| Orion Township | A growing suburb with modern amenities and proximity to urban conveniences, ideal for business travelers and families. | Orion Oaks County Park, Great Lakes Crossing Outlets, Bald Mountain State Recreation Area, Nearby Golf Courses, Restaurants and Shopping |
| Woodstock | A rural area with a rustic charm, perfect for visitors looking to enjoy the countryside and experience local agriculture. | Farmers Markets, Country Roads, Local Farms, Scenic Drives, Nature Trails |
| Lapeer County | A broad area that includes various outdoor recreational options, suitable for adventure seekers and nature lovers. | Lapeer County Parks, Camping Areas, Hiking Trails, Lakes and Rivers, Skiing Areas in Winter |
| Metamora | Known for its historic downtown and equestrian activities, a perfect choice for guests looking for a unique rural experience. | Metamora-Hazen Park, Metamora Historic Downtown, Equestrian Events, Local Artisan Shops, Scenic Countryside |
Understanding Airbnb License Requirements & STR Laws in Oxford Charter Township (2025)
While Oxford Charter Township, Michigan, United States currently shows low STR regulations, specific Airbnb license requirements might still exist or change. Always verify the latest short term rental regulations and Airbnb license requirements directly with local government authorities for Oxford Charter Township to ensure full compliance before hosting.
(Source: AirROI data, 2025, finding no licensed listings among those analyzed)
Top Performing Airbnb Properties in Oxford Charter Township (2025)
Benchmark your potential! Explore examples of top-performing Airbnb properties in Oxford Charter Townshipbased on Trailing Twelve Month (TTM) revenue. Analyze their characteristics, revenue, occupancy rate, and ADR to understand what drives success in this market.
Cabin 1: Horses & Hot Tubs on Perry Lake
Entire Place • 1 bedroom
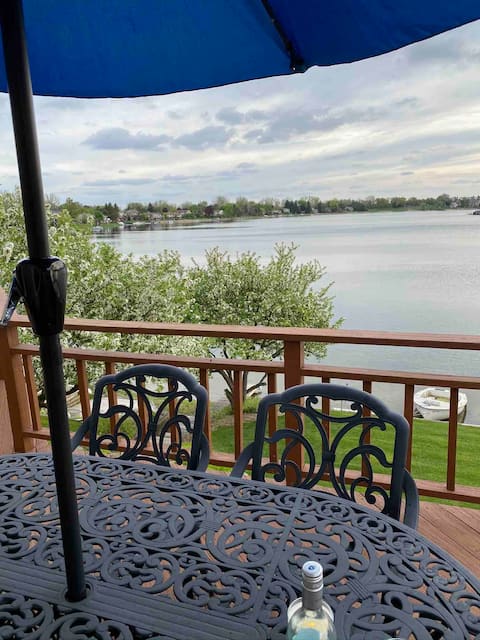
Stunning Views On Beautiful Oxford Lake!
Entire Place • 3 bedrooms

Relaxing Lakefront Cottage-NEW KING BED + 4 Kayaks
Entire Place • 2 bedrooms

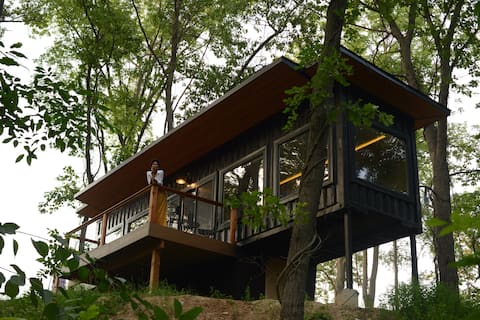
Charming Studio in the Woods
Entire Place • 1 bedroom

Cozy 3 BD Ranch w/ fenced yard
Entire Place • 3 bedrooms

Relax and unwind Lakefront on beautiful Clear Lake
Entire Place • 4 bedrooms
Note: Performance varies based on location, size, amenities, seasonality, and management quality. Data reflects the past 12 months.
Top Performing Airbnb Hosts in Oxford Charter Township (2025)
Learn from the best! This table showcases top-performing Airbnb hosts in Oxford Charter Township based on the number of properties managed and estimated total revenue over the past year. Analyze their scale and performance metrics.
| Host Name | Properties | Grossing Revenue | Stay Reviews | Avg Rating |
|---|---|---|---|---|
| Rachel | 1 | $49,281 | 237 | 4.96/5.0 |
| Lloyd | 1 | $47,793 | 71 | 5.00/5.0 |
| Colleen | 1 | $46,612 | 223 | 4.97/5.0 |
| Cassandra | 1 | $36,943 | 46 | 4.87/5.0 |
| Craig | 2 | $33,804 | 67 | 4.99/5.0 |
| Brian | 1 | $32,445 | 26 | 4.96/5.0 |
| Laura | 2 | $26,570 | 48 | 4.92/5.0 |
| Bryce | 1 | $26,526 | 91 | 4.98/5.0 |
| Sarah | 1 | $14,393 | 21 | 4.90/5.0 |
| Dave | 1 | $8,401 | 1 | Not Rated |
Analyzing the strategies of top hosts, such as their property selection, pricing, and guest communication, can offer valuable lessons for optimizing your own Airbnb operations in Oxford Charter Township.
Dive Deeper: Advanced Oxford Charter Township STR Market Data (2025)
Ready to unlock more insights? AirROI provides access to advanced metrics and comprehensive Airbnb data for Oxford Charter Township. Explore detailed analytics beyond this report to refine your investment strategy, optimize pricing, and maximize your vacation rental profits.
Explore Advanced MetricsOxford Charter Township Short-Term Rental Market Composition (2025): Property & Room Types
Room Type Distribution
Property Type Distribution
Market Composition Insights for Oxford Charter Township
- The Oxford Charter Township Airbnb market composition is heavily skewed towards Entire Home/Apt listings, which make up 88.9% of the 18 active rentals. This indicates strong guest preference for privacy and space.
- Looking at the property type distribution in Oxford Charter Township, House properties are the most common (55.6%), reflecting the local real estate landscape.
- Houses represent a significant 55.6% portion, catering likely to families or larger groups.
- The presence of 16.7% Hotel/Boutique listings indicates integration with traditional hospitality.
Oxford Charter Township Airbnb Room Capacity Analysis (2025): Bedroom Distribution
Distribution of Listings by Number of Bedrooms
Room Capacity Insights for Oxford Charter Township
- The dominant room capacity in Oxford Charter Township is 2 bedrooms listings, making up 27.8% of the market. This suggests a strong demand for properties suitable for couples or solo travelers.
- Together, 2 bedrooms and 3 bedrooms properties represent 50.0% of the active Airbnb listings in Oxford Charter Township, indicating a high concentration in these sizes.
- A significant 33.3% of listings offer 3+ bedrooms, catering to larger groups and families seeking more space in Oxford Charter Township.
Oxford Charter Township Vacation Rental Guest Capacity Trends (2025)
Distribution of Listings by Guest Capacity
Guest Capacity Insights for Oxford Charter Township
- The most common guest capacity trend in Oxford Charter Township vacation rentals is listings accommodating 6 guests (33.3%). This suggests the primary traveler segment is likely larger groups.
- Properties designed for 6 guests and 4 guests dominate the Oxford Charter Township STR market, accounting for 66.6% of listings.
- 44.5% of properties accommodate 6+ guests, serving the market segment for larger families or group travel in Oxford Charter Township.
- On average, properties in Oxford Charter Township are equipped to host 4.4 guests.
Oxford Charter Township Airbnb Booking Patterns (2025): Available vs. Booked Days
Available Days Distribution
Booked Days Distribution
Booking Pattern Insights for Oxford Charter Township
- The most common availability pattern in Oxford Charter Township falls within the 271-366 days range, representing 55.6% of listings. This suggests many properties have significant open periods on their calendars.
- Approximately 88.9% of listings show high availability (181+ days open annually), indicating potential for increased bookings or specific owner usage patterns.
- For booked days, the 31-90 days range is most frequent in Oxford Charter Township (33.3%), reflecting common guest stay durations or potential owner blocking patterns.
- A notable 11.1% of properties secure long booking periods (181+ days booked per year), highlighting successful long-term rental strategies or significant owner usage.
Oxford Charter Township Airbnb Minimum Stay Requirements Analysis
Distribution of Listings by Minimum Night Requirement
1 Night
5 listings
27.8% of total
2 Nights
4 listings
22.2% of total
3 Nights
1 listings
5.6% of total
4-6 Nights
4 listings
22.2% of total
7-29 Nights
1 listings
5.6% of total
30+ Nights
3 listings
16.7% of total
Key Insights
- The most prevalent minimum stay requirement in Oxford Charter Township is 1 Night, adopted by 27.8% of listings. This highlights the market's preference for shorter, flexible bookings.
- A significant segment (16.7%) caters to monthly stays (30+ nights) in Oxford Charter Township, pointing to opportunities in the extended-stay market.
Recommendations
- Align with the market by considering a 1 Night minimum stay, as 27.8% of Oxford Charter Township hosts use this setting.
- If feasible, allowing 1-night stays, especially midweek or during low season, could capture last-minute bookings, as only 27.8% currently do.
- Explore offering discounts for stays of 30+ nights to attract the 16.7% of the market seeking extended stays.
- Adjust minimum nights based on seasonality – potentially shorter during low season and longer during peak demand periods in Oxford Charter Township.
Oxford Charter Township Airbnb Cancellation Policy Trends Analysis (2025)
Flexible
4 listings
22.2% of total
Moderate
4 listings
22.2% of total
Firm
9 listings
50% of total
Strict
1 listings
5.6% of total
Cancellation Policy Insights for Oxford Charter Township
- The prevailing Airbnb cancellation policy trend in Oxford Charter Township is Firm, used by 50% of listings.
- A majority (55.6%) of hosts in Oxford Charter Township utilize Firm or Strict policies, indicating a market where hosts prioritize booking security.
- Strict cancellation policies are quite rare (5.6%), potentially making listings with this policy less competitive unless justified by high demand or property type.
Recommendations for Hosts
- Consider adopting a Firm policy to align with the 50% market standard in Oxford Charter Township.
- Using a Strict policy might deter some guests, as only 5.6% of listings use it. Evaluate if potential revenue protection outweighs possible lower booking rates.
- Regularly review your cancellation policy against competitors and market demand shifts in Oxford Charter Township.
Oxford Charter Township STR Booking Lead Time Analysis (2025)
Average Booking Lead Time by Month
Booking Lead Time Insights for Oxford Charter Township
- The overall average booking lead time for vacation rentals in Oxford Charter Township is 56 days.
- Guests book furthest in advance for stays during August (average 98 days), likely coinciding with peak travel demand or local events.
- The shortest booking windows occur for stays in February (average 10 days), indicating more last-minute travel plans during this time.
- Seasonally, Summer (77 days avg.) sees the longest lead times, while Winter (20 days avg.) has the shortest, reflecting typical travel planning cycles.
Recommendations for Hosts
- Use the overall average lead time (56 days) as a baseline for your pricing and availability strategy in Oxford Charter Township.
- For August stays, consider implementing length-of-stay discounts or slightly higher rates for bookings made less than 98 days out to capitalize on advance planning.
- During February, focus on last-minute booking availability and promotions, as guests book with very short notice (10 days avg.).
- Target marketing efforts for the Summer season well in advance (at least 77 days) to capture early planners.
- Monitor your own booking lead times against these Oxford Charter Township averages to identify opportunities for dynamic pricing adjustments.
Popular & Essential Airbnb Amenities in Oxford Charter Township (2025)
Amenity Prevalence
Amenity Insights for Oxford Charter Township
- Essential amenities in Oxford Charter Township that guests expect include: Wifi, Hot water, Free parking on premises, Coffee maker, Kitchen, Smoke alarm, Refrigerator. Lacking these (any) could significantly impact bookings.
- Popular amenities like Stove, Air conditioning, Dishes and silverware are common but not universal. Offering these can provide a competitive edge.
Recommendations for Hosts
- Ensure your listing includes all essential amenities for Oxford Charter Township: Wifi, Hot water, Free parking on premises, Coffee maker, Kitchen, Smoke alarm, Refrigerator.
- Consider adding popular differentiators like Stove or Air conditioning to increase appeal.
- Highlight unique or less common amenities you offer (e.g., hot tub, dedicated workspace, EV charger) in your listing description and photos.
- Regularly check competitor amenities in Oxford Charter Township to stay competitive.
Oxford Charter Township Airbnb Guest Demographics & Profile Analysis (2025)
Guest Profile Summary for Oxford Charter Township
- The typical guest profile for Airbnb in Oxford Charter Township consists of primarily domestic travelers (92%), often arriving from nearby Michigan, typically belonging to the Post-2000s (Gen Z/Alpha) group (50%), primarily speaking English or German.
- Domestic travelers account for 91.9% of guests.
- Key international markets include United States (91.9%) and Italy (1.4%).
- Top languages spoken are English (76.7%) followed by German (6.7%).
- A significant demographic segment is the Post-2000s (Gen Z/Alpha) group, representing 50% of guests.
Recommendations for Hosts
- Target domestic marketing efforts towards travelers from Michigan and Ann Arbor.
- Tailor amenities and listing descriptions to appeal to the dominant Post-2000s (Gen Z/Alpha) demographic (e.g., highlight fast WiFi, smart home features, local guides).
- Highlight unique local experiences or amenities relevant to the primary guest profile.
- Consider seasonal promotions aligned with peak travel times for key origin markets.
Nearby Short-Term Rental Market Comparison
How does the Oxford Charter Township Airbnb market stack up against its neighbors? Compare key performance metrics like average monthly revenue, ADR, and occupancy rates in surrounding areas to understand the broader regional STR landscape.
| Market | Active Properties | Monthly Revenue | Daily Rate | Avg. Occupancy |
|---|---|---|---|---|
| Forester | 12 | $5,364 | $432.09 | 36% |
| Huron Township | 17 | $5,025 | $492.38 | 39% |
| City of Frankenmuth | 31 | $4,950 | $329.45 | 50% |
| Port Sanilac | 34 | $4,537 | $516.36 | 34% |
| Grass Lake Charter Township | 14 | $4,517 | $368.73 | 43% |
| Norvell Township | 12 | $4,243 | $322.54 | 48% |
| Scio Township | 21 | $4,164 | $723.84 | 39% |
| Ann Arbor | 493 | $3,990 | $451.67 | 43% |
| Huron | 117 | $3,864 | $368.97 | 41% |
| Leoni Township | 13 | $3,797 | $279.50 | 52% |