Peaine Township Airbnb Market Analysis 2025: Short Term Rental Data & Vacation Rental Statistics in Michigan, United States
Is Airbnb profitable in Peaine Township in 2025? Explore comprehensive Airbnb analytics for Peaine Township, Michigan, United States to uncover income potential. This 2025 STR market report for Peaine Township, based on AirROI data from October 2024 to September 2025, reveals key trends in the niche market of 18 active listings.
Whether you're considering an Airbnb investment in Peaine Township, optimizing your existing vacation rental, or exploring rental arbitrage opportunities, understanding the Peaine Township Airbnb data is crucial. Leveraging the low regulation environment is key to maximizing your short term rental income potential. Let's dive into the specifics.
Key Peaine Township Airbnb Performance Metrics Overview
Monthly Airbnb Revenue Variations & Income Potential in Peaine Township (2025)
Understanding the monthly revenue variations for Airbnb listings in Peaine Township is key to maximizing your short term rental income potential. Seasonality significantly impacts earnings. Our analysis, based on data from the past 12 months, shows that the peak revenue month for STRs in Peaine Township is typically July, while February often presents the lowest earnings, highlighting opportunities for strategic pricing adjustments during shoulder and low seasons. Explore the typical Airbnb income in Peaine Township across different performance tiers:
- Best-in-class properties (Top 10%) achieve $7,298+ monthly, often utilizing dynamic pricing and superior guest experiences.
- Strong performing properties (Top 25%) earn $5,044 or more, indicating effective management and desirable locations/amenities.
- Typical properties (Median) generate around $3,285 per month, representing the average market performance.
- Entry-level properties (Bottom 25%) see earnings around $2,027, often with potential for optimization.
Average Monthly Airbnb Earnings Trend in Peaine Township
Peaine Township Airbnb Occupancy Rate Trends (2025)
Maximize your bookings by understanding the Peaine Township STR occupancy trends. Seasonal demand shifts significantly influence how often properties are booked. Typically, Julysees the highest demand (peak season occupancy), while January experiences the lowest (low season). Effective strategies, like adjusting minimum stays or offering promotions, can boost occupancy during slower periods. Here's how different property tiers perform in Peaine Township:
- Best-in-class properties (Top 10%) achieve 72%+ occupancy, indicating high desirability and potentially optimized availability.
- Strong performing properties (Top 25%) maintain 59% or higher occupancy, suggesting good market fit and guest satisfaction.
- Typical properties (Median) have an occupancy rate around 41%.
- Entry-level properties (Bottom 25%) average 28% occupancy, potentially facing higher vacancy.
Average Monthly Occupancy Rate Trend in Peaine Township
Average Daily Rate (ADR) Airbnb Trends in Peaine Township (2025)
Effective short term rental pricing strategy in Peaine Township involves understanding monthly ADR fluctuations. The Average Daily Rate (ADR) for Airbnb in Peaine Township typically peaks in July and dips lowest during May. Leveraging Airbnb dynamic pricing tools or strategies based on this seasonality can significantly boost revenue. Here's a look at the typical nightly rates achieved:
- Best-in-class properties (Top 10%) command rates of $470+ per night, often due to premium features or locations.
- Strong performing properties (Top 25%) achieve nightly rates of $356 or more.
- Typical properties (Median) charge around $245 per night.
- Entry-level properties (Bottom 25%) earn around $186 per night.
Average Daily Rate (ADR) Trend by Month in Peaine Township
Get Live Peaine Township Market Intelligence 👇
Explore Real-time Analytics
Airbnb Seasonality Analysis & Trends in Peaine Township (2025)
Peak Season (July, August, June)
- Revenue averages $7,580 per month
- Occupancy rates average 71.3%
- Daily rates average $317
Shoulder Season
- Revenue averages $3,145 per month
- Occupancy maintains around 38.0%
- Daily rates hold near $294
Low Season (February, March, December)
- Revenue drops to average $1,193 per month
- Occupancy decreases to average 31.1%
- Daily rates adjust to average $298
Seasonality Insights for Peaine Township
- The Airbnb seasonality in Peaine Township shows highly seasonal trends requiring careful strategy. While the sections above show seasonal averages, it's also insightful to look at the extremes:
- During the high season, the absolute peak month showcases Peaine Township's highest earning potential, with monthly revenues capable of climbing to $9,337, occupancy reaching a high of 82.7%, and ADRs peaking at $323.
- Conversely, the slowest single month of the year, typically falling within the low season, marks the market's lowest point. In this month, revenue might dip to $928, occupancy could drop to 22.6%, and ADRs may adjust down to $277.
- Understanding both the seasonal averages and these monthly peaks and troughs in revenue, occupancy, and ADR is crucial for maximizing your Airbnb profit potential in Peaine Township.
Seasonal Strategies for Maximizing Profit
- Peak Season: Maximize revenue through premium pricing and potentially longer minimum stays. Ensure high availability.
- Low Season: Offer competitive pricing, special promotions (e.g., extended stay discounts), and flexible cancellation policies. Target off-season travelers like remote workers or budget-conscious guests.
- Shoulder Seasons: Implement dynamic pricing that balances peak and low rates. Target weekend travelers or specific events. Offer slightly more flexible terms than peak season.
- Regularly analyze your own performance against these Peaine Township seasonality benchmarks and adjust your pricing and availability strategy accordingly.
Best Areas for Airbnb Investment in Peaine Township (2025)
Exploring the top neighborhoods for short-term rentals in Peaine Township? This section highlights key areas, outlining why they are attractive for hosts and guests, along with notable local attractions. Consider these locations based on your target guest profile and investment strategy.
| Neighborhood / Area | Why Host Here? (Target Guests & Appeal) | Key Attractions & Landmarks |
|---|---|---|
| Paeine Township Beach | A scenic spot along Lake Michigan perfect for summer retreats. Visitors love the sandy beach, ideal for swimming and sunbathing, making it great for summer Airbnb rentals. | Lake Michigan, Paeine Township Park, Public Beach Access, Local Restaurants, Fishing Spots |
| Historical District | A charming area featuring historic homes and landmarks that attract visitors interested in history and local culture. Great for families and couples looking for a quiet getaway. | Paeine Township Historical Society, Old Town Hall, Local Art Galleries, Scenic Walking Trails |
| Nearby State Parks | Access to beautiful nature, hiking trails, and camping areas appeals to outdoor enthusiasts. Perfect for those seeking adventure and natural beauty. | Paeine State Park, Campsites, Hiking Trails, Biking Paths, Wildlife Viewing |
| Local Food Scene | This area boasts great dining options ranging from local diners to gourmet restaurants. Attracts foodies who want to experience local cuisine. | Local Farmers' Markets, Popular Diners, Cafes, Gourmet Restaurants, Wine Tasting Rooms |
| Annual Festivals | Paeine Township hosts several annual festivals that bring in tourists. Perfect for Airbnb hosts during peak festival times. | Art & Wine Festival, Summer Music Festivals, Holiday Parades, Craft Fairs, Food Festivals |
| Wine Country | While not as famous as other regions, there are wineries nearby that attract tourists for tastings and tours. Ideal for romantic getaways. | Winery Tours, Wine Tastings, Scenic Vineyards, Grape Picking, Winery Events |
| Golf Courses | Home to several well-maintained golf courses that attract golfing tourists during the season. Popular with retired couples and vacationers. | Local Golf Courses, Driving Ranges, Golf Tournaments, Clubhouses, Golf Lessons |
| Winter Recreation Areas | In the winter season, the area offers great spots for skiing and snowboarding, attracting winter sports enthusiasts and families. | Ski Resorts, Snowboarding Parks, Winter Hiking Trails, Local Lodges, Ice Skating Rinks |
Understanding Airbnb License Requirements & STR Laws in Peaine Township (2025)
While Peaine Township, Michigan, United States currently shows low STR regulations, specific Airbnb license requirements might still exist or change. Always verify the latest short term rental regulations and Airbnb license requirements directly with local government authorities for Peaine Township to ensure full compliance before hosting.
(Source: AirROI data, 2025, finding no licensed listings among those analyzed)
Top Performing Airbnb Properties in Peaine Township (2025)
Benchmark your potential! Explore examples of top-performing Airbnb properties in Peaine Townshipbased on Trailing Twelve Month (TTM) revenue. Analyze their characteristics, revenue, occupancy rate, and ADR to understand what drives success in this market.
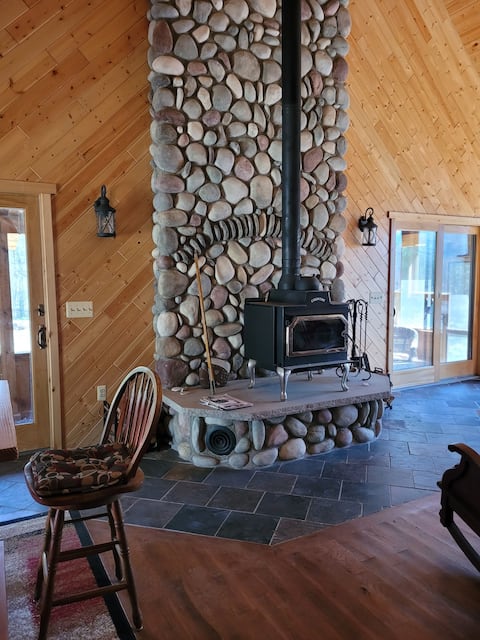
The Lake Haus
Entire Place • 3 bedrooms
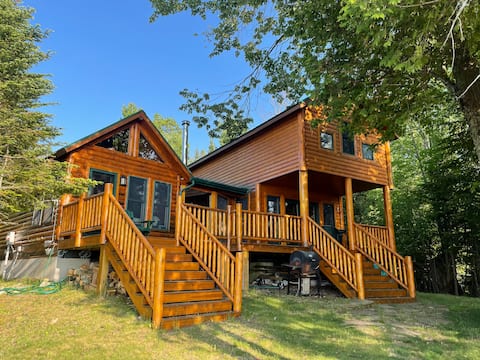
Octagon Beach House Near Dark Sky Sanctuary
Entire Place • 4 bedrooms
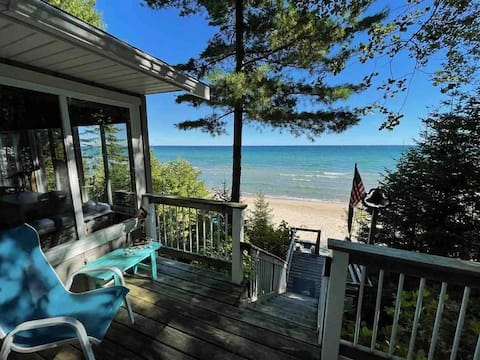
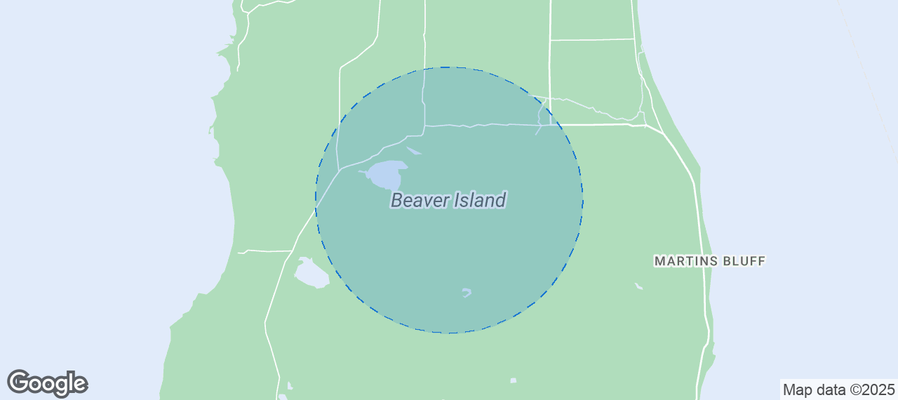
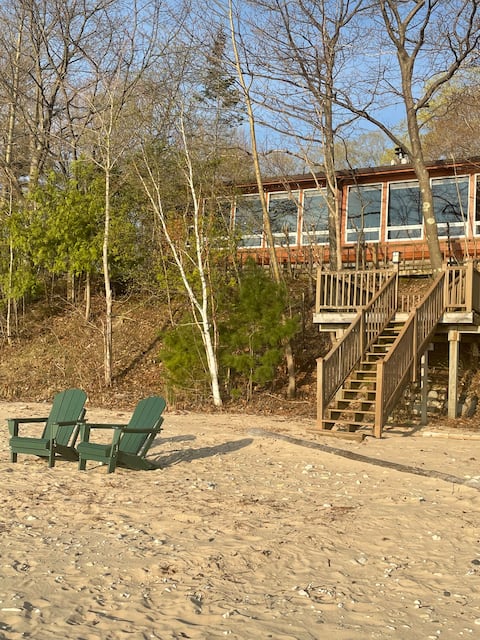
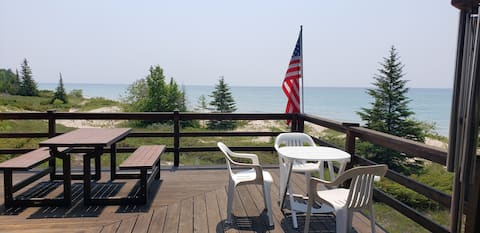
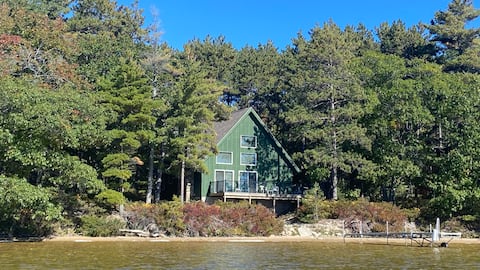
Beaver Island Sunrise Cottage On Lake Michigan
Entire Place • 2 bedrooms
Anchors Aweigh
Entire Place • 2 bedrooms
Eagles Rest Island Getaway
Entire Place • 1 bedroom
The Lucky Charm on Lake Geneserath, Beaver Island
Entire Place • 4 bedrooms
Note: Performance varies based on location, size, amenities, seasonality, and management quality. Data reflects the past 12 months.
Top Performing Airbnb Hosts in Peaine Township (2025)
Learn from the best! This table showcases top-performing Airbnb hosts in Peaine Township based on the number of properties managed and estimated total revenue over the past year. Analyze their scale and performance metrics.
| Host Name | Properties | Grossing Revenue | Stay Reviews | Avg Rating |
|---|---|---|---|---|
| Gerry | 2 | $71,249 | 43 | 4.68/5.0 |
| Stacy | 1 | $68,432 | 29 | 5.00/5.0 |
| Leavetown Vacations | 1 | $57,590 | 33 | 5.00/5.0 |
| David | 1 | $48,441 | 48 | 4.81/5.0 |
| Jamie | 1 | $46,832 | 32 | 4.97/5.0 |
| Monica | 1 | $39,634 | 21 | 5.00/5.0 |
| Joshua | 1 | $36,834 | 13 | 4.92/5.0 |
| Renay | 1 | $34,087 | 9 | 4.89/5.0 |
| Elizabeth | 1 | $33,824 | 81 | 4.95/5.0 |
| Blair | 1 | $33,237 | 8 | 5.00/5.0 |
Analyzing the strategies of top hosts, such as their property selection, pricing, and guest communication, can offer valuable lessons for optimizing your own Airbnb operations in Peaine Township.
Dive Deeper: Advanced Peaine Township STR Market Data (2025)
Ready to unlock more insights? AirROI provides access to advanced metrics and comprehensive Airbnb data for Peaine Township. Explore detailed analytics beyond this report to refine your investment strategy, optimize pricing, and maximize your vacation rental profits.
Explore Advanced MetricsPeaine Township Short-Term Rental Market Composition (2025): Property & Room Types
Room Type Distribution
Property Type Distribution
Market Composition Insights for Peaine Township
- The Peaine Township Airbnb market composition is heavily skewed towards Entire Home/Apt listings, which make up 100% of the 18 active rentals. This indicates strong guest preference for privacy and space.
- Looking at the property type distribution in Peaine Township, House properties are the most common (72.2%), reflecting the local real estate landscape.
- Houses represent a significant 72.2% portion, catering likely to families or larger groups.
Peaine Township Airbnb Room Capacity Analysis (2025): Bedroom Distribution
Distribution of Listings by Number of Bedrooms
Room Capacity Insights for Peaine Township
- The dominant room capacity in Peaine Township is 2 bedrooms listings, making up 33.3% of the market. This suggests a strong demand for properties suitable for couples or solo travelers.
- Together, 2 bedrooms and 4 bedrooms properties represent 61.1% of the active Airbnb listings in Peaine Township, indicating a high concentration in these sizes.
- A significant 44.5% of listings offer 3+ bedrooms, catering to larger groups and families seeking more space in Peaine Township.
Peaine Township Vacation Rental Guest Capacity Trends (2025)
Distribution of Listings by Guest Capacity
Guest Capacity Insights for Peaine Township
- The most common guest capacity trend in Peaine Township vacation rentals is listings accommodating 8+ guests (55.6%). This suggests the primary traveler segment is likely larger groups.
- Properties designed for 8+ guests and 4 guests dominate the Peaine Township STR market, accounting for 77.8% of listings.
- 66.7% of properties accommodate 6+ guests, serving the market segment for larger families or group travel in Peaine Township.
- On average, properties in Peaine Township are equipped to host 6.2 guests.
Peaine Township Airbnb Booking Patterns (2025): Available vs. Booked Days
Available Days Distribution
Booked Days Distribution
Booking Pattern Insights for Peaine Township
- The most common availability pattern in Peaine Township falls within the 181-270 days range, representing 50% of listings. This suggests many properties have significant open periods on their calendars.
- Approximately 94.4% of listings show high availability (181+ days open annually), indicating potential for increased bookings or specific owner usage patterns.
- For booked days, the 91-180 days range is most frequent in Peaine Township (50%), reflecting common guest stay durations or potential owner blocking patterns.
- A notable 5.6% of properties secure long booking periods (181+ days booked per year), highlighting successful long-term rental strategies or significant owner usage.
Peaine Township Airbnb Minimum Stay Requirements Analysis
Distribution of Listings by Minimum Night Requirement
1 Night
2 listings
11.1% of total
2 Nights
6 listings
33.3% of total
3 Nights
1 listings
5.6% of total
4-6 Nights
2 listings
11.1% of total
30+ Nights
7 listings
38.9% of total
Key Insights
- The most prevalent minimum stay requirement in Peaine Township is 30+ Nights, adopted by 38.9% of listings. This highlights the market's preference for longer commitments.
- A significant segment (38.9%) caters to monthly stays (30+ nights) in Peaine Township, pointing to opportunities in the extended-stay market.
Recommendations
- Align with the market by considering a 30+ Nights minimum stay, as 38.9% of Peaine Township hosts use this setting.
- If feasible, allowing 1-night stays, especially midweek or during low season, could capture last-minute bookings, as only 11.1% currently do.
- A 2-night minimum appears standard (33.3%). Consider this for weekends or peak periods.
- Explore offering discounts for stays of 30+ nights to attract the 38.9% of the market seeking extended stays.
- Adjust minimum nights based on seasonality – potentially shorter during low season and longer during peak demand periods in Peaine Township.
Peaine Township Airbnb Cancellation Policy Trends Analysis (2025)
Flexible
2 listings
11.1% of total
Moderate
3 listings
16.7% of total
Firm
10 listings
55.6% of total
Strict
3 listings
16.7% of total
Cancellation Policy Insights for Peaine Township
- The prevailing Airbnb cancellation policy trend in Peaine Township is Firm, used by 55.6% of listings.
- A majority (72.3%) of hosts in Peaine Township utilize Firm or Strict policies, indicating a market where hosts prioritize booking security.
Recommendations for Hosts
- Consider adopting a Firm policy to align with the 55.6% market standard in Peaine Township.
- Regularly review your cancellation policy against competitors and market demand shifts in Peaine Township.
Peaine Township STR Booking Lead Time Analysis (2025)
Average Booking Lead Time by Month
Booking Lead Time Insights for Peaine Township
- The overall average booking lead time for vacation rentals in Peaine Township is 112 days.
- Guests book furthest in advance for stays during April (average 181 days), likely coinciding with peak travel demand or local events.
- The shortest booking windows occur for stays in November (average 44 days), indicating more last-minute travel plans during this time.
- Seasonally, Summer (151 days avg.) sees the longest lead times, while Fall (56 days avg.) has the shortest, reflecting typical travel planning cycles.
Recommendations for Hosts
- Use the overall average lead time (112 days) as a baseline for your pricing and availability strategy in Peaine Township.
- For April stays, consider implementing length-of-stay discounts or slightly higher rates for bookings made less than 181 days out to capitalize on advance planning.
- Target marketing efforts for the Summer season well in advance (at least 151 days) to capture early planners.
- Monitor your own booking lead times against these Peaine Township averages to identify opportunities for dynamic pricing adjustments.
Popular & Essential Airbnb Amenities in Peaine Township (2025)
Amenity Prevalence
Amenity Insights for Peaine Township
- Essential amenities in Peaine Township that guests expect include: Free parking on premises, Hot water, Smoke alarm. Lacking these (any) could significantly impact bookings.
- Popular amenities like Fire extinguisher, Kitchen, TV are common but not universal. Offering these can provide a competitive edge.
- Warning: Wifi is not universally provided but is considered essential globally. Ensure reliable Wifi is offered.
Recommendations for Hosts
- Ensure your listing includes all essential amenities for Peaine Township: Free parking on premises, Hot water, Smoke alarm.
- Consider adding popular differentiators like Fire extinguisher or Kitchen to increase appeal.
- Highlight unique or less common amenities you offer (e.g., hot tub, dedicated workspace, EV charger) in your listing description and photos.
- Regularly check competitor amenities in Peaine Township to stay competitive.
Peaine Township Airbnb Guest Demographics & Profile Analysis (2025)
Guest Profile Summary for Peaine Township
- The typical guest profile for Airbnb in Peaine Township consists of primarily domestic travelers (99%), often arriving from nearby Traverse City, typically belonging to the Post-2000s (Gen Z/Alpha) group (50%), primarily speaking English or Russian.
- Domestic travelers account for 98.8% of guests.
- Key international markets include United States (98.8%) and Canada (1.3%).
- Top languages spoken are English (89.7%) followed by Russian (3.4%).
- A significant demographic segment is the Post-2000s (Gen Z/Alpha) group, representing 50% of guests.
Recommendations for Hosts
- Target domestic marketing efforts towards travelers from Traverse City and Grand Rapids.
- Tailor amenities and listing descriptions to appeal to the dominant Post-2000s (Gen Z/Alpha) demographic (e.g., highlight fast WiFi, smart home features, local guides).
- Highlight unique local experiences or amenities relevant to the primary guest profile.
- Consider seasonal promotions aligned with peak travel times for key origin markets.
Nearby Short-Term Rental Market Comparison
How does the Peaine Township Airbnb market stack up against its neighbors? Compare key performance metrics like average monthly revenue, ADR, and occupancy rates in surrounding areas to understand the broader regional STR landscape.
| Market | Active Properties | Monthly Revenue | Daily Rate | Avg. Occupancy |
|---|---|---|---|---|
| Friendship Township | 13 | $6,062 | $445.07 | 55% |
| Greilickville | 39 | $5,998 | $502.93 | 48% |
| Walloon Lake | 24 | $4,936 | $456.08 | 40% |
| Blair Township | 54 | $4,851 | $470.01 | 45% |
| Marquette Township | 16 | $4,624 | $331.06 | 50% |
| Bingham Township | 29 | $4,586 | $471.76 | 43% |
| Livingston Township | 12 | $4,456 | $313.20 | 51% |
| Elmwood Charter Township | 73 | $4,252 | $375.18 | 45% |
| Leelanau Township | 50 | $4,181 | $402.01 | 47% |
| Beaugrand Township | 22 | $4,148 | $334.51 | 50% |