Torch Lake Township Airbnb Market Analysis 2026: Short Term Rental Data & Vacation Rental Statistics in Michigan, United States
Is Airbnb profitable in Torch Lake Township in 2026? Explore comprehensive Airbnb analytics for Torch Lake Township, Michigan, United States to uncover income potential. This 2026 STR market report for Torch Lake Township, based on AirROI data from February 2025 to January 2026, reveals key trends in the niche market of 31 active listings.
Whether you're considering an Airbnb investment in Torch Lake Township, optimizing your existing vacation rental, or exploring rental arbitrage opportunities, understanding the Torch Lake Township Airbnb data is crucial. Leveraging the low regulation environment is key to maximizing your short term rental income potential. Let's dive into the specifics.
Key Torch Lake Township Airbnb Performance Metrics Overview
Monthly Airbnb Revenue Variations & Income Potential in Torch Lake Township (2026)
Understanding the monthly revenue variations for Airbnb listings in Torch Lake Township is key to maximizing your short term rental income potential. Seasonality significantly impacts earnings. Our analysis, based on data from the past 12 months, shows that the peak revenue month for STRs in Torch Lake Township is typically July, while April often presents the lowest earnings, highlighting opportunities for strategic pricing adjustments during shoulder and low seasons. Explore the typical Airbnb income in Torch Lake Township across different performance tiers:
- Best-in-class properties (Top 10%) achieve $8,116+ monthly, often utilizing dynamic pricing and superior guest experiences.
- Strong performing properties (Top 25%) earn $5,148 or more, indicating effective management and desirable locations/amenities.
- Typical properties (Median) generate around $3,598 per month, representing the average market performance.
- Entry-level properties (Bottom 25%) see earnings around $2,069, often with potential for optimization.
Average Monthly Airbnb Earnings Trend in Torch Lake Township
Torch Lake Township Airbnb Occupancy Rate Trends (2026)
Maximize your bookings by understanding the Torch Lake Township STR occupancy trends. Seasonal demand shifts significantly influence how often properties are booked. Typically, Julysees the highest demand (peak season occupancy), while April experiences the lowest (low season). Effective strategies, like adjusting minimum stays or offering promotions, can boost occupancy during slower periods. Here's how different property tiers perform in Torch Lake Township:
- Best-in-class properties (Top 10%) achieve 74%+ occupancy, indicating high desirability and potentially optimized availability.
- Strong performing properties (Top 25%) maintain 61% or higher occupancy, suggesting good market fit and guest satisfaction.
- Typical properties (Median) have an occupancy rate around 45%.
- Entry-level properties (Bottom 25%) average 28% occupancy, potentially facing higher vacancy.
Average Monthly Occupancy Rate Trend in Torch Lake Township
Average Daily Rate (ADR) Airbnb Trends in Torch Lake Township (2026)
Effective short term rental pricing strategy in Torch Lake Township involves understanding monthly ADR fluctuations. The Average Daily Rate (ADR) for Airbnb in Torch Lake Township typically peaks in January and dips lowest during February. Leveraging Airbnb dynamic pricing tools or strategies based on this seasonality can significantly boost revenue. Here's a look at the typical nightly rates achieved:
- Best-in-class properties (Top 10%) command rates of $568+ per night, often due to premium features or locations.
- Strong performing properties (Top 25%) achieve nightly rates of $326 or more.
- Typical properties (Median) charge around $220 per night.
- Entry-level properties (Bottom 25%) earn around $168 per night.
Average Daily Rate (ADR) Trend by Month in Torch Lake Township
Get Live Torch Lake Township Market Intelligence 👇

Explore Real-time Analytics
Airbnb Seasonality Analysis & Trends in Torch Lake Township (2026)
Peak Season (July, August, October)
- Revenue averages $7,208 per month
- Occupancy rates average 68.6%
- Daily rates average $300
Shoulder Season
- Revenue averages $3,722 per month
- Occupancy maintains around 42.9%
- Daily rates hold near $300
Low Season (February, March, April)
- Revenue drops to average $1,879 per month
- Occupancy decreases to average 28.3%
- Daily rates adjust to average $251
Seasonality Insights for Torch Lake Township
- The Airbnb seasonality in Torch Lake Township shows highly seasonal trends requiring careful strategy. While the sections above show seasonal averages, it's also insightful to look at the extremes:
- During the high season, the absolute peak month showcases Torch Lake Township's highest earning potential, with monthly revenues capable of climbing to $8,476, occupancy reaching a high of 74.4%, and ADRs peaking at $318.
- Conversely, the slowest single month of the year, typically falling within the low season, marks the market's lowest point. In this month, revenue might dip to $1,470, occupancy could drop to 22.3%, and ADRs may adjust down to $250.
- Understanding both the seasonal averages and these monthly peaks and troughs in revenue, occupancy, and ADR is crucial for maximizing your Airbnb profit potential in Torch Lake Township.
Seasonal Strategies for Maximizing Profit
- Peak Season: Maximize revenue through premium pricing and potentially longer minimum stays. Ensure high availability.
- Low Season: Offer competitive pricing, special promotions (e.g., extended stay discounts), and flexible cancellation policies. Target off-season travelers like remote workers or budget-conscious guests.
- Shoulder Seasons: Implement dynamic pricing that balances peak and low rates. Target weekend travelers or specific events. Offer slightly more flexible terms than peak season.
- Regularly analyze your own performance against these Torch Lake Township seasonality benchmarks and adjust your pricing and availability strategy accordingly.
Best Areas for Airbnb Investment in Torch Lake Township (2026)
Exploring the top neighborhoods for short-term rentals in Torch Lake Township? This section highlights key areas, outlining why they are attractive for hosts and guests, along with notable local attractions. Consider these locations based on your target guest profile and investment strategy.
| Neighborhood / Area | Why Host Here? (Target Guests & Appeal) | Key Attractions & Landmarks |
|---|---|---|
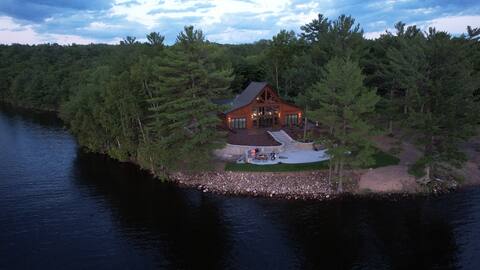
| Torch Lake | Known for its stunning blue waters and scenic beauty, Torch Lake is a popular destination for summer vacations, particularly for families and those looking to enjoy water activities such as boating and swimming. | Torch Lake Sandbar, Torch Lake State Park, Beaver Island, Boat rentals, Scenic drives around the lake, Local eateries |
| Eastport | A charming small community offering access to Torch Lake and beautiful lakefront views. It's ideal for tourists who appreciate a peaceful atmosphere and nature activities. | Eastport Marina, Local farms, Biking and hiking trails, Fishing spots, Beaches |
| Alden | A quaint village known for its access to both Torch Lake and nearby attractions. Alden attracts visitors looking for a cozy getaway with small-town charm. | Alden's Main Street shops, Torch Lake sunsets, Cultural events, Local restaurants, Scenic parks |
| Central Lake | A small community that offers affordable lodging options and access to Torch Lake and nearby lakes. Central Lake is ideal for visitors looking for outdoor activities and a quieter atmosphere. | Central Lake Park, Local lakes, Fishing and swimming, Hiking trails, Community events |
| Bellaire | A gateway to recreational activities, Bellaire is near multiple lakes and offers plenty of outdoor activities, making it a great spot for vacationers. | Shanty Creek Resorts, Bellaire River, Hiking and biking trails, Local breweries, Dining in downtown Bellaire |
| Interlochen | Famous for the Interlochen Center for the Arts, this area attracts visitors interested in culture as well as outdoor recreation, being close to various lakes and nature spots. | Interlochen Center for the Arts, Green Lake, Outdoor concerts and events, Local art galleries, Nature trails |
| Traverse City | While not directly on Torch Lake, Traverse City is a major hub for visitors to Northern Michigan, known for its wineries and vibrant downtown area, attracting many tourists throughout the year. | Old Mission Peninsula, Traverse City State Park, Wineries and tasting rooms, Downtown shops and restaurants, Cherry Festival |
| Penasee Glacier | A unique natural attraction that offers sightseeing and an exploration experience for visitors interested in geology and natural wonders surrounding Torch Lake. | Glacial formations, Nature trails, Photography spots, Bird watching, Educational tours |
Understanding Airbnb License Requirements & STR Laws in Torch Lake Township (2026)
While Torch Lake Township, Michigan, United States currently shows low STR regulations, specific Airbnb license requirements might still exist or change. Always verify the latest short term rental regulations and Airbnb license requirements directly with local government authorities for Torch Lake Township to ensure full compliance before hosting.
(Source: AirROI data, 2026, finding no licensed listings among those analyzed)
Top Performing Airbnb Properties in Torch Lake Township (2026)
Benchmark your potential! Explore examples of top-performing Airbnb properties in Torch Lake Townshipbased on Trailing Twelve Month (TTM) revenue. Analyze their characteristics, revenue, occupancy rate, and ADR to understand what drives success in this market.
Kemp's Resort - Lake Front Guest House
Entire Place • 2 bedrooms

*Private luxury oasis on Torch Lake - Escape now!*
Entire Place • 3 bedrooms
Golf in Luxury | Torch Lake Getaway at A-Ga-Ming
Entire Place • 4 bedrooms

Imogene's Torch Lake cottage, waterfront w/ dock
Entire Place • 4 bedrooms
Borealis Cabin on Portage
Entire Place • 2 bedrooms
Serene Lake Superior Cottage
Entire Place • 2 bedrooms
Note: Performance varies based on location, size, amenities, seasonality, and management quality. Data reflects the past 12 months.
Top Performing Airbnb Hosts in Torch Lake Township (2026)
Learn from the best! This table showcases top-performing Airbnb hosts in Torch Lake Township based on the number of properties managed and estimated total revenue over the past year. Analyze their scale and performance metrics.
| Host Name | Properties | Grossing Revenue | Stay Reviews | Avg Rating |
|---|---|---|---|---|
| Sandra | 1 | $101,935 | 18 | 4.94/5.0 |
| Mark | 3 | $91,261 | 181 | 4.96/5.0 |
| Jason | 1 | $76,027 | 156 | 4.92/5.0 |
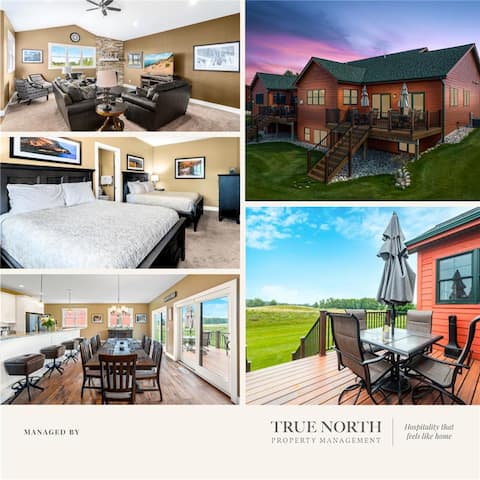
| Chris & The Team | TRUE NORTH | 1 | $66,051 | 63 | 4.90/5.0 |
| Peter | 2 | $65,679 | 30 | 4.88/5.0 |
| Kristi | 1 | $62,375 | 3 | 5.00/5.0 |
| Karen | 1 | $49,047 | 130 | 4.95/5.0 |
| Shannon | 1 | $46,311 | 86 | 5.00/5.0 |
| Becca | 1 | $45,084 | 12 | 4.92/5.0 |
| Jill | 1 | $40,663 | 135 | 4.99/5.0 |
Analyzing the strategies of top hosts, such as their property selection, pricing, and guest communication, can offer valuable lessons for optimizing your own Airbnb operations in Torch Lake Township.
Dive Deeper: Advanced Torch Lake Township STR Market Data (2026)
Ready to unlock more insights? AirROI provides access to advanced metrics and comprehensive Airbnb data for Torch Lake Township. Explore detailed analytics beyond this report to refine your investment strategy, optimize pricing, and maximize your vacation rental profits.
Explore Advanced MetricsTorch Lake Township Short-Term Rental Market Composition (2026): Property & Room Types
Room Type Distribution
Property Type Distribution
Market Composition Insights for Torch Lake Township
- The Torch Lake Township Airbnb market composition is heavily skewed towards Entire Home/Apt listings, which make up 100% of the 31 active rentals. This indicates strong guest preference for privacy and space.
- Looking at the property type distribution in Torch Lake Township, House properties are the most common (67.7%), reflecting the local real estate landscape.
- Houses represent a significant 67.7% portion, catering likely to families or larger groups.
- The presence of 6.5% Hotel/Boutique listings indicates integration with traditional hospitality.
Torch Lake Township Airbnb Room Capacity Analysis (2026): Bedroom Distribution
Distribution of Listings by Number of Bedrooms
Room Capacity Insights for Torch Lake Township
- The dominant room capacity in Torch Lake Township is 2 bedrooms listings, making up 38.7% of the market. This suggests a strong demand for properties suitable for couples or solo travelers.
- Together, 2 bedrooms and 3 bedrooms properties represent 71.0% of the active Airbnb listings in Torch Lake Township, indicating a high concentration in these sizes.
- A significant 48.4% of listings offer 3+ bedrooms, catering to larger groups and families seeking more space in Torch Lake Township.
Torch Lake Township Vacation Rental Guest Capacity Trends (2026)
Distribution of Listings by Guest Capacity
Guest Capacity Insights for Torch Lake Township
- The most common guest capacity trend in Torch Lake Township vacation rentals is listings accommodating 8+ guests (41.9%). This suggests the primary traveler segment is likely larger groups.
- Properties designed for 8+ guests and 6 guests dominate the Torch Lake Township STR market, accounting for 80.6% of listings.
- 83.8% of properties accommodate 6+ guests, serving the market segment for larger families or group travel in Torch Lake Township.
- On average, properties in Torch Lake Township are equipped to host 6.5 guests.
Torch Lake Township Airbnb Booking Patterns (2026): Available vs. Booked Days
Available Days Distribution
Booked Days Distribution
Booking Pattern Insights for Torch Lake Township
- The most common availability pattern in Torch Lake Township falls within the 271-366 days range, representing 45.2% of listings. This suggests many properties have significant open periods on their calendars.
- Approximately 87.1% of listings show high availability (181+ days open annually), indicating potential for increased bookings or specific owner usage patterns.
- For booked days, the 91-180 days range is most frequent in Torch Lake Township (38.7%), reflecting common guest stay durations or potential owner blocking patterns.
- A notable 16.1% of properties secure long booking periods (181+ days booked per year), highlighting successful long-term rental strategies or significant owner usage.
Torch Lake Township Airbnb Minimum Stay Requirements Analysis
Distribution of Listings by Minimum Night Requirement
1 Night
1 listings
3.2% of total
2 Nights
7 listings
22.6% of total
3 Nights
6 listings
19.4% of total
4-6 Nights
2 listings
6.5% of total
7-29 Nights
1 listings
3.2% of total
30+ Nights
14 listings
45.2% of total
Key Insights
- The most prevalent minimum stay requirement in Torch Lake Township is 30+ Nights, adopted by 45.2% of listings. This highlights the market's preference for longer commitments.
- A significant segment (45.2%) caters to monthly stays (30+ nights) in Torch Lake Township, pointing to opportunities in the extended-stay market.
Recommendations
- Align with the market by considering a 30+ Nights minimum stay, as 45.2% of Torch Lake Township hosts use this setting.
- If feasible, allowing 1-night stays, especially midweek or during low season, could capture last-minute bookings, as only 3.2% currently do.
- Explore offering discounts for stays of 30+ nights to attract the 45.2% of the market seeking extended stays.
- Adjust minimum nights based on seasonality – potentially shorter during low season and longer during peak demand periods in Torch Lake Township.
Torch Lake Township Airbnb Cancellation Policy Trends Analysis (2026)
Super Strict 60 Days
1 listings
3.2% of total
Flexible
5 listings
16.1% of total
Moderate
8 listings
25.8% of total
Firm
11 listings
35.5% of total
Strict
6 listings
19.4% of total
Cancellation Policy Insights for Torch Lake Township
- The prevailing Airbnb cancellation policy trend in Torch Lake Township is Firm, used by 35.5% of listings.
- A majority (54.9%) of hosts in Torch Lake Township utilize Firm or Strict policies, indicating a market where hosts prioritize booking security.
Recommendations for Hosts
- Consider adopting a Firm policy to align with the 35.5% market standard in Torch Lake Township.
- Regularly review your cancellation policy against competitors and market demand shifts in Torch Lake Township.
Torch Lake Township STR Booking Lead Time Analysis (2026)
Average Booking Lead Time by Month
Booking Lead Time Insights for Torch Lake Township
- The overall average booking lead time for vacation rentals in Torch Lake Township is 79 days.
- Guests book furthest in advance for stays during April (average 135 days), likely coinciding with peak travel demand or local events.
- The shortest booking windows occur for stays in January (average 19 days), indicating more last-minute travel plans during this time.
- Seasonally, Summer (112 days avg.) sees the longest lead times, while Winter (27 days avg.) has the shortest, reflecting typical travel planning cycles.
Recommendations for Hosts
- Use the overall average lead time (79 days) as a baseline for your pricing and availability strategy in Torch Lake Township.
- For April stays, consider implementing length-of-stay discounts or slightly higher rates for bookings made less than 135 days out to capitalize on advance planning.
- Target marketing efforts for the Summer season well in advance (at least 112 days) to capture early planners.
- Monitor your own booking lead times against these Torch Lake Township averages to identify opportunities for dynamic pricing adjustments.
Popular & Essential Airbnb Amenities in Torch Lake Township (2026)
Amenity Prevalence
Amenity Insights for Torch Lake Township
- Essential amenities in Torch Lake Township that guests expect include: Heating, Kitchen, Hot water, Smoke alarm, Free parking on premises. Lacking these (any) could significantly impact bookings.
- Popular amenities like Dishes and silverware, Coffee maker, Refrigerator are common but not universal. Offering these can provide a competitive edge.
Recommendations for Hosts
- Ensure your listing includes all essential amenities for Torch Lake Township: Heating, Kitchen, Hot water, Smoke alarm, Free parking on premises.
- Prioritize adding missing essentials: Smoke alarm, Free parking on premises.
- Consider adding popular differentiators like Dishes and silverware or Coffee maker to increase appeal.
- Highlight unique or less common amenities you offer (e.g., hot tub, dedicated workspace, EV charger) in your listing description and photos.
- Regularly check competitor amenities in Torch Lake Township to stay competitive.
Torch Lake Township Airbnb Guest Demographics & Profile Analysis (2026)
Guest Profile Summary for Torch Lake Township
- The typical guest profile for Airbnb in Torch Lake Township consists of primarily domestic travelers (99%), often arriving from nearby Madison, typically belonging to the Post-2000s (Gen Z/Alpha) group (50%), primarily speaking English or Spanish.
- Domestic travelers account for 99.4% of guests.
- Key international markets include United States (99.4%) and Michigan (0.6%).
- Top languages spoken are English (75%) followed by Spanish (8.3%).
- A significant demographic segment is the Post-2000s (Gen Z/Alpha) group, representing 50% of guests.
Recommendations for Hosts
- Target domestic marketing efforts towards travelers from Madison and Minneapolis.
- Tailor amenities and listing descriptions to appeal to the dominant Post-2000s (Gen Z/Alpha) demographic (e.g., highlight fast WiFi, smart home features, local guides).
- Highlight unique local experiences or amenities relevant to the primary guest profile.
- Consider seasonal promotions aligned with peak travel times for key origin markets.
Nearby Short-Term Rental Market Comparison
How does the Torch Lake Township Airbnb market stack up against its neighbors? Compare key performance metrics like average monthly revenue, ADR, and occupancy rates in surrounding areas to understand the broader regional STR landscape.
| Market | Active Properties | Monthly Revenue | Daily Rate | Avg. Occupancy |
|---|---|---|---|---|
| Rowleys Bay | 19 | $5,182 | $416.60 | 48% |
| Town of Liberty Grove | 55 | $4,774 | $402.24 | 50% |
| Sister Bay | 97 | $4,681 | $428.67 | 45% |
| Town of Egg Harbor | 41 | $4,616 | $362.18 | 45% |
| Marquette Township | 17 | $4,413 | $325.95 | 49% |
| Egg Harbor | 88 | $4,295 | $437.95 | 44% |
| Allouez Township | 17 | $4,163 | $348.24 | 44% |
| Fish Creek | 79 | $4,054 | $385.59 | 45% |
| Ellison Bay | 23 | $3,948 | $376.94 | 44% |
| Onota Township | 17 | $3,890 | $300.80 | 55% |