Condon Airbnb Market Analysis 2026: Short Term Rental Data & Vacation Rental Statistics in Montana, United States
Is Airbnb profitable in Condon in 2026? Explore comprehensive Airbnb analytics for Condon, Montana, United States to uncover income potential. This 2026 STR market report for Condon, based on AirROI data from July 2024 to June 2025, reveals key trends in the niche market of 19 active listings.
Whether you're considering an Airbnb investment in Condon, optimizing your existing vacation rental, or exploring rental arbitrage opportunities, understanding the Condon Airbnb data is crucial. Leveraging the low regulation environment is key to maximizing your short term rental income potential. Let's dive into the specifics.
Key Condon Airbnb Performance Metrics Overview
Monthly Airbnb Revenue Variations & Income Potential in Condon (2026)
Understanding the monthly revenue variations for Airbnb listings in Condon is key to maximizing your short term rental income potential. Seasonality significantly impacts earnings. Our analysis, based on data from the past 12 months, shows that the peak revenue month for STRs in Condon is typically March, while January often presents the lowest earnings, highlighting opportunities for strategic pricing adjustments during shoulder and low seasons. Explore the typical Airbnb income in Condon across different performance tiers:
- Best-in-class properties (Top 10%) achieve $4,101+ monthly, often utilizing dynamic pricing and superior guest experiences.
- Strong performing properties (Top 25%) earn $2,682 or more, indicating effective management and desirable locations/amenities.
- Typical properties (Median) generate around $1,377 per month, representing the average market performance.
- Entry-level properties (Bottom 25%) see earnings around $594, often with potential for optimization.
Average Monthly Airbnb Earnings Trend in Condon
Condon Airbnb Occupancy Rate Trends (2026)
Maximize your bookings by understanding the Condon STR occupancy trends. Seasonal demand shifts significantly influence how often properties are booked. Typically, Julysees the highest demand (peak season occupancy), while April experiences the lowest (low season). Effective strategies, like adjusting minimum stays or offering promotions, can boost occupancy during slower periods. Here's how different property tiers perform in Condon:
- Best-in-class properties (Top 10%) achieve 48%+ occupancy, indicating high desirability and potentially optimized availability.
- Strong performing properties (Top 25%) maintain 34% or higher occupancy, suggesting good market fit and guest satisfaction.
- Typical properties (Median) have an occupancy rate around 21%.
- Entry-level properties (Bottom 25%) average 9% occupancy, potentially facing higher vacancy.
Average Monthly Occupancy Rate Trend in Condon
Average Daily Rate (ADR) Airbnb Trends in Condon (2026)
Effective short term rental pricing strategy in Condon involves understanding monthly ADR fluctuations. The Average Daily Rate (ADR) for Airbnb in Condon typically peaks in June and dips lowest during January. Leveraging Airbnb dynamic pricing tools or strategies based on this seasonality can significantly boost revenue. Here's a look at the typical nightly rates achieved:
- Best-in-class properties (Top 10%) command rates of $472+ per night, often due to premium features or locations.
- Strong performing properties (Top 25%) achieve nightly rates of $246 or more.
- Typical properties (Median) charge around $177 per night.
- Entry-level properties (Bottom 25%) earn around $143 per night.
Average Daily Rate (ADR) Trend by Month in Condon
Get Live Condon Market Intelligence 👇

Explore Real-time Analytics
Airbnb Seasonality Analysis & Trends in Condon (2025)
Peak Season (March, July, June)
- Revenue averages $3,358 per month
- Occupancy rates average 37.8%
- Daily rates average $242
Shoulder Season
- Revenue averages $1,704 per month
- Occupancy maintains around 23.3%
- Daily rates hold near $225
Low Season (January, April, October)
- Revenue drops to average $723 per month
- Occupancy decreases to average 13.7%
- Daily rates adjust to average $214
Seasonality Insights for Condon
- The Airbnb seasonality in Condon shows highly seasonal trends requiring careful strategy. While the sections above show seasonal averages, it's also insightful to look at the extremes:
- During the high season, the absolute peak month showcases Condon's highest earning potential, with monthly revenues capable of climbing to $4,071, occupancy reaching a high of 51.3%, and ADRs peaking at $269.
- Conversely, the slowest single month of the year, typically falling within the low season, marks the market's lowest point. In this month, revenue might dip to $610, occupancy could drop to 12.0%, and ADRs may adjust down to $205.
- Understanding both the seasonal averages and these monthly peaks and troughs in revenue, occupancy, and ADR is crucial for maximizing your Airbnb profit potential in Condon.
Seasonal Strategies for Maximizing Profit
- Peak Season: Maximize revenue through premium pricing and potentially longer minimum stays. Ensure high availability.
- Low Season: Offer competitive pricing, special promotions (e.g., extended stay discounts), and flexible cancellation policies. Target off-season travelers like remote workers or budget-conscious guests.
- Shoulder Seasons: Implement dynamic pricing that balances peak and low rates. Target weekend travelers or specific events. Offer slightly more flexible terms than peak season.
- Regularly analyze your own performance against these Condon seasonality benchmarks and adjust your pricing and availability strategy accordingly.
Best Areas for Airbnb Investment in Condon (2026)
Exploring the top neighborhoods for short-term rentals in Condon? This section highlights key areas, outlining why they are attractive for hosts and guests, along with notable local attractions. Consider these locations based on your target guest profile and investment strategy.
| Neighborhood / Area | Why Host Here? (Target Guests & Appeal) | Key Attractions & Landmarks |
|---|---|---|
| Downtown Condon | A central location that provides easy access to local shops, restaurants, and the community vibe. Ideal for visitors looking for a small-town experience with charming amenities. | Condon Mill, Local Parks, Community Events, Nearby Hiking Trails, Cozy Cafes |
| Seeley Lake | A nearby lake town known for its outdoor recreation, particularly water sports and hiking. Attracts tourists in summer for lake activities and winter for snow sports. | Seeley Lake, Blackfoot Pathway, Fishing, Hiking Trails, Winter Sports |
| Flathead Lake | One of the largest natural lakes in the area, offering stunning views and recreational activities. Great for families and nature lovers looking for waterfront stay options. | Flathead Lake State Park, Fishing, Boating, Swimming, Scenic Views |
| Bob Marshall Wilderness | A premier wild area for adventure seekers. Attracts outdoor enthusiasts year-round for hiking, camping, and wildlife watching. | Hiking Trails, Wildlife Viewing, Camping, Fishing, Scenic Landscapes |
| Pintler Wilderness | This remote and beautiful area is perfect for those who enjoy tranquility and nature. It appeals to very adventurous travelers. | Hiking, Fishing, Backpacking, Waterfalls, Scenic Trails |
| Camas Prairie | Known for its beautiful landscapes and seasonal wildflower blooms, this area attracts visitors interested in nature and relaxation. | Hiking Spots, Wildflower Viewing, Photographic Opportunities, Bird Watching, Scenic Drives |
| Mission Mountains | This mountainous region offers incredible views and is popular for campers, hikers, and those looking for a rustic getaway. | Hiking Trails, Camping Sites, Wildlife, Scenic Peaks, Fishing |
| Bigfork | A charming small town with a vibrant arts scene near Flathead Lake, appealing to visitors looking for culture combined with lake recreation. | Bigfork Summer Playhouse, Art Galleries, Biking Trails, Dining by the Lake, Flathead Lake |
Understanding Airbnb License Requirements & STR Laws in Condon (2026)
While Condon, Montana, United States currently shows low STR regulations, specific Airbnb license requirements might still exist or change. Always verify the latest short term rental regulations and Airbnb license requirements directly with local government authorities for Condon to ensure full compliance before hosting.
(Source: AirROI data, 2026, finding no licensed listings among those analyzed)
Top Performing Airbnb Properties in Condon (2026)
Benchmark your potential! Explore examples of top-performing Airbnb properties in Condonbased on Trailing Twelve Month (TTM) revenue. Analyze their characteristics, revenue, occupancy rate, and ADR to understand what drives success in this market.

Luxury Home with Mtn Views!
Entire Place • 4 bedrooms

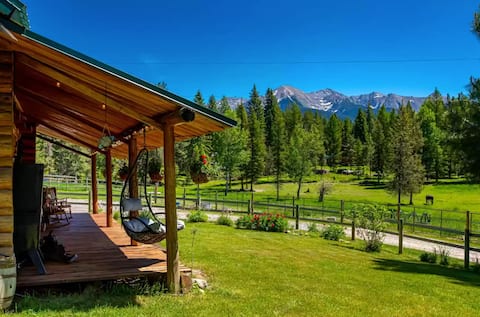
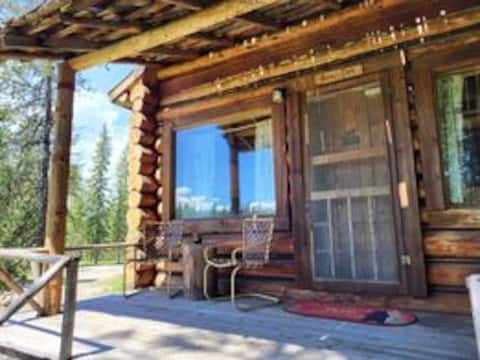
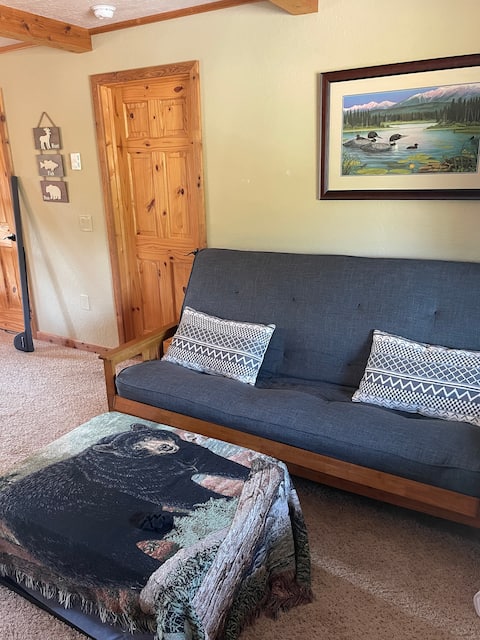
Swan Valley Log Cabin with Stunning Mountain Views
Entire Place • 2 bedrooms
Explorers paradise, Swan & Mission Mountains
Entire Place • 3 bedrooms

The River House Wedding & Event Venue
Entire Place • 4 bedrooms
"Bears Den" cozy cabin nestled in the pines.
Entire Place • 3 bedrooms
Coziest Condo in the Swan Valley
Entire Place • 1 bedroom
Note: Performance varies based on location, size, amenities, seasonality, and management quality. Data reflects the past 12 months.
Top Performing Airbnb Hosts in Condon (2026)
Learn from the best! This table showcases top-performing Airbnb hosts in Condon based on the number of properties managed and estimated total revenue over the past year. Analyze their scale and performance metrics.
| Host Name | Properties | Grossing Revenue | Stay Reviews | Avg Rating |
|---|---|---|---|---|
| Barbara | 5 | $43,248 | 300 | 4.83/5.0 |
| Liz | 1 | $41,561 | 9 | 5.00/5.0 |
| Lyndsey | 1 | $30,814 | 112 | 4.87/5.0 |
| Elizabeth | 1 | $25,588 | 29 | 4.90/5.0 |
| Donna | 1 | $22,236 | 10 | 5.00/5.0 |
| Josie | 2 | $12,108 | 74 | 4.88/5.0 |
| Michael | 1 | $11,547 | 49 | 4.86/5.0 |
| Ann | 2 | $9,360 | 110 | 4.92/5.0 |
| Brian | 1 | $9,248 | 13 | 5.00/5.0 |
| Elsie | 3 | $5,492 | 15 | 4.61/5.0 |
Analyzing the strategies of top hosts, such as their property selection, pricing, and guest communication, can offer valuable lessons for optimizing your own Airbnb operations in Condon.
Dive Deeper: Advanced Condon STR Market Data (2026)
Ready to unlock more insights? AirROI provides access to advanced metrics and comprehensive Airbnb data for Condon. Explore detailed analytics beyond this report to refine your investment strategy, optimize pricing, and maximize your vacation rental profits.
Explore Advanced MetricsCondon Short-Term Rental Market Composition (2026): Property & Room Types
Room Type Distribution
Property Type Distribution
Market Composition Insights for Condon
- The Condon Airbnb market composition is heavily skewed towards Entire Home/Apt listings, which make up 94.7% of the 19 active rentals. This indicates strong guest preference for privacy and space.
- Looking at the property type distribution in Condon, Outdoor/Unique properties are the most common (63.2%), reflecting the local real estate landscape.
Condon Airbnb Room Capacity Analysis (2026): Bedroom Distribution
Distribution of Listings by Number of Bedrooms
Room Capacity Insights for Condon
- The dominant room capacity in Condon is 1 bedroom listings, making up 36.8% of the market. This suggests a strong demand for properties suitable for couples or solo travelers.
- Together, 1 bedroom and 3 bedrooms properties represent 63.1% of the active Airbnb listings in Condon, indicating a high concentration in these sizes.
- A significant 42.1% of listings offer 3+ bedrooms, catering to larger groups and families seeking more space in Condon.
Condon Vacation Rental Guest Capacity Trends (2026)
Distribution of Listings by Guest Capacity
Guest Capacity Insights for Condon
- The most common guest capacity trend in Condon vacation rentals is listings accommodating 6 guests (31.6%). This suggests the primary traveler segment is likely larger groups.
- Properties designed for 6 guests and 2 guests dominate the Condon STR market, accounting for 52.7% of listings.
- 52.7% of properties accommodate 6+ guests, serving the market segment for larger families or group travel in Condon.
- On average, properties in Condon are equipped to host 5.1 guests.
Condon Airbnb Booking Patterns (2026): Available vs. Booked Days
Available Days Distribution
Booked Days Distribution
Booking Pattern Insights for Condon
- The most common availability pattern in Condon falls within the 271-366 days range, representing 89.5% of listings. This suggests many properties have significant open periods on their calendars.
- Approximately 100.0% of listings show high availability (181+ days open annually), indicating potential for increased bookings or specific owner usage patterns.
- For booked days, the 31-90 days range is most frequent in Condon (47.4%), reflecting common guest stay durations or potential owner blocking patterns.
Condon Airbnb Minimum Stay Requirements Analysis
Distribution of Listings by Minimum Night Requirement
1 Night
8 listings
44.4% of total
2 Nights
8 listings
44.4% of total
4-6 Nights
2 listings
11.1% of total
Key Insights
- The most prevalent minimum stay requirement in Condon is 1 Night, adopted by 44.4% of listings. This highlights the market's preference for shorter, flexible bookings.
- A strong majority (88.8%) of the Condon Airbnb data shows acceptance of very short stays (1-2 nights), indicating a dynamic, high-turnover market.
Recommendations
- Align with the market by considering a 1 Night minimum stay, as 44.4% of Condon hosts use this setting.
- Adjust minimum nights based on seasonality – potentially shorter during low season and longer during peak demand periods in Condon.
Condon Airbnb Cancellation Policy Trends Analysis (2026)
Flexible
7 listings
36.8% of total
Moderate
2 listings
10.5% of total
Firm
4 listings
21.1% of total
Strict
6 listings
31.6% of total
Cancellation Policy Insights for Condon
- The prevailing Airbnb cancellation policy trend in Condon is Flexible, used by 36.8% of listings.
- A majority (52.7%) of hosts in Condon utilize Firm or Strict policies, indicating a market where hosts prioritize booking security.
Recommendations for Hosts
- Consider adopting a Flexible policy to align with the 36.8% market standard in Condon.
- With 31.6% using Strict terms, this is a viable option in Condon, particularly for high-value properties or during peak demand periods.
- Regularly review your cancellation policy against competitors and market demand shifts in Condon.
Condon STR Booking Lead Time Analysis (2026)
Average Booking Lead Time by Month
Booking Lead Time Insights for Condon
- The overall average booking lead time for vacation rentals in Condon is 44 days.
- Guests book furthest in advance for stays during December (average 96 days), likely coinciding with peak travel demand or local events.
- The shortest booking windows occur for stays in April (average 19 days), indicating more last-minute travel plans during this time.
- Seasonally, Summer (60 days avg.) sees the longest lead times, while Spring (37 days avg.) has the shortest, reflecting typical travel planning cycles.
Recommendations for Hosts
- Use the overall average lead time (44 days) as a baseline for your pricing and availability strategy in Condon.
- For December stays, consider implementing length-of-stay discounts or slightly higher rates for bookings made less than 96 days out to capitalize on advance planning.
- Target marketing efforts for the Summer season well in advance (at least 60 days) to capture early planners.
- Monitor your own booking lead times against these Condon averages to identify opportunities for dynamic pricing adjustments.
Popular & Essential Airbnb Amenities in Condon (2026)
Amenity data is currently unavailable for Condon.
Condon Airbnb Guest Demographics & Profile Analysis (2026)
Guest Profile Summary for Condon
- The typical guest profile for Airbnb in Condon consists of primarily domestic travelers (99%), often arriving from nearby Missoula, typically belonging to the Post-2000s (Gen Z/Alpha) group (50%), primarily speaking English or French.
- Domestic travelers account for 98.6% of guests.
- Key international markets include United States (98.6%) and Canada (1.4%).
- Top languages spoken are English (94.1%) followed by French (5.9%).
- A significant demographic segment is the Post-2000s (Gen Z/Alpha) group, representing 50% of guests.
Recommendations for Hosts
- Target domestic marketing efforts towards travelers from Missoula and Helena.
- Tailor amenities and listing descriptions to appeal to the dominant Post-2000s (Gen Z/Alpha) demographic (e.g., highlight fast WiFi, smart home features, local guides).
- Highlight unique local experiences or amenities relevant to the primary guest profile.
- Consider seasonal promotions aligned with peak travel times for key origin markets.
Nearby Short-Term Rental Market Comparison
How does the Condon Airbnb market stack up against its neighbors? Compare key performance metrics like average monthly revenue, ADR, and occupancy rates in surrounding areas to understand the broader regional STR landscape.
| Market | Active Properties | Monthly Revenue | Daily Rate | Avg. Occupancy |
|---|---|---|---|---|
| West Glacier | 81 | $3,848 | $426.28 | 54% |
| Rollins | 19 | $3,496 | $627.27 | 48% |
| Whitefish | 1,005 | $3,487 | $418.65 | 40% |
| Lakeside | 126 | $3,097 | $396.03 | 43% |
| Missoula County | 19 | $3,076 | $392.93 | 37% |
| Superior | 31 | $3,069 | $390.76 | 41% |
| Dayton | 16 | $2,974 | $398.23 | 48% |
| Babb | 57 | $2,952 | $277.20 | 60% |
| Somers | 73 | $2,786 | $354.29 | 44% |
| Victor | 20 | $2,683 | $254.42 | 43% |