Las Vegas, Nevada Airbnb Market Data 2026: STR Report & Statistics
How much can you earn on Airbnb in Las Vegas, Nevada? Based on AirROI's 2026 dataset (July 2025 – June 2026), the short answer is $25,789 per year — at a $264 nightly rate, 39.1% occupancy, and a $104 RevPAR that reflects moderate rate-to-revenue efficiency with room to optimize.
Las Vegas's 4,389 active listings and moderate demand with room for well-positioned listings to outperform make it a major short-term rental market. Supply grew 99.9% and nightly rates have risen, creating an environment where the most bookable listings stand to capture outsized share. Hosts who pair competitive pricing with strong guest experience are well-positioned to convert the growing traveler base into consistent bookings.
Regulation is high, and hosts should factor licensing costs and compliance timelines into their launch plan. For data-driven hosts, the opportunity lies in reading these signals and positioning accordingly.

Table of Contents [hide] [show]
What Are the Key Airbnb Metrics in Las Vegas?
In Las Vegas, the headline Airbnb metrics are $25,789 in average annual revenue,39.1% occupancy, $264 ADR, and $104 in RevPAR, and guests book about 40 days in advance.
How Much Do Airbnb Hosts Earn Monthly in Las Vegas?
Understanding the monthly revenue variations for Airbnb listings in Las Vegas is key to maximizing your short term rental income potential. Seasonality significantly impacts earnings. Our analysis, based on data from the past 12 months, shows that the peak revenue month for STRs in Las Vegas is typically March, while February often presents the lowest earnings, highlighting opportunities for strategic pricing adjustments during shoulder and low seasons. Explore the typical Airbnb income in Las Vegas across different performance tiers:
- Best-in-class properties (Top 10%) achieve $8,122+ monthly, often utilizing dynamic pricing and superior guest experiences.
- Strong performing properties (Top 25%) earn $4,828 or more, indicating effective management and desirable locations/amenities.
- Typical properties (Median) generate around $2,443 per month, representing the average market performance.
- Entry-level properties (Bottom 25%) see earnings around $1,032, often with potential for optimization.
Average Monthly Airbnb Earnings Trend in Las Vegas
What Is the Monthly Airbnb Occupancy Rate in Las Vegas?
Maximize your bookings by understanding the Las Vegas STR occupancy trends. Seasonal demand shifts significantly influence how often properties are booked. Typically, Marchsees the highest demand (peak season occupancy), while June experiences the lowest (low season). Effective strategies, like adjusting minimum stays or offering promotions, can boost occupancy during slower periods. Here's how different property tiers perform in Las Vegas:
- Best-in-class properties (Top 10%) achieve 78%+ occupancy, indicating high desirability and potentially optimized availability.
- Strong performing properties (Top 25%) maintain 62% or higher occupancy, suggesting good market fit and guest satisfaction.
- Typical properties (Median) have an occupancy rate around 40%.
- Entry-level properties (Bottom 25%) average 21% occupancy, potentially facing higher vacancy.
Average Monthly Occupancy Rate Trend in Las Vegas
What Is the Average Airbnb Nightly Rate in Las Vegas?
Effective short term rental pricing strategy in Las Vegas involves understanding monthly ADR fluctuations. The Average Daily Rate (ADR) for Airbnb in Las Vegas typically peaks in May and dips lowest during August. Leveraging Airbnb dynamic pricing tools or strategies based on this seasonality can significantly boost revenue. Here's a look at the typical nightly rates achieved:
- Best-in-class properties (Top 10%) command rates of $493+ per night, often due to premium features or locations.
- Strong performing properties (Top 25%) achieve nightly rates of $314 or more.
- Typical properties (Median) charge around $186 per night.
- Entry-level properties (Bottom 25%) earn around $97 per night.
Average Daily Rate (ADR) Trend by Month in Las Vegas
What Is the RevPAR for Airbnb in Las Vegas?
RevPAR in Las Vegas is currently $104. Because RevPAR combines nightly rates with realized occupancy, it is one of the cleanest ways to compare how efficiently listings turn demand into revenue across the market.
- Entry-level properties (Bottom 25%) see $34 RevPAR.
- Typical properties (Median) generate $72 RevPAR.
- Strong performers (Top 25%) earn $135 RevPAR.
- Best-in-class (Top 10%) achieve $226 RevPAR.
Average Monthly RevPAR Trend in Las Vegas
RevPAR Insights for Las Vegas
- The average RevPAR in Las Vegas is $104. This metric combines nightly rates with realized occupancy, making it one of the best single-number indicators of market efficiency.
- The gap between the top 10% ($226) and bottom 25% ($34) is $192, indicating significant performance disparity driven by property quality, pricing strategy, and location.
- RevPAR peaks in Mar and bottoms out in Jun, mirroring the broader seasonal demand pattern and suggesting opportunities for dynamic pricing.
Recommendations for Hosts
- Track your own RevPAR monthly against these Las Vegas benchmarks. If your RevPAR falls below the median of $72, examine whether low occupancy or low ADR is the primary drag.
- Top-quartile listings achieve $135+ RevPAR through a combination of competitive pricing, strong reviews, and strategic amenities. Target this tier through incremental improvements.
- Use RevPAR rather than revenue alone when comparing properties of different sizes — it normalizes for available nights and gives a more accurate picture of performance.
Get Live Las Vegas Market Intelligence 👇
Explore Real-time Analytics
When Is the Peak Season for Airbnb in Las Vegas?
Las Vegas's peak Airbnb season falls in March, May, October, while the softest stretch is February, June, September. Overall, the market shows moderate seasonality with distinct peak and low periods, which should guide pricing, minimum stays, and cash-flow planning.
Peak Season (March, May, October)
- Revenue averages $4,209 per month
- Occupancy rates average 44.7%
- Daily rates average $268
Shoulder Season
- Revenue averages $3,617 per month
- Occupancy maintains around 42.8%
- Daily rates hold near $246
Low Season (February, June, September)
- Revenue drops to average $3,137 per month
- Occupancy decreases to average 38.0%
- Daily rates adjust to average $254
Seasonality Insights for Las Vegas
- The Airbnb seasonality pattern in Las Vegas shows moderate seasonality with distinct peak and low periods. While the sections above show seasonal averages, it is also insightful to look at the extremes:
- During the high season, the absolute peak month showcases Las Vegas's highest earning potential, with monthly revenues climbing to $4,427, occupancy reaching 47.9%, and ADRs peaking at $288.
- Conversely, the slowest single month marks the market's lowest point — revenue may dip to $3,095, occupancy could drop to 34.1%, and ADRs may adjust to $234.
- Understanding both the seasonal averages and these monthly peaks and troughs in revenue, occupancy, and ADR is crucial for maximizing your Airbnb profit potential in Las Vegas.
Seasonal Strategies for Maximizing Profit
- Peak Season: Maximize revenue through premium pricing. In a high-regulation market like Las Vegas, ensure your permit covers the number of nights you plan to book — some jurisdictions cap annual rental days.
- Low Season: Offer competitive pricing, extended-stay discounts, and flexible cancellation policies. Target off-season travelers like remote workers, budget-conscious guests, and travelers with flexible schedules.
- Shoulder Seasons: Implement dynamic pricing that bridges peak and low rates. Target weekend travelers, local events, and business visitors. Slightly more flexible terms than peak season can help maintain occupancy without deep discounting.
- Regularly analyze your own performance against these Las Vegas seasonality benchmarks and adjust your pricing and availability strategy accordingly.
Do You Need a License for Airbnb in Las Vegas?
Las Vegas, Nevada, United States has a high regulation classification, yet only 40% of listings show registration evidence. That gap between regulation on the books and compliance on the ground can shift quickly — municipalities often tighten enforcement in waves, putting unregistered operators at risk of fines or delisting. Always verify the latest short-term rental regulations and Airbnb license requirements directly with local government authorities for Las Vegas to ensure full compliance before hosting.
(Source: AirROI data, 2026, based on 40% licensed listings)
What Are the Best Neighborhoods for Airbnb in Las Vegas?
In a large, heavily regulated market like Las Vegas, neighborhood selection is one of the strongest levers for Airbnb investment performance. Zoning rules, permitting availability, and guest demand patterns can vary block by block. The 8 neighborhoods below represent areas where short-term rental activity concentrates — understanding why each one attracts guests and hosts helps investors evaluate where their property type and budget fit best.
| Neighborhood / Area | Why Host Here? (Target Guests & Appeal) | Key Attractions & Landmarks |
|---|---|---|
| The Strip | The iconic Las Vegas Strip, known for its vibrant nightlife, casinos, and entertainment options. A prime location for tourists looking for world-class hotels, restaurants, and shows. | Bellagio Fountains, Caesars Palace, The Venetian, Excalibur, High Roller Observation Wheel |
| Downtown Las Vegas | A revitalized area featuring a mix of classic casinos and modern attractions. Popular for its arts scene, nightlife, and the famous Fremont Street Experience. | Fremont Street Experience, The Mob Museum, Neon Boneyard, Downtown Container Park, Circa Resort & Casino |
| Summerlin | A suburban haven with beautiful homes, parks, and golf courses. Great for families and visitors looking for a quieter experience close to nature and local dining. | Red Rock Canyon, The Summerlin Library, Downtown Summerlin, Tivoli Village, Summerlin Farmers Market |
| Henderson | A family-friendly suburb of Las Vegas offering a variety of outdoor activities and parks. Ideal for visitors seeking a balance of urban and natural experiences. | Lake Mead, Eldorado Canyon, M Resort Spa Casino, Henderson Bird Viewing Preserve, The District at Green Valley Ranch |
| Peccole Ranch | A picturesque neighborhood featuring lush greenery and walking trails. Appeals to those looking for a serene environment within the city limits. | Peccole Ranch Park, Desert Breeze Park, Parks and Trails, St. Rose Dominican Hospital, Local Shopping Centers |
| Paradise | An area adjacent to the Strip that offers a mix of accommodations and local dining options. A great choice for those wanting proximity to the action without the immersive tourist environment. | UNLV, Thomas & Mack Center, Las Vegas Convention Center, McCarran International Airport, Lied Robotics Building |
| Spring Valley | Known for its diverse community and variety of local restaurants. Provides a more local flavor of Las Vegas while still being close to many attractions. | Spring Valley Library, Desert Breeze Park, Rainbow Promenade, Local Dining Options, Shopping Centers |
| Enterprise | This neighborhood is home to the south end of the Strip and is developing rapidly, known for its proximity to shopping and dining, making it attractive for short-term rentals. | Las Vegas Premium Outlets, Wildhorse Golf Club, Casino Gaming, Local Parks, Restaurants |
Because Las Vegas has a high regulation profile, confirming that short-term rental permits are available in your target neighborhood is a critical first step before committing to a property purchase. Regulation can vary at the neighborhood or district level even within the same city.
What Types of Properties Are on Airbnb in Las Vegas?
Room Type Distribution
Property Type Distribution
Market Composition Insights for Las Vegas
- The Las Vegas Airbnb market composition is heavily skewed towards Entire Home/Apt listings, which make up 79.6% of the 4,389 active rentals. This indicates strong guest preference for privacy and space.
- Looking at the property type distribution in Las Vegas, House properties are the most common (59.6%), reflecting the local real estate landscape.
- Houses represent a significant 59.6% portion, catering likely to families or larger groups.
- The presence of 10.4% Hotel/Boutique listings indicates integration with traditional hospitality.
- Smaller segments like others, outdoor/unique, unique stays (combined 3.0%) offer potential for unique stay experiences.
Las Vegas Airbnb Room Capacity Analysis (2026): Bedroom Distribution
Distribution of Listings by Number of Bedrooms
Room Capacity Insights for Las Vegas
- The dominant room capacity in Las Vegas is 1 bedroom listings, making up 26.8% of the market. This suggests a strong demand for properties suitable for couples or solo travelers.
- Together, 1 bedroom and 2 bedrooms properties represent 42.1% of the active Airbnb listings in Las Vegas, indicating a high concentration in these sizes.
- A significant 41.7% of listings offer 3+ bedrooms, catering to larger groups and families seeking more space in Las Vegas.
Las Vegas Vacation Rental Guest Capacity Trends (2026)
Distribution of Listings by Guest Capacity
Guest Capacity Insights for Las Vegas
- The most common guest capacity trend in Las Vegas vacation rentals is listings accommodating 8+ guests (36.1%). This suggests the primary traveler segment is likely larger groups.
- Properties designed for 8+ guests and 4 guests dominate the Las Vegas STR market, accounting for 54.3% of listings.
- 50.1% of properties accommodate 6+ guests, serving the market segment for larger families or group travel in Las Vegas.
- On average, properties in Las Vegas are equipped to host 5.0 guests.
How Do Listings in Las Vegas Compare on Quality?
Listing quality in Las Vegas can be approximated through presentation depth, bedroom count, and how often hosts disclose exact locations. These signals show how professionally the local supply base is merchandised.
Listing Quality Insights for Las Vegas
- At 31.1 photos per listing on average, Las Vegas hosts invest well in visual presentation. Listings with 20+ photos consistently outperform in search ranking and conversion.
- 19.1% of listings show their exact location. Lower disclosure rates can increase booking hesitation — guests want to know exactly where they are staying.
Recommendations for Hosts
- Enable exact location if possible — it removes a common source of guest uncertainty and can improve your listing's position in map-based searches.
- Use these quality indicators as a self-audit checklist. Listings that exceed the Las Vegas averages across all three metrics are better positioned for premium pricing.
What Amenities Do Airbnb Guests Expect in Las Vegas?
Amenity Prevalence
Amenity Insights for Las Vegas
- Essential amenities in Las Vegas that guests expect include: Wifi, Air conditioning, Smoke alarm, TV. Lacking these (any) could significantly impact bookings.
- Popular amenities like Heating, Free parking on premises, Kitchen are common but not universal. Offering these can provide a competitive edge.
Recommendations for Hosts
- Ensure your listing includes all essential amenities for Las Vegas: Wifi, Air conditioning, Smoke alarm, TV.
- Prioritize adding missing essentials: Wifi, Air conditioning, Smoke alarm, TV.
- Consider adding popular differentiators like Heating or Free parking on premises to increase appeal.
- Highlight unique or less common amenities you offer (e.g., hot tub, dedicated workspace, EV charger) in your listing description and photos.
- Regularly check competitor amenities in Las Vegas to stay competitive.
Which Airbnb Amenities Boost Revenue in Las Vegas?
Not every amenity matters equally. This table focuses on the amenities most associated with higher revenue in Las Vegas, which makes it more useful for prioritizing upgrades than a simple popularity list alone.
| Amenity | Prevalence | Revenue With | Revenue Without | Revenue Uplift |
|---|---|---|---|---|
TV | 96.4% | $26,594 | $4,363 | 509.5% |
Batting cageHigh opportunity | 0.1% | $106,176 | $25,679 | 313.5% |
Heating | 91.7% | $27,442 | $7,564 | 262.8% |
KayakHigh opportunity | 0.3% | $78,947 | $25,606 | 208.3% |
WaterfrontHigh opportunity | 0.5% | $75,163 | $25,551 | 194.2% |
Theme roomHigh opportunity | 2.6% | $70,863 | $24,587 | 188.2% |
Mini golfHigh opportunity | 3.1% | $68,937 | $24,388 | 182.7% |
Kitchen | 88.8% | $27,782 | $10,000 | 177.8% |
Laser tagHigh opportunity | 0.3% | $70,985 | $25,665 | 176.6% |
Children's playroomHigh opportunity | 1.9% | $68,682 | $24,942 | 175.4% |
Revenue Impact Insights for Las Vegas
- TV tops the revenue impact list with a 509.5% uplift — listings with this amenity earn $26,594 vs. $4,363 without it.
- High-opportunity amenities — Batting cage, Kayak, Waterfront — combine revenue uplift above 100% with prevalence under 10%, meaning most competitors haven't adopted them yet.
- TV, Heating, Kitchen — while widespread — still correlate with meaningful revenue gains, making them table stakes rather than true differentiators.
Recommendations for Hosts
- Prioritize adding Batting cage — it has the best combination of high revenue impact and low market saturation in Las Vegas.
- Focus your upgrade budget on amenities in the top half of this table. Below-median amenities may improve guest experience but contribute less to revenue growth.
- Highlight revenue-impacting amenities prominently in your listing title, photos, and description — guests can't value what they don't notice.
Dive Deeper: Advanced Las Vegas STR Market Data (2026)
Ready to unlock more insights? AirROI provides access to advanced metrics and comprehensive Airbnb data for Las Vegas. Explore detailed analytics beyond this report to refine your investment strategy, optimize pricing, and maximize your vacation rental profits.
Explore Advanced MetricsLas Vegas Airbnb Guest Demographics & Profile Analysis (2026)
Guest Profile Summary for Las Vegas
- The typical guest profile for Airbnb in Las Vegas consists of primarily domestic travelers (89%), often arriving from nearby Los Angeles, typically belonging to the Post-2000s (Gen Z/Alpha) group (50%), primarily speaking English or Spanish.
- Domestic travelers account for 88.8% of guests.
- Key international markets include United States (88.8%) and Canada (1.9%).
- Top languages spoken are English (62.6%) followed by Spanish (18.9%).
- A significant demographic segment is the Post-2000s (Gen Z/Alpha) group, representing 50% of guests.
Recommendations for Hosts
- Target domestic marketing efforts towards travelers from Los Angeles and Las Vegas.
- Tailor amenities and listing descriptions to appeal to the dominant Post-2000s (Gen Z/Alpha) demographic (e.g., highlight fast WiFi, smart home features, local guides).
- Highlight unique local experiences or amenities relevant to the primary guest profile.
- Consider seasonal promotions aligned with peak travel times for key origin markets.
What Are Airbnb Guest Ratings in Las Vegas?
Listings in Las Vegas average 4.78 out of 5 overall, with about 39.1 reviews per active listing and 31.5% of listings carrying the Guest Favorite badge.
Rating Breakdown by Category
Guest Rating Insights for Las Vegas
- An average rating of 4.78 places Las Vegas in solid territory. Most guests leave satisfied, though there is room for hosts to push toward the top tier.
- The strongest subcategory is Check-in (4.87), while Value (4.73) trails behind — a useful signal for hosts looking to prioritize upgrades.
- 31.5% of listings carry the Guest Favorite badge, a strong trust signal that can meaningfully lift click-through and booking rates.
Recommendations for Hosts
- Focus improvement efforts on Value — even small gains in the weakest subcategory can lift overall ratings and search ranking.
- Encourage guests to leave reviews after checkout. Listings with more reviews rank higher in search results and convert browsers into bookers more effectively.
Las Vegas Airbnb Booking Patterns (2026): Available vs. Booked Days
Available Days Distribution
Booked Days Distribution
Booking Pattern Insights for Las Vegas
- The most common availability pattern in Las Vegas falls within the 271-366 days range, representing 59.1% of listings. This suggests many properties have significant open periods on their calendars.
- Approximately 86.6% of listings show high availability (181+ days open annually), indicating potential for increased bookings or specific owner usage patterns.
- For booked days, the 31-90 days range is most frequent in Las Vegas (33.8%), reflecting common guest stay durations or potential owner blocking patterns.
- A notable 14.1% of properties secure long booking periods (181+ days booked per year), highlighting successful long-term rental strategies or significant owner usage.
How Far in Advance Do Guests Book Airbnb in Las Vegas?
Average Booking Lead Time by Month
Booking Lead Time Insights for Las Vegas
- The overall average booking lead time for vacation rentals in Las Vegas is 40 days.
- Guests book furthest in advance for stays during May (average 73 days), likely coinciding with peak travel demand or local events.
- The shortest booking windows occur for stays in July (average 29 days), indicating more last-minute travel plans during this time.
- Seasonally, Spring (51 days avg.) sees the longest lead times, while Winter (33 days avg.) has the shortest, reflecting typical travel planning cycles.
Recommendations for Hosts
- Use the overall average lead time (40 days) as a baseline for your pricing and availability strategy in Las Vegas.
- For May stays, consider implementing length-of-stay discounts or slightly higher rates for bookings made less than 73 days out to capitalize on advance planning.
- Target marketing efforts for the Spring season well in advance (at least 51 days) to capture early planners.
- Monitor your own booking lead times against these Las Vegas averages to identify opportunities for dynamic pricing adjustments.
What Is the Average Length of Stay for Airbnb in Las Vegas?
Guests in Las Vegas stay about 6.9 nights on average, generating roughly 82,676 reservations and 18.9 bookings per listing in the latest AirROI dataset. The most common check-in time is 4:00 PM and check-out is 11:00 AM.
Monthly Length of Stay in Las Vegas
Check-in Time Distribution
Check-out Time Distribution
Stay Pattern Insights for Las Vegas
- A mid-range stay length points to leisure-driven demand — weekend getaways and short vacations. Hosts should optimize for quick turnover efficiency while keeping the guest experience smooth.
- 18.9 bookings per listing is a manageable pace that balances revenue with operational overhead.
- Stay lengths peak in Jun (6.2 nights) and shorten in May (3.9 nights). Adjust minimum-night requirements seasonally to match.
Recommendations for Hosts
- Leverage the longer-stay pattern by offering weekly discounts — even 5-10% off can convert browsing into bookings for guests considering an extended stay.
- Set your check-in time to match or beat the market standard of 4:00 PM. Offering early check-in flexibility can be a low-cost differentiator.
- Monitor length-of-stay seasonality to adjust minimum-night requirements — longer minimums during peak periods maximize revenue while shorter minimums fill gaps in shoulder seasons.
Las Vegas Airbnb Minimum Stay Requirements Analysis
Distribution of Listings by Minimum Night Requirement
1 Night
938 listings
21.4% of total
2 Nights
968 listings
22.1% of total
3 Nights
271 listings
6.2% of total
4-6 Nights
124 listings
2.8% of total
7-29 Nights
378 listings
8.6% of total
30+ Nights
1709 listings
38.9% of total
Key Insights
- The most prevalent minimum stay requirement in Las Vegas is 30+ Nights, adopted by 38.9% of listings. This highlights the market's preference for longer commitments.
- A significant segment (38.9%) caters to monthly stays (30+ nights) in Las Vegas, pointing to opportunities in the extended-stay market.
Recommendations
- Align with the market by considering a 30+ Nights minimum stay, as 38.9% of Las Vegas hosts use this setting.
- If feasible, allowing 1-night stays, especially midweek or during low season, could capture last-minute bookings, as only 21.4% currently do.
- Explore offering discounts for stays of 30+ nights to attract the 38.9% of the market seeking extended stays.
- Adjust minimum nights based on seasonality – potentially shorter during low season and longer during peak demand periods in Las Vegas.
Las Vegas Airbnb Cancellation Policy Trends Analysis (2026)
Refundable
3 listings
0.1% of total
Limited
177 listings
4% of total
Super Strict 30 Days
72 listings
1.6% of total
Super Strict 60 Days
46 listings
1% of total
Non-refundable
2 listings
0% of total
Flexible
755 listings
17.2% of total
Moderate
819 listings
18.7% of total
Firm
1889 listings
43.1% of total
Strict
620 listings
14.1% of total
Cancellation Policy Insights for Las Vegas
- The prevailing Airbnb cancellation policy trend in Las Vegas is Firm, used by 43.1% of listings.
- A majority (57.2%) of hosts in Las Vegas utilize Firm or Strict policies, indicating a market where hosts prioritize booking security.
Recommendations for Hosts
- Consider adopting a Firm policy to align with the 43.1% market standard in Las Vegas.
- Using a Strict policy might deter some guests, as only 14.1% of listings use it. Evaluate if potential revenue protection outweighs possible lower booking rates.
- Regularly review your cancellation policy against competitors and market demand shifts in Las Vegas.
How Much Are Airbnb Cleaning Fees in Las Vegas?
Cleaning fees in Las Vegas are meaningful operating levers, not just pass-through charges. What matters most is how often hosts charge them, how high they run relative to market norms, and how large a share of gross revenue they consume.
Cleaning Fee Insights for Las Vegas
- 86.1% of listings charge a cleaning fee, making it standard practice in Las Vegas. Guests expect it and factor it into their booking decisions.
- The gap between the average ($822) and median ($185) cleaning fee indicates some high-end properties are pulling the average up considerably.
- Cleaning fees represent 10.7% of gross revenue on average — a significant line item that impacts total guest cost and competitiveness.
Recommendations for Hosts
- Price your cleaning fee competitively against the Las Vegas median of $185. Fees significantly above market norms can deter bookings, especially for shorter stays.
- Consider whether bundling the cleaning fee into a slightly higher nightly rate might improve conversion, since many guests filter by total price and separate fees can feel punitive.
- Monitor competitor cleaning fees regularly. Airbnb's search algorithm factors in total price, so a well-calibrated cleaning fee can improve your listing's ranking.
What Do the Top Airbnb Listings in Las Vegas Look Like?
Benchmark your potential! Explore examples of top-performing Airbnb properties in Las Vegasbased on Trailing Twelve Month (TTM) revenue. Analyze their characteristics, revenue, occupancy rate, and ADR to understand what drives success in this market.
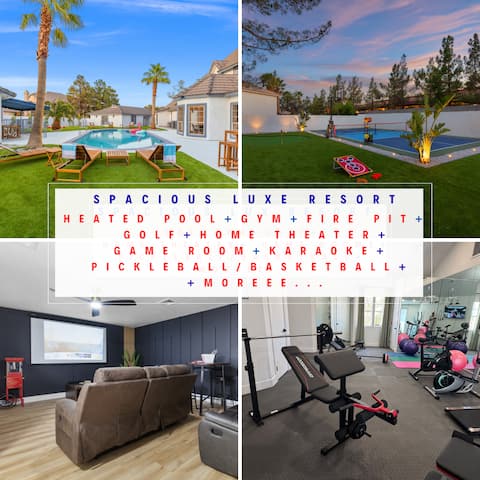
LUXResort Pool+Theater+Gym |Pickle/Basketball/Golf
Entire Place • 9 bedrooms

777Rentals - 11BR/8.5BA - TUF House
Entire Place • 11 bedrooms
Iconic Luxe Villa. Heated Pool, Sauna & Movie Room
Entire Place • 5 bedrooms

Luxury 6BR/4BA Resort-Style pool
Entire Place • 6 bedrooms

Two-in-One Luxury Vacation Villas 5,500 sqft
Entire Place • 10 bedrooms

All-In Villa | 7BR 6BA w/Theater, Karaoke, & Pool
Entire Place • 7 bedrooms
Note: Performance varies based on location, size, amenities, seasonality, and management quality. Data reflects the past 12 months.
Who Are the Top Airbnb Hosts in Las Vegas?
Learn from the best! This table showcases top-performing Airbnb hosts in Las Vegas based on the number of properties managed and estimated total revenue over the past year. Analyze their scale and performance metrics.
| Host Name | Properties | Grossing Revenue | Stay Reviews | Avg Rating |
|---|---|---|---|---|
| Jerry | 51 | $2,434,788 | 2994 | 4.82/5.0 |
| Emily | 39 | $2,178,571 | 1743 | 4.91/5.0 |
| StripViewSuites | 79 | $1,612,367 | 1102 | 4.63/5.0 |
| Alex | 42 | $1,612,265 | 1538 | 4.74/5.0 |
| Sammie Xiao | 26 | $1,227,337 | 436 | 4.78/5.0 |
| Golden Home Stays | 16 | $1,087,566 | 608 | 4.72/5.0 |
| Vacation Rental | 9 | $1,047,740 | 681 | 4.76/5.0 |
| V & L Home | 28 | $859,503 | 1827 | 4.83/5.0 |
| BreezyStays | 24 | $849,959 | 1027 | 4.72/5.0 |
| Matthew | 22 | $772,639 | 425 | 4.87/5.0 |
Analyzing the strategies of top hosts, such as their property selection, pricing, and guest communication, can offer valuable lessons for optimizing your own Airbnb operations in Las Vegas.
Who Are the Airbnb Hosts in Las Vegas?
Las Vegas is a quality-focused market, with a high Superhost share and fairly mature operating standards.
Host Profile Insights for Las Vegas
- With 52.8% Superhosts, Las Vegas has an experienced host base that sets high guest expectations. New entrants should plan for competitive quality standards.
- 9.6% of listings are professionally managed, reflecting a market still dominated by individual hosts.
- 12.5% of listings have Instant Book enabled. Lower Instant Book adoption means many guests must request approval, which can slow conversions.
- 63.7% of listings use Airbnb's simplified pricing (host-only fee), where the host pays the entire platform service fee and the guest sees one all-in price with no separate Airbnb service charge. High adoption signals a professional, PMS-connected host base — Airbnb mandates simplified pricing for software-connected listings.
Recommendations for Hosts
- Consider enabling Instant Book — it reduces booking friction and Airbnb's algorithm tends to favor Instant Book listings in search results.
- With 38.6% cohosted listings, there may be a growing local market for property management services.
- Benchmark your host metrics against these Las Vegas averages regularly and adjust your hosting strategy based on what top performers do differently.
Top Professional Management Companies in Las Vegas
These are the highest-grossing professional property management operations in Las Vegas, ranked by total revenue across their portfolio. Their performance metrics offer a benchmark for what institutional-level hosting looks like in this market.
| Company | Listings | Revenue | ADR | Occ. | Rating |
|---|---|---|---|---|---|
| Alex | 42 | $1,612,265 | $254 | 55.7% | 4.74/5 |
| Sammie Xiao | 26 | $1,227,337 | $502 | 39.1% | 4.78/5 |
| Golden Home Stays | 16 | $1,087,566 | $466 | 58.3% | 4.72/5 |
| BreezyStays | 24 | $849,959 | $234 | 53.1% | 4.72/5 |
| Matthew | 22 | $772,639 | $225 | 54.5% | 4.87/5 |
| Suite Life | 32 | $654,823 | $308 | 29.0% | 4.84/5 |
| Skylar | 11 | $607,823 | $395 | 47.8% | 4.73/5 |
| Hayden | 9 | $544,658 | $318 | 60.6% | 4.83/5 |
| Evolve | 26 | $535,618 | $221 | 38.7% | 4.62/5 |
| Livily.Com | 15 | $459,164 | $270 | 41.4% | 4.24/5 |
Management Company Insights for Las Vegas
- The leading management company, Alex, operates 42 listings with $1,612,265 in gross revenue — a useful benchmark for what scale looks like in Las Vegas.
- Top managers average 22 properties each, pointing to a market where portfolio scale is a meaningful competitive factor.
- Professionally managed listings in the top tier average 4.71/5 in guest ratings — demonstrating that scale and quality can coexist.
Recommendations
- With only 9.6% of listings professionally managed, there may be an opportunity to differentiate through more structured operations and consistent guest experiences.
- Study how top management companies price, position, and maintain their portfolios — their ADR and occupancy rates reflect strategies refined across dozens of listings.
- If you're considering hiring a property manager, compare their portfolio performance against these benchmarks before committing.
How Does Las Vegas's Airbnb Market Compare to Nearby Cities?
How does the Las Vegas Airbnb market stack up against its neighbors? Compare key performance metrics like average monthly revenue, ADR, and occupancy rates in surrounding areas to understand the broader regional STR landscape.
Compared with Beatty, Las Vegas has 12 percentage points lower occupancy and about $83 higher ADR. That helps frame whether this market is winning more on demand, pricing, or both.
| Market | Active Properties | Monthly Revenue | Daily Rate | Avg. Occupancy |
|---|---|---|---|---|
| Henderson | 577 | $3,512 | $298.72 | 44% |
| North Las Vegas | 1,270 | $3,108 | $282.96 | 43% |
| Mesquite | 155 | $2,926 | $278.97 | 40% |
| Spring Valley | 1,428 | $2,753 | $287.57 | 40% |
| Summerlin South | 32 | $2,657 | $248.52 | 47% |
| Paradise | 3,342 | $2,618 | $293.00 | 38% |
| Enterprise | 15 | $2,575 | $274.86 | 41% |
| Beatty | 31 | $2,530 | $180.57 | 51% |
| Tecopa | 11 | $2,228 | $275.04 | 40% |
| Amargosa Valley | 30 | $2,063 | $182.97 | 42% |
Frequently Asked Questions About Airbnb in Las Vegas
These quick answers summarize the most common investor and operator questions using AirROI's latest market data for Las Vegas.
How much do Airbnb hosts make in Las Vegas?
Las Vegas hosts earn about $25,789 per year on average, with an average nightly rate of $264 and RevPAR of $104. Those figures describe the typical revenue environment for active listings in Las Vegas, Nevada, not the ceiling for the best operators. Source: AirROI 2026 data, Las Vegas market, July 2025 to June 2026.
What is the average Airbnb occupancy rate in Las Vegas?
The average Airbnb occupancy rate in Las Vegas is 39.1%. March is the strongest month and February is the softest, so hosts should expect demand to move meaningfully throughout the year rather than stay flat.
What is the average Airbnb daily rate in Las Vegas?
Listings in Las Vegas average $264 per night. The broader pricing spread also matters: lower-performing listings cluster closer to the lower quartiles, while premium homes can price materially above the city average when demand spikes or listing quality stands out.
How many Airbnb listings are active in Las Vegas?
Las Vegas currently has about 4,389 active Airbnb listings in AirROI's market dataset. That supply count helps explain how competitive the market is, how much depth there is for benchmarking, and whether the market behaves like a niche destination or a scaled urban market.
How strict are short-term rental regulations in Las Vegas?
AirROI currently classifies the short-term rental regulation level in Las Vegas as High. The dataset also shows about 39.7% of listings with registration evidence. That is a market signal, not legal advice, so hosts should still confirm current licensing and compliance rules locally before listing.
What is the RevPAR for Airbnb in Las Vegas?
RevPAR in Las Vegas is about $104. That metric combines pricing and occupancy into one efficiency number, so it is often a better quick benchmark than ADR alone when investors want to compare how well listings convert nightly rates into realized revenue.
Is Airbnb profitable in Las Vegas?
Occupancy of 39.1% means Las Vegas is a more selective market. Profitability is achievable but requires careful cost management, premium positioning, or targeting longer stays to reduce turnover. Average annual revenue is $25,789, but individual returns depend on property type, location within the city, and the host's operating efficiency.
How far in advance do guests book Airbnb in Las Vegas?
The average booking lead time in Las Vegas is about 40 days — a moderate lead time that gives hosts planning visibility while still benefiting from last-minute bookings. Hosts who understand their market's booking cadence can adjust minimum stays and pricing windows accordingly.
What are the best neighborhoods for Airbnb in Las Vegas?
Based on AirROI's analysis, some of the top neighborhoods for short-term rentals in Las Vegas include The Strip, Downtown Las Vegas, Summerlin. Each area attracts different guest profiles — from business travelers to leisure visitors — so the best location depends on the property type and target audience a host is aiming for. See the full neighborhood breakdown above.
What type of property performs best on Airbnb in Las Vegas?
entire_home listings make up 79.6% of the active supply in Las Vegas. The most common configuration does not always mean the most profitable — operators who identify underserved property types or bedroom counts can sometimes outperform the market average by filling a gap in local supply.
How does Las Vegas compare to nearby Airbnb markets?
Among neighboring markets, Henderson posts $42,145 in average annual revenue with 43.9% occupancy, compared to Las Vegas's $25,789 and 39.1%. Comparing nearby markets helps investors understand whether a destination's performance reflects local demand or broader regional trends.
What is the average length of stay in Las Vegas?
The average Airbnb stay length in Las Vegas is about 6.9 nights. That matters for turnover, cleaning operations, and pricing strategy because shorter stays increase changeovers while longer stays can smooth occupancy and reduce operational friction.
What is the average Airbnb guest rating in Las Vegas?
Airbnb listings in Las Vegas average 4.78 out of 5 overall. About 31.5% of listings carry the guest favorite badge, which suggests a meaningful share of inventory is competing on review quality rather than price alone.
Which amenities boost Airbnb revenue in Las Vegas?
TV and Batting cage are among the strongest revenue-linked amenities in Las Vegas. In AirROI's latest dataset, listings with these amenities outperform those without on average revenue, which makes amenities analysis useful for prioritizing investment and listing upgrades.
Do Airbnb hosts charge cleaning fees in Las Vegas?
Yes. About 86.1% of active Airbnb listings in Las Vegas charge a cleaning fee, and the average fee is $822. The more important operating benchmark is how much of gross revenue that fee consumes, not just the absolute dollar amount.
What percentage of Airbnb hosts are Superhosts in Las Vegas?
A 52.8% Superhost rate signals a highly competitive market where review quality and responsiveness are table stakes, not differentiators.
About AirROI Market Data
AirROI tracks over 20 million properties across 190+ countries and maintains 15+ years of historical performance data, making it one of the deepest Airbnb and STR intelligence platforms available. The analytics pipeline aggregates listing-level data monthly — revenue, occupancy, nightly rates, RevPAR, guest demographics, booking patterns, and competitive supply — so investors and operators can benchmark any market against its own history and against neighboring destinations.
Real estate investors, property managers, financial institutions, hedge funds, tourism boards, hospitality consultants, tech platforms, and academic researchers rely on AirROI data to underwrite acquisitions, optimize pricing, model macro trends, and conduct peer-reviewed research. Data is available through in-depth market reports like this one and the Airbnb API with 22 endpoints and an Airbnb MCP Server for AI agents.
AirROI proprietary analytics as of 2026-06-30. Metrics reflect trailing twelve-month aggregates from active listings. Revenue figures are market averages, not projections. Neighborhood descriptions are AI-generated and reviewed for accuracy. For full methodology, see the data methodology page.