San Lorenzo, Puerto Rico Airbnb Market Data 2025: STR Report & Statistics
How much can you earn on Airbnb in San Lorenzo, Puerto Rico? Based on AirROI's 2025 dataset (November 2024 – October 2025), the short answer is $28,893 per year — at a $186 nightly rate, 46.6% occupancy, and a N/A RevPAR.
With just 18 active listings, San Lorenzo is a micro-market where moderate demand with room for well-positioned listings to outperform. Supply grew 500.0% over the past year, yet revenue and nightly rates both trended upward — a signal that traveler demand is outpacing new inventory rather than being diluted by it. For hosts, pricing power remains intact even as competition increases.
Regulation is low with minimal registration requirements, pointing to an operator-friendly environment. In a market this size, differentiated listings with strong reviews can capture outsized returns relative to the competition.
Table of Contents [hide] [show]
What Are the Key Airbnb Metrics in San Lorenzo?
In San Lorenzo, the headline Airbnb metrics are $28,893 in average annual revenue,46.6% occupancy, $186 ADR, and $0 in RevPAR, and guests book about 32 days in advance.
How Much Do Airbnb Hosts Earn Monthly in San Lorenzo?
Understanding the monthly revenue variations for Airbnb listings in San Lorenzo is key to maximizing your short term rental income potential. Seasonality significantly impacts earnings. Our analysis, based on data from the past 12 months, shows that the peak revenue month for STRs in San Lorenzo is typically March, while September often presents the lowest earnings, highlighting opportunities for strategic pricing adjustments during shoulder and low seasons. Explore the typical Airbnb income in San Lorenzo across different performance tiers:
- Best-in-class properties (Top 10%) achieve $7,582+ monthly, often utilizing dynamic pricing and superior guest experiences.
- Strong performing properties (Top 25%) earn $4,112 or more, indicating effective management and desirable locations/amenities.
- Typical properties (Median) generate around $2,397 per month, representing the average market performance.
- Entry-level properties (Bottom 25%) see earnings around $1,108, often with potential for optimization.
Average Monthly Airbnb Earnings Trend in San Lorenzo
What Is the Monthly Airbnb Occupancy Rate in San Lorenzo?
Maximize your bookings by understanding the San Lorenzo STR occupancy trends. Seasonal demand shifts significantly influence how often properties are booked. Typically, Januarysees the highest demand (peak season occupancy), while October experiences the lowest (low season). Effective strategies, like adjusting minimum stays or offering promotions, can boost occupancy during slower periods. Here's how different property tiers perform in San Lorenzo:
- Best-in-class properties (Top 10%) achieve 88%+ occupancy, indicating high desirability and potentially optimized availability.
- Strong performing properties (Top 25%) maintain 68% or higher occupancy, suggesting good market fit and guest satisfaction.
- Typical properties (Median) have an occupancy rate around 50%.
- Entry-level properties (Bottom 25%) average 26% occupancy, potentially facing higher vacancy.
Average Monthly Occupancy Rate Trend in San Lorenzo
What Is the Average Airbnb Nightly Rate in San Lorenzo?
Effective short term rental pricing strategy in San Lorenzo involves understanding monthly ADR fluctuations. The Average Daily Rate (ADR) for Airbnb in San Lorenzo typically peaks in June and dips lowest during February. Leveraging Airbnb dynamic pricing tools or strategies based on this seasonality can significantly boost revenue. Here's a look at the typical nightly rates achieved:
- Best-in-class properties (Top 10%) command rates of $299+ per night, often due to premium features or locations.
- Strong performing properties (Top 25%) achieve nightly rates of $199 or more.
- Typical properties (Median) charge around $126 per night.
- Entry-level properties (Bottom 25%) earn around $93 per night.
Average Daily Rate (ADR) Trend by Month in San Lorenzo
What Is the RevPAR for Airbnb in San Lorenzo?
RevPAR in San Lorenzo is currently N/A. Because RevPAR combines nightly rates with realized occupancy, it is one of the cleanest ways to compare how efficiently listings turn demand into revenue across the market.
- Entry-level properties (Bottom 25%) see N/A RevPAR.
- Typical properties (Median) generate N/A RevPAR.
- Strong performers (Top 25%) earn N/A RevPAR.
- Best-in-class (Top 10%) achieve N/A RevPAR.
Average Monthly RevPAR Trend in San Lorenzo
RevPAR Insights for San Lorenzo
- RevPAR peaks in Jan and bottoms out in Jan, mirroring the broader seasonal demand pattern and suggesting opportunities for dynamic pricing.
Recommendations for Hosts
- Track your own RevPAR monthly against these San Lorenzo benchmarks. If your RevPAR falls below the median of N/A, examine whether low occupancy or low ADR is the primary drag.
- Use RevPAR rather than revenue alone when comparing properties of different sizes — it normalizes for available nights and gives a more accurate picture of performance.
Get Live San Lorenzo Market Intelligence 👇
Explore Real-time Analytics
When Is the Peak Season for Airbnb in San Lorenzo?
San Lorenzo's peak Airbnb season falls in March, January, December, while the softest stretch is September, October, November. Overall, the market shows moderate seasonality with distinct peak and low periods, which should guide pricing, minimum stays, and cash-flow planning.
Peak Season (March, January, December)
- Revenue averages $3,741 per month
- Occupancy rates average 58.8%
- Daily rates average $157
Shoulder Season
- Revenue averages $3,251 per month
- Occupancy maintains around 53.3%
- Daily rates hold near $173
Low Season (September, October, November)
- Revenue drops to average $2,270 per month
- Occupancy decreases to average 34.9%
- Daily rates adjust to average $178
Seasonality Insights for San Lorenzo
- The Airbnb seasonality pattern in San Lorenzo shows moderate seasonality with distinct peak and low periods. While the sections above show seasonal averages, it is also insightful to look at the extremes:
- During the high season, the absolute peak month showcases San Lorenzo's highest earning potential, with monthly revenues climbing to $3,865, occupancy reaching 61.7%, and ADRs peaking at $190.
- Conversely, the slowest single month marks the market's lowest point — revenue may dip to $1,908, occupancy could drop to 33.0%, and ADRs may adjust to $155.
- Understanding both the seasonal averages and these monthly peaks and troughs in revenue, occupancy, and ADR is crucial for maximizing your Airbnb profit potential in San Lorenzo.
Seasonal Strategies for Maximizing Profit
- Peak Season: Maximize revenue through premium pricing and potentially longer minimum stays. Ensure high availability and consider tightening cancellation policies to reduce last-minute gaps.
- Low Season: Offer competitive pricing, extended-stay discounts, and flexible cancellation policies. Target off-season travelers like remote workers, budget-conscious guests, and travelers with flexible schedules.
- Shoulder Seasons: Implement dynamic pricing that bridges peak and low rates. Target weekend travelers, local events, and business visitors. Slightly more flexible terms than peak season can help maintain occupancy without deep discounting.
- Regularly analyze your own performance against these San Lorenzo seasonality benchmarks and adjust your pricing and availability strategy accordingly.
Do You Need a License for Airbnb in San Lorenzo?
Low regulation and minimal registration activity in San Lorenzo, Puerto Rico, United States point to an operator-friendly environment. That said, even low-regulation markets may have tax collection requirements, safety standards, or HOA rules that affect short-term rental operations. Always verify the latest short-term rental regulations and Airbnb license requirements directly with local government authorities for San Lorenzo to ensure full compliance before hosting.
(Source: AirROI data, 2026, finding no licensed listings among those analyzed)
What Are the Best Neighborhoods for Airbnb in San Lorenzo?
With a compact short-term rental market, San Lorenzo gives early-mover hosts an advantage in the right neighborhoods. The areas listed below are where guest demand and local attractions converge — a useful lens for investors evaluating whether to enter this market and where to position their listing.
| Neighborhood / Area | Why Host Here? (Target Guests & Appeal) | Key Attractions & Landmarks |
|---|---|---|
| Cabo Rojo | Beautiful coastal town known for its stunning beaches, natural reserves, and vibrant nightlife. Ideal for tourists looking for both relaxation and adventure in a picturesque setting. | Cabo Rojo National Wildlife Refuge, Buyé Beach, Setting of the Lighthouse, Salt Flats of Cabo Rojo, Punta Dajaos |
| San Juan | The capital city and a historic gem with colonial architecture, rich culture, and lively nightlife. Perfect for tourists who want to explore the local history and enjoy urban amenities. | Old San Juan, El Morro Fort, San Juan National Historic Site, La Fortaleza, Condado Beach |
| Ponce | Known as the 'Pearl of the South', Ponce is renowned for its art museums, historical sites, and beautiful architecture. An attractive destination for culture lovers. | Ponce Art Museum, Plaza Las Delicias, La Guancha, Parque de Bombas, Casa Alcaldía |
| Rincón | A surfer's paradise located on the west coast, famous for its beautiful beaches and laid-back atmosphere. Appeals to younger crowds and families looking for fun in the sun. | Domes Beach, Marias Beach, Rincón Lighthouse, Rincón's Farmers Market, Los Almendros Beach |
| Vieques | An island off the coast of Puerto Rico famous for its bioluminescent bay and pristine beaches. Great for tourists looking for an untouched paradise with eco-tourism opportunities. | Mosquito Bay, Sun Bay, Media Luna Beach, Vieques National Wildlife Refuge, Red Beach |
| Humacao | Known for its coastal resorts and beautiful beaches. A peaceful place for families and retirees seeking a relaxing vacation experience. | Humacao Nature Reserve, Palmas del Mar Beach, Cayo Santiago, Playa de Hucares, Punta Santiago |
| Arecibo | Famous for its historic Arecibo Observatory and natural wonders. Ideal for adventurers and those interested in science and nature. | Arecibo Observatory, Cueva del Indio, La Poza del Obispo, Arecibo Lighthouse, Cueva del Río Camuy |
| Dorado | An upscale coastal town known for its luxury resorts, beautiful beaches, and golf courses. Attracts affluent tourists and those seeking a luxurious getaway. | Dorado Beach, Dorado Beach Resort, Gold Course at Dorado Beach, The Atlantis Play Center, Balneario Manuel Morales |
With 8 distinct neighborhoods showing meaningful short-term rental activity, San Lorenzo offers diversification within a single market. Investors can tailor their strategy — from high-turnover tourist zones to quieter residential areas that attract longer stays and remote workers.
What Types of Properties Are on Airbnb in San Lorenzo?
Room Type Distribution
Property Type Distribution
Market Composition Insights for San Lorenzo
- The San Lorenzo Airbnb market composition is heavily skewed towards Entire Home/Apt listings, which make up 94.4% of the 18 active rentals. This indicates strong guest preference for privacy and space.
- Looking at the property type distribution in San Lorenzo, House properties are the most common (44.4%), reflecting the local real estate landscape.
- Houses represent a significant 44.4% portion, catering likely to families or larger groups.
- The presence of 16.7% Hotel/Boutique listings indicates integration with traditional hospitality.
San Lorenzo Airbnb Room Capacity Analysis (2026): Bedroom Distribution
Distribution of Listings by Number of Bedrooms
Room Capacity Insights for San Lorenzo
- The dominant room capacity in San Lorenzo is 3 bedrooms listings, making up 33.3% of the market. This suggests a strong demand for properties suitable for families or small groups.
- Together, 3 bedrooms and 1 bedroom properties represent 61.1% of the active Airbnb listings in San Lorenzo, indicating a high concentration in these sizes.
- A significant 33.3% of listings offer 3+ bedrooms, catering to larger groups and families seeking more space in San Lorenzo.
San Lorenzo Vacation Rental Guest Capacity Trends (2026)
Distribution of Listings by Guest Capacity
Guest Capacity Insights for San Lorenzo
- The most common guest capacity trend in San Lorenzo vacation rentals is listings accommodating 8+ guests (33.3%). This suggests the primary traveler segment is likely larger groups.
- Properties designed for 8+ guests and 2 guests dominate the San Lorenzo STR market, accounting for 61.1% of listings.
- 44.4% of properties accommodate 6+ guests, serving the market segment for larger families or group travel in San Lorenzo.
- On average, properties in San Lorenzo are equipped to host 5.0 guests.
What Amenities Do Airbnb Guests Expect in San Lorenzo?
Amenity Prevalence
Amenity Insights for San Lorenzo
- Essential amenities in San Lorenzo that guests expect include: Wifi, TV, Air conditioning. Lacking these (any) could significantly impact bookings.
- Popular amenities like Free parking on premises, Kitchen, Microwave are common but not universal. Offering these can provide a competitive edge.
Recommendations for Hosts
- Ensure your listing includes all essential amenities for San Lorenzo: Wifi, TV, Air conditioning.
- Consider adding popular differentiators like Free parking on premises or Kitchen to increase appeal.
- Highlight unique or less common amenities you offer (e.g., hot tub, dedicated workspace, EV charger) in your listing description and photos.
- Regularly check competitor amenities in San Lorenzo to stay competitive.
Dive Deeper: Advanced San Lorenzo STR Market Data (2026)
Ready to unlock more insights? AirROI provides access to advanced metrics and comprehensive Airbnb data for San Lorenzo. Explore detailed analytics beyond this report to refine your investment strategy, optimize pricing, and maximize your vacation rental profits.
Explore Advanced MetricsSan Lorenzo Airbnb Guest Demographics & Profile Analysis (2026)
Guest Profile Summary for San Lorenzo
- The typical guest profile for Airbnb in San Lorenzo consists of primarily domestic travelers (69%), often arriving from nearby New York, typically belonging to the Post-2000s (Gen Z/Alpha) group (50%), primarily speaking English or Spanish.
- Domestic travelers account for 68.5% of guests.
- Key international markets include United States (68.5%) and Puerto Rico (26.2%).
- Top languages spoken are English (48.8%) followed by Spanish (43.3%).
- A significant demographic segment is the Post-2000s (Gen Z/Alpha) group, representing 50% of guests.
Recommendations for Hosts
- Target domestic marketing efforts towards travelers from New York and San Juan.
- Tailor amenities and listing descriptions to appeal to the dominant Post-2000s (Gen Z/Alpha) demographic (e.g., highlight fast WiFi, smart home features, local guides).
- Highlight unique local experiences or amenities relevant to the primary guest profile.
- Consider seasonal promotions aligned with peak travel times for key origin markets.
San Lorenzo Airbnb Booking Patterns (2026): Available vs. Booked Days
Available Days Distribution
Booked Days Distribution
Booking Pattern Insights for San Lorenzo
- The most common availability pattern in San Lorenzo falls within the 271-366 days range, representing 44.4% of listings. This suggests many properties have significant open periods on their calendars.
- Approximately 55.5% of listings show high availability (181+ days open annually), indicating potential for increased bookings or specific owner usage patterns.
- For booked days, the 181-270 days range is most frequent in San Lorenzo (27.8%), reflecting common guest stay durations or potential owner blocking patterns.
- A notable 44.5% of properties secure long booking periods (181+ days booked per year), highlighting successful long-term rental strategies or significant owner usage.
How Far in Advance Do Guests Book Airbnb in San Lorenzo?
Average Booking Lead Time by Month
Booking Lead Time Insights for San Lorenzo
- The overall average booking lead time for vacation rentals in San Lorenzo is 32 days.
- Guests book furthest in advance for stays during October (average 57 days), likely coinciding with peak travel demand or local events.
- The shortest booking windows occur for stays in March (average 21 days), indicating more last-minute travel plans during this time.
- Seasonally, Summer (46 days avg.) sees the longest lead times, while Spring (31 days avg.) has the shortest, reflecting typical travel planning cycles.
Recommendations for Hosts
- Use the overall average lead time (32 days) as a baseline for your pricing and availability strategy in San Lorenzo.
- For October stays, consider implementing length-of-stay discounts or slightly higher rates for bookings made less than 57 days out to capitalize on advance planning.
- Target marketing efforts for the Summer season well in advance (at least 46 days) to capture early planners.
- Monitor your own booking lead times against these San Lorenzo averages to identify opportunities for dynamic pricing adjustments.
San Lorenzo Airbnb Minimum Stay Requirements Analysis
Distribution of Listings by Minimum Night Requirement
1 Night
8 listings
44.4% of total
2 Nights
6 listings
33.3% of total
30+ Nights
4 listings
22.2% of total
Key Insights
- The most prevalent minimum stay requirement in San Lorenzo is 1 Night, adopted by 44.4% of listings. This highlights the market's preference for shorter, flexible bookings.
- A strong majority (77.7%) of the San Lorenzo Airbnb data shows acceptance of very short stays (1-2 nights), indicating a dynamic, high-turnover market.
- A significant segment (22.2%) caters to monthly stays (30+ nights) in San Lorenzo, pointing to opportunities in the extended-stay market.
Recommendations
- Align with the market by considering a 1 Night minimum stay, as 44.4% of San Lorenzo hosts use this setting.
- Explore offering discounts for stays of 30+ nights to attract the 22.2% of the market seeking extended stays.
- Adjust minimum nights based on seasonality – potentially shorter during low season and longer during peak demand periods in San Lorenzo.
San Lorenzo Airbnb Cancellation Policy Trends Analysis (2026)
Flexible
4 listings
22.2% of total
Moderate
4 listings
22.2% of total
Firm
7 listings
38.9% of total
Strict
3 listings
16.7% of total
Cancellation Policy Insights for San Lorenzo
- The prevailing Airbnb cancellation policy trend in San Lorenzo is Firm, used by 38.9% of listings.
- A majority (55.6%) of hosts in San Lorenzo utilize Firm or Strict policies, indicating a market where hosts prioritize booking security.
Recommendations for Hosts
- Consider adopting a Firm policy to align with the 38.9% market standard in San Lorenzo.
- Regularly review your cancellation policy against competitors and market demand shifts in San Lorenzo.
What Do the Top Airbnb Listings in San Lorenzo Look Like?
Benchmark your potential! Explore examples of top-performing Airbnb properties in San Lorenzobased on Trailing Twelve Month (TTM) revenue. Analyze their characteristics, revenue, occupancy rate, and ADR to understand what drives success in this market.
Chalet De Los Vientos (Chalet of the Winds)
Entire Place • 1 bedroom
JM country house
Entire Place • 3 bedrooms
Casa Lealtad I: San Lorenzo
Entire Place • N/A
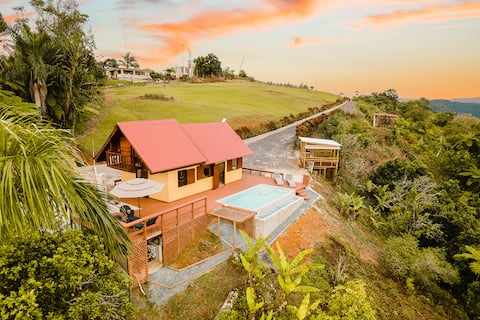
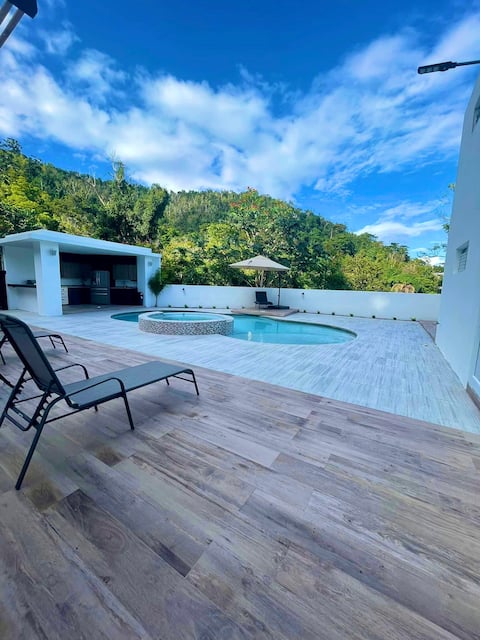
Island house with private pool!
Entire Place • 3 bedrooms
Cabin Recalling Yesterday
Entire Place • 2 bedrooms
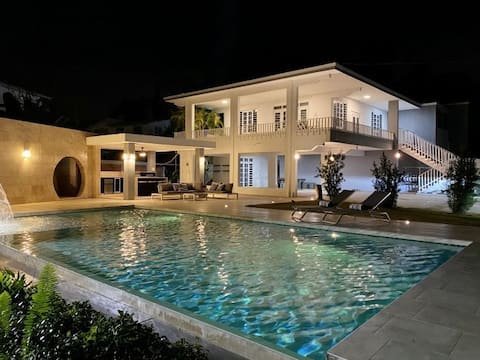
HideAway Villa II | Pool & Jacuzzi
Entire Place • 1 bedroom
Note: Performance varies based on location, size, amenities, seasonality, and management quality. Data reflects the past 12 months.
Who Are the Top Airbnb Hosts in San Lorenzo?
Learn from the best! This table showcases top-performing Airbnb hosts in San Lorenzo based on the number of properties managed and estimated total revenue over the past year. Analyze their scale and performance metrics.
| Host Name | Properties | Grossing Revenue | Stay Reviews | Avg Rating |
|---|---|---|---|---|
| Jose | 1 | $97,491 | 178 | 4.99/5.0 |
| Maria | 1 | $89,984 | 35 | 4.91/5.0 |
| Maria | 1 | $49,632 | 6 | 4.33/5.0 |
| Xiomara | 1 | $47,421 | 42 | 4.74/5.0 |
| Raul | 1 | $46,310 | 73 | 4.86/5.0 |
| Caleb | 1 | $38,692 | 33 | 4.91/5.0 |
| Jorge | 2 | $36,544 | 33 | 4.76/5.0 |
| Jhensen | 1 | $30,290 | 206 | 4.83/5.0 |
| Awilmarie | 1 | $28,758 | 54 | 4.93/5.0 |
| Esther | 1 | $17,889 | 73 | 4.93/5.0 |
Analyzing the strategies of top hosts, such as their property selection, pricing, and guest communication, can offer valuable lessons for optimizing your own Airbnb operations in San Lorenzo.
How Does San Lorenzo's Airbnb Market Compare to Nearby Cities?
How does the San Lorenzo Airbnb market stack up against its neighbors? Compare key performance metrics like average monthly revenue, ADR, and occupancy rates in surrounding areas to understand the broader regional STR landscape.
Compared with Coral Harbour, San Lorenzo has 6 percentage points lower occupancy and about $287 lower ADR. That helps frame whether this market is winning more on demand, pricing, or both.
| Market | Active Properties | Monthly Revenue | Daily Rate | Avg. Occupancy |
|---|---|---|---|---|
| Central | 15 | $9,255 | $1171.36 | 44% |
| East End | 10 | $7,992 | $765.13 | 52% |
| Northside | 45 | $7,076 | $614.17 | 44% |
| Sabana | 12 | $6,925 | $492.41 | 52% |
| Loíza | 14 | $6,668 | $410.25 | 51% |
| Cruz Bay | 399 | $6,509 | $625.74 | 48% |
| Cruz Bay | 18 | $6,446 | $596.74 | 50% |
| Guánica | 14 | $6,398 | $551.40 | 35% |
| Coral Harbour | 164 | $5,897 | $473.19 | 53% |
| Fortuna | 14 | $5,823 | $315.77 | 52% |
Frequently Asked Questions About Airbnb in San Lorenzo
These quick answers summarize the most common investor and operator questions using AirROI's latest market data for San Lorenzo.
How much do Airbnb hosts make in San Lorenzo?
San Lorenzo hosts earn about $28,893 per year on average, with an average nightly rate of $186 and RevPAR of N/A. Those figures describe the typical revenue environment for active listings in San Lorenzo, Puerto Rico, not the ceiling for the best operators. Source: AirROI 2025 data, San Lorenzo market, November 2024 to October 2025.
What is the average Airbnb occupancy rate in San Lorenzo?
The average Airbnb occupancy rate in San Lorenzo is 46.6%. March is the strongest month and September is the softest, so hosts should expect demand to move meaningfully throughout the year rather than stay flat.
What is the average Airbnb daily rate in San Lorenzo?
Listings in San Lorenzo average $186 per night. The broader pricing spread also matters: lower-performing listings cluster closer to the lower quartiles, while premium homes can price materially above the city average when demand spikes or listing quality stands out.
How many Airbnb listings are active in San Lorenzo?
San Lorenzo currently has about 18 active Airbnb listings in AirROI's market dataset. That supply count helps explain how competitive the market is, how much depth there is for benchmarking, and whether the market behaves like a niche destination or a scaled urban market.
How strict are short-term rental regulations in San Lorenzo?
AirROI currently classifies the short-term rental regulation level in San Lorenzo as Low. The dataset also shows about 0.0% of listings with registration evidence. That is a market signal, not legal advice, so hosts should still confirm current licensing and compliance rules locally before listing.
What is the RevPAR for Airbnb in San Lorenzo?
RevPAR in San Lorenzo is about N/A. That metric combines pricing and occupancy into one efficiency number, so it is often a better quick benchmark than ADR alone when investors want to compare how well listings convert nightly rates into realized revenue.
Is Airbnb profitable in San Lorenzo?
At 46.6% occupancy, San Lorenzo can be profitable — but margins depend heavily on operating costs, property acquisition price, and how well hosts optimize pricing across seasons. Average annual revenue is $28,893, but individual returns depend on property type, location within the city, and the host's operating efficiency.
How far in advance do guests book Airbnb in San Lorenzo?
The average booking lead time in San Lorenzo is about 32 days — a moderate lead time that gives hosts planning visibility while still benefiting from last-minute bookings. Hosts who understand their market's booking cadence can adjust minimum stays and pricing windows accordingly.
What are the best neighborhoods for Airbnb in San Lorenzo?
Based on AirROI's analysis, some of the top neighborhoods for short-term rentals in San Lorenzo include Cabo Rojo, San Juan, Ponce. Each area attracts different guest profiles — from business travelers to leisure visitors — so the best location depends on the property type and target audience a host is aiming for. See the full neighborhood breakdown above.
What type of property performs best on Airbnb in San Lorenzo?
entire_home listings make up 94.4% of the active supply in San Lorenzo. The most common configuration does not always mean the most profitable — operators who identify underserved property types or bedroom counts can sometimes outperform the market average by filling a gap in local supply.
How does San Lorenzo compare to nearby Airbnb markets?
Among neighboring markets, Central posts $111,065 in average annual revenue with 44.2% occupancy, compared to San Lorenzo's $28,893 and 46.6%. Comparing nearby markets helps investors understand whether a destination's performance reflects local demand or broader regional trends.
When is the peak season for Airbnb in San Lorenzo?
March is the highest-revenue month in San Lorenzo, while September is the softest. The revenue spread between them indicates moderate seasonality with a clear peak period, giving hosts opportunities to maximize rates during high demand without facing dramatic off-season drops.
About AirROI Market Data
AirROI tracks over 20 million properties across 190+ countries and maintains 15+ years of historical performance data, making it one of the deepest Airbnb and STR intelligence platforms available. The analytics pipeline aggregates listing-level data monthly — revenue, occupancy, nightly rates, RevPAR, guest demographics, booking patterns, and competitive supply — so investors and operators can benchmark any market against its own history and against neighboring destinations.
Real estate investors, property managers, financial institutions, hedge funds, tourism boards, hospitality consultants, tech platforms, and academic researchers rely on AirROI data to underwrite acquisitions, optimize pricing, model macro trends, and conduct peer-reviewed research. Data is available through in-depth market reports like this one and the Airbnb API with 22 endpoints and an Airbnb MCP Server for AI agents.
AirROI proprietary analytics as of 2025-10-31. Metrics reflect trailing twelve-month aggregates from active listings. Revenue figures are market averages, not projections. Neighborhood descriptions are AI-generated and reviewed for accuracy. For full methodology, see the data methodology page.