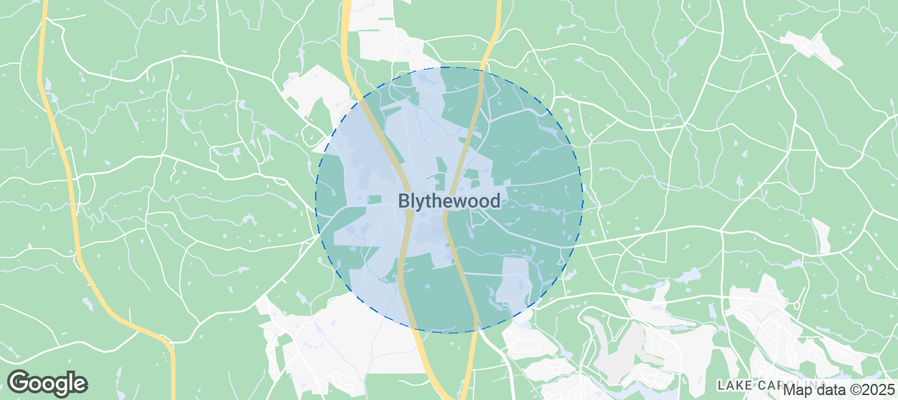
Blythewood Airbnb Market Analysis 2025: Short Term Rental Data & Vacation Rental Statistics in South Carolina, United States
Is Airbnb profitable in Blythewood in 2025? Explore comprehensive Airbnb analytics for Blythewood, South Carolina, United States to uncover income potential. This 2025 STR market report for Blythewood, based on AirROI data from September 2024 to August 2025, reveals key trends in the niche market of 18 active listings.
Whether you're considering an Airbnb investment in Blythewood, optimizing your existing vacation rental, or exploring rental arbitrage opportunities, understanding the Blythewood Airbnb data is crucial. Leveraging the low regulation environment is key to maximizing your short term rental income potential. Let's dive into the specifics.
Key Blythewood Airbnb Performance Metrics Overview
Monthly Airbnb Revenue Variations & Income Potential in Blythewood (2025)
Understanding the monthly revenue variations for Airbnb listings in Blythewood is key to maximizing your short term rental income potential. Seasonality significantly impacts earnings. Our analysis, based on data from the past 12 months, shows that the peak revenue month for STRs in Blythewood is typically June, while April often presents the lowest earnings, highlighting opportunities for strategic pricing adjustments during shoulder and low seasons. Explore the typical Airbnb income in Blythewood across different performance tiers:
- Best-in-class properties (Top 10%) achieve $6,583+ monthly, often utilizing dynamic pricing and superior guest experiences.
- Strong performing properties (Top 25%) earn $3,342 or more, indicating effective management and desirable locations/amenities.
- Typical properties (Median) generate around $1,424 per month, representing the average market performance.
- Entry-level properties (Bottom 25%) see earnings around $770, often with potential for optimization.
Average Monthly Airbnb Earnings Trend in Blythewood
Blythewood Airbnb Occupancy Rate Trends (2025)
Maximize your bookings by understanding the Blythewood STR occupancy trends. Seasonal demand shifts significantly influence how often properties are booked. Typically, Marchsees the highest demand (peak season occupancy), while April experiences the lowest (low season). Effective strategies, like adjusting minimum stays or offering promotions, can boost occupancy during slower periods. Here's how different property tiers perform in Blythewood:
- Best-in-class properties (Top 10%) achieve 80%+ occupancy, indicating high desirability and potentially optimized availability.
- Strong performing properties (Top 25%) maintain 66% or higher occupancy, suggesting good market fit and guest satisfaction.
- Typical properties (Median) have an occupancy rate around 38%.
- Entry-level properties (Bottom 25%) average 19% occupancy, potentially facing higher vacancy.
Average Monthly Occupancy Rate Trend in Blythewood
Average Daily Rate (ADR) Airbnb Trends in Blythewood (2025)
Effective short term rental pricing strategy in Blythewood involves understanding monthly ADR fluctuations. The Average Daily Rate (ADR) for Airbnb in Blythewood typically peaks in November and dips lowest during April. Leveraging Airbnb dynamic pricing tools or strategies based on this seasonality can significantly boost revenue. Here's a look at the typical nightly rates achieved:
- Best-in-class properties (Top 10%) command rates of $373+ per night, often due to premium features or locations.
- Strong performing properties (Top 25%) achieve nightly rates of $176 or more.
- Typical properties (Median) charge around $88 per night.
- Entry-level properties (Bottom 25%) earn around $57 per night.
Average Daily Rate (ADR) Trend by Month in Blythewood
Get Live Blythewood Market Intelligence 👇
Explore Real-time Analytics
Airbnb Seasonality Analysis & Trends in Blythewood (2025)
Peak Season (June, March, July)
- Revenue averages $3,705 per month
- Occupancy rates average 50.3%
- Daily rates average $151
Shoulder Season
- Revenue averages $2,442 per month
- Occupancy maintains around 42.3%
- Daily rates hold near $168
Low Season (January, February, April)
- Revenue drops to average $1,583 per month
- Occupancy decreases to average 33.5%
- Daily rates adjust to average $155
Seasonality Insights for Blythewood
- The Airbnb seasonality in Blythewood shows highly seasonal trends requiring careful strategy. While the sections above show seasonal averages, it's also insightful to look at the extremes:
- During the high season, the absolute peak month showcases Blythewood's highest earning potential, with monthly revenues capable of climbing to $3,992, occupancy reaching a high of 61.3%, and ADRs peaking at $185.
- Conversely, the slowest single month of the year, typically falling within the low season, marks the market's lowest point. In this month, revenue might dip to $1,223, occupancy could drop to 24.3%, and ADRs may adjust down to $137.
- Understanding both the seasonal averages and these monthly peaks and troughs in revenue, occupancy, and ADR is crucial for maximizing your Airbnb profit potential in Blythewood.
Seasonal Strategies for Maximizing Profit
- Peak Season: Maximize revenue through premium pricing and potentially longer minimum stays. Ensure high availability.
- Low Season: Offer competitive pricing, special promotions (e.g., extended stay discounts), and flexible cancellation policies. Target off-season travelers like remote workers or budget-conscious guests.
- Shoulder Seasons: Implement dynamic pricing that balances peak and low rates. Target weekend travelers or specific events. Offer slightly more flexible terms than peak season.
- Regularly analyze your own performance against these Blythewood seasonality benchmarks and adjust your pricing and availability strategy accordingly.
Best Areas for Airbnb Investment in Blythewood (2025)
Exploring the top neighborhoods for short-term rentals in Blythewood? This section highlights key areas, outlining why they are attractive for hosts and guests, along with notable local attractions. Consider these locations based on your target guest profile and investment strategy.
| Neighborhood / Area | Why Host Here? (Target Guests & Appeal) | Key Attractions & Landmarks |
|---|---|---|
| Blythewood Downtown | Quaint town center with local shops and restaurants. Attracts visitors looking for a charming small-town experience with easy access to Columbia. | Blythewood Historical Society, Blythewood Park, Local Art Galleries, Blythewood Farmers Market, Blythewood Arts Festival |
| Lake Carolina | Popular residential community with beautiful homes and a large lake. Ideal for families and groups seeking a peaceful getaway with outdoor activities. | Lake Carolina, Walking Trails, Fishing and Boating, Local Parks, Community Events |
| LongCreek Plantation | Exclusive golf community featuring homes with scenic views. Great for travelers looking for a luxurious stay close to nature and golf. | LongCreek Golf Club, Lake access, Nature Trails, Community Clubhouse, Sports Facilities |
| Blythewood Historic District | Rich in history, this area has beautiful old homes and historic sites. Attracts visitors interested in culture and history. | Historic Blythewood Cemetery, Old Town Hall, Blythewood Baptist Church, Historical Markers, Civil War Trails |
| Doko Meadows Park | A beautiful park area with sports fields and event spaces. Popular for families and those looking for outdoor activities. | Doko Meadows Park, Walking Trails, Sports Facilities, Playgrounds, Community Events |
| Blythewood Country Club | An upscale area with a golf course and country club amenities. Attracts visitors seeking luxury accommodations and activities. | Blythewood Country Club, Golf Course, Dining Options, Social Events, Scenic Views |
| Richland Northeast | Suburban area that provides easy access to Columbia and is family-friendly. Appealing for longer stays and family gatherings. | Richland Northeast High School, Local Parks, Shopping Centers, Community Events, Dining Options |
| Blythewood Nature Preserve | A scenic natural area great for outdoor enthusiasts and nature lovers. Perfect for travelers looking to connect with nature. | Nature Trails, Picnic Areas, Bird Watching, Wildlife Viewing, Photography Spots |
Understanding Airbnb License Requirements & STR Laws in Blythewood (2025)
While Blythewood, South Carolina, United States currently shows low STR regulations, specific Airbnb license requirements might still exist or change. Always verify the latest short term rental regulations and Airbnb license requirements directly with local government authorities for Blythewood to ensure full compliance before hosting.
(Source: AirROI data, 2025, finding no licensed listings among those analyzed)
Top Performing Airbnb Properties in Blythewood (2025)
Benchmark your potential! Explore examples of top-performing Airbnb properties in Blythewoodbased on Trailing Twelve Month (TTM) revenue. Analyze their characteristics, revenue, occupancy rate, and ADR to understand what drives success in this market.

The Farm House
Entire Place • 4 bedrooms

4 Acres, Professionals, King, 5 TVs, Fast Wi-Fi
Entire Place • 4 bedrooms

Barndominium with Bocce Ball Court
Entire Place • 3 bedrooms

Peaceful Retreat Two
Entire Place • 1 bedroom
Peaceful Retreat One - Rooms
Private Room • 3 bedrooms

Avila Manor
Entire Place • 2 bedrooms
Note: Performance varies based on location, size, amenities, seasonality, and management quality. Data reflects the past 12 months.
Top Performing Airbnb Hosts in Blythewood (2025)
Learn from the best! This table showcases top-performing Airbnb hosts in Blythewood based on the number of properties managed and estimated total revenue over the past year. Analyze their scale and performance metrics.
| Host Name | Properties | Grossing Revenue | Stay Reviews | Avg Rating |
|---|---|---|---|---|
| Kim | 1 | $87,679 | 75 | 4.84/5.0 |
| Brad | 1 | $46,178 | 13 | 4.77/5.0 |
| Alvin | 1 | $32,795 | 55 | 4.89/5.0 |
| Kathy | 2 | $31,876 | 183 | 5.00/5.0 |
| Jeffrey Morris | 3 | $10,276 | 9 | 5.00/5.0 |
| Giovanna | 1 | $8,679 | 52 | 5.00/5.0 |
| Diamond | 1 | $8,306 | 19 | 4.79/5.0 |
| Terence | 1 | $6,566 | 4 | 4.50/5.0 |
| Host #456511812 | 1 | $6,496 | 1 | Not Rated |
| Theresa | 4 | $5,981 | 13 | 4.67/5.0 |
Analyzing the strategies of top hosts, such as their property selection, pricing, and guest communication, can offer valuable lessons for optimizing your own Airbnb operations in Blythewood.
Dive Deeper: Advanced Blythewood STR Market Data (2025)
Ready to unlock more insights? AirROI provides access to advanced metrics and comprehensive Airbnb data for Blythewood. Explore detailed analytics beyond this report to refine your investment strategy, optimize pricing, and maximize your vacation rental profits.
Explore Advanced MetricsBlythewood Short-Term Rental Market Composition (2025): Property & Room Types
Room Type Distribution
Property Type Distribution
Market Composition Insights for Blythewood
- The Blythewood Airbnb market composition is heavily skewed towards Private Room listings, which make up 55.6% of the 18 active rentals. This indicates strong guest preference for privacy and space.
- Looking at the property type distribution in Blythewood, House properties are the most common (77.8%), reflecting the local real estate landscape.
- Houses represent a significant 77.8% portion, catering likely to families or larger groups.
- The presence of 5.6% Hotel/Boutique listings indicates integration with traditional hospitality.
Blythewood Airbnb Room Capacity Analysis (2025): Bedroom Distribution
Distribution of Listings by Number of Bedrooms
Room Capacity Insights for Blythewood
- The dominant room capacity in Blythewood is 4 bedrooms listings, making up 16.7% of the market. This suggests a strong demand for properties suitable for families or small groups.
- Together, 4 bedrooms and 3 bedrooms properties represent 33.4% of the active Airbnb listings in Blythewood, indicating a high concentration in these sizes.
- A significant 33.4% of listings offer 3+ bedrooms, catering to larger groups and families seeking more space in Blythewood.
Blythewood Vacation Rental Guest Capacity Trends (2025)
Distribution of Listings by Guest Capacity
Guest Capacity Insights for Blythewood
- The most common guest capacity trend in Blythewood vacation rentals is listings accommodating 8+ guests (16.7%). This suggests the primary traveler segment is likely larger groups.
- Properties designed for 8+ guests and 6 guests dominate the Blythewood STR market, accounting for 33.4% of listings.
- 33.4% of properties accommodate 6+ guests, serving the market segment for larger families or group travel in Blythewood.
- On average, properties in Blythewood are equipped to host 2.8 guests.
Blythewood Airbnb Booking Patterns (2025): Available vs. Booked Days
Available Days Distribution
Booked Days Distribution
Booking Pattern Insights for Blythewood
- The most common availability pattern in Blythewood falls within the 271-366 days range, representing 66.7% of listings. This suggests many properties have significant open periods on their calendars.
- Approximately 83.4% of listings show high availability (181+ days open annually), indicating potential for increased bookings or specific owner usage patterns.
- For booked days, the 1-30 days range is most frequent in Blythewood (44.4%), reflecting common guest stay durations or potential owner blocking patterns.
- A notable 16.7% of properties secure long booking periods (181+ days booked per year), highlighting successful long-term rental strategies or significant owner usage.
Blythewood Airbnb Minimum Stay Requirements Analysis
Distribution of Listings by Minimum Night Requirement
1 Night
6 listings
33.3% of total
2 Nights
5 listings
27.8% of total
3 Nights
1 listings
5.6% of total
4-6 Nights
1 listings
5.6% of total
30+ Nights
5 listings
27.8% of total
Key Insights
- The most prevalent minimum stay requirement in Blythewood is 1 Night, adopted by 33.3% of listings. This highlights the market's preference for shorter, flexible bookings.
- A strong majority (61.1%) of the Blythewood Airbnb data shows acceptance of very short stays (1-2 nights), indicating a dynamic, high-turnover market.
- A significant segment (27.8%) caters to monthly stays (30+ nights) in Blythewood, pointing to opportunities in the extended-stay market.
Recommendations
- Align with the market by considering a 1 Night minimum stay, as 33.3% of Blythewood hosts use this setting.
- Explore offering discounts for stays of 30+ nights to attract the 27.8% of the market seeking extended stays.
- Adjust minimum nights based on seasonality – potentially shorter during low season and longer during peak demand periods in Blythewood.
Blythewood Airbnb Cancellation Policy Trends Analysis (2025)
Flexible
6 listings
35.3% of total
Moderate
6 listings
35.3% of total
Firm
4 listings
23.5% of total
Strict
1 listings
5.9% of total
Cancellation Policy Insights for Blythewood
- The prevailing Airbnb cancellation policy trend in Blythewood is Flexible, used by 35.3% of listings.
- The market strongly favors guest-friendly terms, with 70.6% of listings offering Flexible or Moderate policies. This suggests guests in Blythewood may expect booking flexibility.
- Strict cancellation policies are quite rare (5.9%), potentially making listings with this policy less competitive unless justified by high demand or property type.
Recommendations for Hosts
- Consider adopting a Flexible policy to align with the 35.3% market standard in Blythewood.
- Using a Strict policy might deter some guests, as only 5.9% of listings use it. Evaluate if potential revenue protection outweighs possible lower booking rates.
- Regularly review your cancellation policy against competitors and market demand shifts in Blythewood.
Blythewood STR Booking Lead Time Analysis (2025)
Average Booking Lead Time by Month
Booking Lead Time Insights for Blythewood
- The overall average booking lead time for vacation rentals in Blythewood is 26 days.
- Guests book furthest in advance for stays during June (average 58 days), likely coinciding with peak travel demand or local events.
- The shortest booking windows occur for stays in March (average 13 days), indicating more last-minute travel plans during this time.
- Seasonally, Summer (39 days avg.) sees the longest lead times, while Winter (26 days avg.) has the shortest, reflecting typical travel planning cycles.
Recommendations for Hosts
- Use the overall average lead time (26 days) as a baseline for your pricing and availability strategy in Blythewood.
- For June stays, consider implementing length-of-stay discounts or slightly higher rates for bookings made less than 58 days out to capitalize on advance planning.
- During March, focus on last-minute booking availability and promotions, as guests book with very short notice (13 days avg.).
- Target marketing efforts for the Summer season well in advance (at least 39 days) to capture early planners.
- Monitor your own booking lead times against these Blythewood averages to identify opportunities for dynamic pricing adjustments.
Popular & Essential Airbnb Amenities in Blythewood (2025)
Amenity Prevalence
Amenity Insights for Blythewood
- Essential amenities in Blythewood that guests expect include: Air conditioning, Free parking on premises, Smoke alarm, Carbon monoxide alarm, Wifi. Lacking these (any) could significantly impact bookings.
- Popular amenities like TV, Heating, Bed linens are common but not universal. Offering these can provide a competitive edge.
Recommendations for Hosts
- Ensure your listing includes all essential amenities for Blythewood: Air conditioning, Free parking on premises, Smoke alarm, Carbon monoxide alarm, Wifi.
- Consider adding popular differentiators like TV or Heating to increase appeal.
- Highlight unique or less common amenities you offer (e.g., hot tub, dedicated workspace, EV charger) in your listing description and photos.
- Regularly check competitor amenities in Blythewood to stay competitive.
Blythewood Airbnb Guest Demographics & Profile Analysis (2025)
Guest Profile Summary for Blythewood
- The typical guest profile for Airbnb in Blythewood consists of primarily domestic travelers (99%), often arriving from nearby Columbia, typically belonging to the Post-2000s (Gen Z/Alpha) group (50%), primarily speaking English or Spanish.
- Domestic travelers account for 98.8% of guests.
- Key international markets include United States (98.8%) and Germany (1.2%).
- Top languages spoken are English (81.8%) followed by Spanish (15.2%).
- A significant demographic segment is the Post-2000s (Gen Z/Alpha) group, representing 50% of guests.
Recommendations for Hosts
- Target domestic marketing efforts towards travelers from Columbia and Charleston.
- Tailor amenities and listing descriptions to appeal to the dominant Post-2000s (Gen Z/Alpha) demographic (e.g., highlight fast WiFi, smart home features, local guides).
- Highlight unique local experiences or amenities relevant to the primary guest profile.
- Consider seasonal promotions aligned with peak travel times for key origin markets.
Nearby Short-Term Rental Market Comparison
How does the Blythewood Airbnb market stack up against its neighbors? Compare key performance metrics like average monthly revenue, ADR, and occupancy rates in surrounding areas to understand the broader regional STR landscape.
| Market | Active Properties | Monthly Revenue | Daily Rate | Avg. Occupancy |
|---|---|---|---|---|
| Catawba | 15 | $6,080 | $570.32 | 39% |
| Denver | 101 | $5,441 | $574.87 | 43% |
| Sherrills Ford | 111 | $5,391 | $516.77 | 42% |
| Lake Norman of Catawba | 29 | $5,353 | $505.61 | 42% |
| Mooresville | 363 | $5,210 | $519.49 | 43% |
| Troutman | 50 | $4,742 | $424.73 | 44% |
| Chapin | 94 | $3,646 | $357.18 | 44% |
| Murrells Inlet | 341 | $3,328 | $357.16 | 41% |
| Gilbert | 21 | $3,323 | $238.99 | 49% |
| Summerton | 50 | $3,292 | $251.55 | 44% |