Campobello Airbnb Market Analysis 2026: Short Term Rental Data & Vacation Rental Statistics in South Carolina, United States
Is Airbnb profitable in Campobello in 2026? Explore comprehensive Airbnb analytics for Campobello, South Carolina, United States to uncover income potential. This 2026 STR market report for Campobello, based on AirROI data from February 2025 to January 2026, reveals key trends in the niche market of 41 active listings.
Whether you're considering an Airbnb investment in Campobello, optimizing your existing vacation rental, or exploring rental arbitrage opportunities, understanding the Campobello Airbnb data is crucial. Leveraging the low regulation environment is key to maximizing your short term rental income potential. Let's dive into the specifics.
Key Campobello Airbnb Performance Metrics Overview
Monthly Airbnb Revenue Variations & Income Potential in Campobello (2026)
Understanding the monthly revenue variations for Airbnb listings in Campobello is key to maximizing your short term rental income potential. Seasonality significantly impacts earnings. Our analysis, based on data from the past 12 months, shows that the peak revenue month for STRs in Campobello is typically October, while January often presents the lowest earnings, highlighting opportunities for strategic pricing adjustments during shoulder and low seasons. Explore the typical Airbnb income in Campobello across different performance tiers:
- Best-in-class properties (Top 10%) achieve $4,740+ monthly, often utilizing dynamic pricing and superior guest experiences.
- Strong performing properties (Top 25%) earn $2,942 or more, indicating effective management and desirable locations/amenities.
- Typical properties (Median) generate around $1,587 per month, representing the average market performance.
- Entry-level properties (Bottom 25%) see earnings around $812, often with potential for optimization.
Average Monthly Airbnb Earnings Trend in Campobello
Campobello Airbnb Occupancy Rate Trends (2026)
Maximize your bookings by understanding the Campobello STR occupancy trends. Seasonal demand shifts significantly influence how often properties are booked. Typically, Februarysees the highest demand (peak season occupancy), while January experiences the lowest (low season). Effective strategies, like adjusting minimum stays or offering promotions, can boost occupancy during slower periods. Here's how different property tiers perform in Campobello:
- Best-in-class properties (Top 10%) achieve 70%+ occupancy, indicating high desirability and potentially optimized availability.
- Strong performing properties (Top 25%) maintain 54% or higher occupancy, suggesting good market fit and guest satisfaction.
- Typical properties (Median) have an occupancy rate around 35%.
- Entry-level properties (Bottom 25%) average 17% occupancy, potentially facing higher vacancy.
Average Monthly Occupancy Rate Trend in Campobello
Average Daily Rate (ADR) Airbnb Trends in Campobello (2026)
Effective short term rental pricing strategy in Campobello involves understanding monthly ADR fluctuations. The Average Daily Rate (ADR) for Airbnb in Campobello typically peaks in September and dips lowest during February. Leveraging Airbnb dynamic pricing tools or strategies based on this seasonality can significantly boost revenue. Here's a look at the typical nightly rates achieved:
- Best-in-class properties (Top 10%) command rates of $394+ per night, often due to premium features or locations.
- Strong performing properties (Top 25%) achieve nightly rates of $248 or more.
- Typical properties (Median) charge around $148 per night.
- Entry-level properties (Bottom 25%) earn around $112 per night.
Average Daily Rate (ADR) Trend by Month in Campobello
Get Live Campobello Market Intelligence 👇

Explore Real-time Analytics
Airbnb Seasonality Analysis & Trends in Campobello (2026)
Peak Season (October, June, July)
- Revenue averages $3,036 per month
- Occupancy rates average 41.6%
- Daily rates average $298
Shoulder Season
- Revenue averages $2,437 per month
- Occupancy maintains around 38.3%
- Daily rates hold near $284
Low Season (January, February, September)
- Revenue drops to average $1,607 per month
- Occupancy decreases to average 31.6%
- Daily rates adjust to average $290
Seasonality Insights for Campobello
- The Airbnb seasonality in Campobello shows highly seasonal trends requiring careful strategy. While the sections above show seasonal averages, it's also insightful to look at the extremes:
- During the high season, the absolute peak month showcases Campobello's highest earning potential, with monthly revenues capable of climbing to $3,245, occupancy reaching a high of 45.5%, and ADRs peaking at $323.
- Conversely, the slowest single month of the year, typically falling within the low season, marks the market's lowest point. In this month, revenue might dip to $1,098, occupancy could drop to 19.2%, and ADRs may adjust down to $244.
- Understanding both the seasonal averages and these monthly peaks and troughs in revenue, occupancy, and ADR is crucial for maximizing your Airbnb profit potential in Campobello.
Seasonal Strategies for Maximizing Profit
- Peak Season: Maximize revenue through premium pricing and potentially longer minimum stays. Ensure high availability.
- Low Season: Offer competitive pricing, special promotions (e.g., extended stay discounts), and flexible cancellation policies. Target off-season travelers like remote workers or budget-conscious guests.
- Shoulder Seasons: Implement dynamic pricing that balances peak and low rates. Target weekend travelers or specific events. Offer slightly more flexible terms than peak season.
- Regularly analyze your own performance against these Campobello seasonality benchmarks and adjust your pricing and availability strategy accordingly.
Best Areas for Airbnb Investment in Campobello (2026)
Exploring the top neighborhoods for short-term rentals in Campobello? This section highlights key areas, outlining why they are attractive for hosts and guests, along with notable local attractions. Consider these locations based on your target guest profile and investment strategy.
| Neighborhood / Area | Why Host Here? (Target Guests & Appeal) | Key Attractions & Landmarks |
|---|---|---|
| Downtown Campobello | The heart of Campobello, featuring a small-town charm and proximity to essential amenities. Great for guests looking for convenience and easy access to local attractions. | Campobello Town Hall, local shops, restaurants, community parks |
| Lake Bowen | A serene area around the lake, perfect for nature lovers and those wanting to enjoy outdoor activities. Popular with families for weekend getaways. | Lake Bowen, fishing and boating opportunities, picnic areas, hiking trails |
| Hollywild Animal Park | An exciting location for animal lovers and families. This park provides a unique experience for guests of all ages, making it a great draw for Airbnb hosting. | Hollywild Animal Park, wildlife encounters, seasonal events, educational workshops |
| Spartanburg County Parks | Accessible from Campobello, these parks offer extensive recreational facilities and events, attracting outdoor enthusiasts and families visiting the area. | Cowpens National Battlefield, the parks' walking trails, playgrounds, sports facilities |
| Campobello Historic District | Featuring charming historic buildings and rich history, this area attracts visitors interested in local culture and history, boosting potential for short-term rentals. | Historical homes, local museums, community events, art galleries |
| Greenville-Spartanburg International Airport | Proximity to the airport is advantageous for guests traveling to the area, making Campobello an appealing option for transit stays. | Airport amenities, short drives to nearby attractions, convenience for business travelers |
| Riverside | A quiet and beautiful area near the river, ideal for guests seeking tranquility and nature, often preferred by those looking for long stays. | Riverside Park, fishing points, walking trails, scenic views |
| Chesnee | Close to Campobello and featuring local attractions, Chesnee is a small town appealing for visitors looking for local Southern hospitality and culture. | Chesnee Historical Museum, local farms, craft fairs, small-town shops |
Understanding Airbnb License Requirements & STR Laws in Campobello (2026)
While Campobello, South Carolina, United States currently shows low STR regulations, specific Airbnb license requirements might still exist or change. Always verify the latest short term rental regulations and Airbnb license requirements directly with local government authorities for Campobello to ensure full compliance before hosting.
(Source: AirROI data, 2026, finding no licensed listings among those analyzed)
Top Performing Airbnb Properties in Campobello (2026)
Benchmark your potential! Explore examples of top-performing Airbnb properties in Campobellobased on Trailing Twelve Month (TTM) revenue. Analyze their characteristics, revenue, occupancy rate, and ADR to understand what drives success in this market.
Old Mill Event Lodge in Campobello 10br sleeps 44
Entire Place • 10 bedrooms
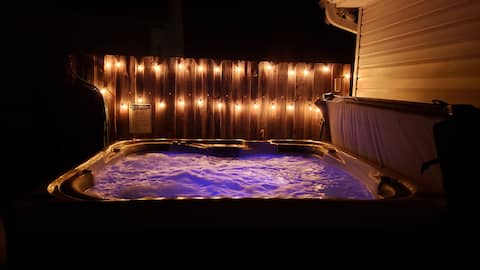
HOT TUB Sleeps 11 Gameroom Cozy Getaway
Entire Place • 4 bedrooms

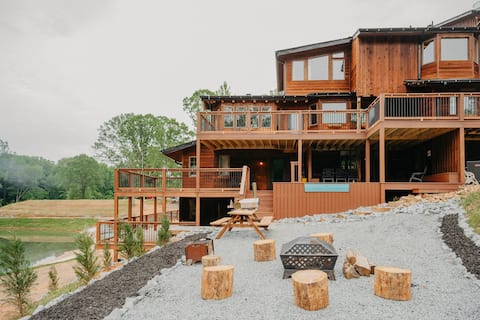
The Big Sycamore
Entire Place • 4 bedrooms
Carolina Luxury-Sleeps 14-Landrum|Tryon|TIEC 20 Mn
Entire Place • 5 bedrooms
7br Old Mill Village Bunk House sleeps 28
Entire Place • 8 bedrooms
The Little Chicago Place
Entire Place • 3 bedrooms
Note: Performance varies based on location, size, amenities, seasonality, and management quality. Data reflects the past 12 months.
Top Performing Airbnb Hosts in Campobello (2026)
Learn from the best! This table showcases top-performing Airbnb hosts in Campobello based on the number of properties managed and estimated total revenue over the past year. Analyze their scale and performance metrics.
| Host Name | Properties | Grossing Revenue | Stay Reviews | Avg Rating |
|---|---|---|---|---|
| Citi | 5 | $172,242 | 32 | 4.05/5.0 |
| Deby | 4 | $88,236 | 155 | 4.92/5.0 |
| Tyler | 3 | $77,687 | 146 | 4.98/5.0 |
| Abigail | 1 | $58,799 | 250 | 4.97/5.0 |
| Casey | 2 | $54,672 | 129 | 4.91/5.0 |
| Jennifer | 2 | $37,049 | 32 | 5.00/5.0 |
| Erin | 1 | $36,470 | 62 | 4.98/5.0 |
| Jeff | 2 | $33,871 | 347 | 4.97/5.0 |
| Dawn | 1 | $23,483 | 94 | 4.99/5.0 |
| Michelle | 1 | $23,344 | 33 | 4.97/5.0 |
Analyzing the strategies of top hosts, such as their property selection, pricing, and guest communication, can offer valuable lessons for optimizing your own Airbnb operations in Campobello.
Dive Deeper: Advanced Campobello STR Market Data (2026)
Ready to unlock more insights? AirROI provides access to advanced metrics and comprehensive Airbnb data for Campobello. Explore detailed analytics beyond this report to refine your investment strategy, optimize pricing, and maximize your vacation rental profits.
Explore Advanced MetricsCampobello Short-Term Rental Market Composition (2026): Property & Room Types
Room Type Distribution
Property Type Distribution
Market Composition Insights for Campobello
- The Campobello Airbnb market composition is heavily skewed towards Entire Home/Apt listings, which make up 100% of the 41 active rentals. This indicates strong guest preference for privacy and space.
- Looking at the property type distribution in Campobello, House properties are the most common (58.5%), reflecting the local real estate landscape.
- Houses represent a significant 58.5% portion, catering likely to families or larger groups.
- Smaller segments like others, unique stays, hotel/boutique (combined 14.7%) offer potential for unique stay experiences.
Campobello Airbnb Room Capacity Analysis (2026): Bedroom Distribution
Distribution of Listings by Number of Bedrooms
Room Capacity Insights for Campobello
- The dominant room capacity in Campobello is 2 bedrooms listings, making up 29.3% of the market. This suggests a strong demand for properties suitable for couples or solo travelers.
- Together, 2 bedrooms and 3 bedrooms properties represent 53.7% of the active Airbnb listings in Campobello, indicating a high concentration in these sizes.
- A significant 41.5% of listings offer 3+ bedrooms, catering to larger groups and families seeking more space in Campobello.
Campobello Vacation Rental Guest Capacity Trends (2026)
Distribution of Listings by Guest Capacity
Guest Capacity Insights for Campobello
- The most common guest capacity trend in Campobello vacation rentals is listings accommodating 8+ guests (24.4%). This suggests the primary traveler segment is likely larger groups.
- Properties designed for 8+ guests and 6 guests dominate the Campobello STR market, accounting for 48.8% of listings.
- 53.7% of properties accommodate 6+ guests, serving the market segment for larger families or group travel in Campobello.
- On average, properties in Campobello are equipped to host 5.5 guests.
Campobello Airbnb Booking Patterns (2026): Available vs. Booked Days
Available Days Distribution
Booked Days Distribution
Booking Pattern Insights for Campobello
- The most common availability pattern in Campobello falls within the 271-366 days range, representing 56.1% of listings. This suggests many properties have significant open periods on their calendars.
- Approximately 92.7% of listings show high availability (181+ days open annually), indicating potential for increased bookings or specific owner usage patterns.
- For booked days, the 91-180 days range is most frequent in Campobello (41.5%), reflecting common guest stay durations or potential owner blocking patterns.
- A notable 12.2% of properties secure long booking periods (181+ days booked per year), highlighting successful long-term rental strategies or significant owner usage.
Campobello Airbnb Minimum Stay Requirements Analysis
Distribution of Listings by Minimum Night Requirement
1 Night
16 listings
39% of total
2 Nights
15 listings
36.6% of total
3 Nights
1 listings
2.4% of total
4-6 Nights
1 listings
2.4% of total
30+ Nights
8 listings
19.5% of total
Key Insights
- The most prevalent minimum stay requirement in Campobello is 1 Night, adopted by 39% of listings. This highlights the market's preference for shorter, flexible bookings.
- A strong majority (75.6%) of the Campobello Airbnb data shows acceptance of very short stays (1-2 nights), indicating a dynamic, high-turnover market.
- A significant segment (19.5%) caters to monthly stays (30+ nights) in Campobello, pointing to opportunities in the extended-stay market.
Recommendations
- Align with the market by considering a 1 Night minimum stay, as 39% of Campobello hosts use this setting.
- Explore offering discounts for stays of 30+ nights to attract the 19.5% of the market seeking extended stays.
- Adjust minimum nights based on seasonality – potentially shorter during low season and longer during peak demand periods in Campobello.
Campobello Airbnb Cancellation Policy Trends Analysis (2026)
Flexible
18 listings
43.9% of total
Moderate
13 listings
31.7% of total
Firm
7 listings
17.1% of total
Strict
3 listings
7.3% of total
Cancellation Policy Insights for Campobello
- The prevailing Airbnb cancellation policy trend in Campobello is Flexible, used by 43.9% of listings.
- The market strongly favors guest-friendly terms, with 75.6% of listings offering Flexible or Moderate policies. This suggests guests in Campobello may expect booking flexibility.
- Strict cancellation policies are quite rare (7.3%), potentially making listings with this policy less competitive unless justified by high demand or property type.
Recommendations for Hosts
- Consider adopting a Flexible policy to align with the 43.9% market standard in Campobello.
- Using a Strict policy might deter some guests, as only 7.3% of listings use it. Evaluate if potential revenue protection outweighs possible lower booking rates.
- Regularly review your cancellation policy against competitors and market demand shifts in Campobello.
Campobello STR Booking Lead Time Analysis (2026)
Average Booking Lead Time by Month
Booking Lead Time Insights for Campobello
- The overall average booking lead time for vacation rentals in Campobello is 31 days.
- Guests book furthest in advance for stays during December (average 47 days), likely coinciding with peak travel demand or local events.
- The shortest booking windows occur for stays in January (average 15 days), indicating more last-minute travel plans during this time.
- Seasonally, Summer (33 days avg.) sees the longest lead times, while Spring (27 days avg.) has the shortest, reflecting typical travel planning cycles.
Recommendations for Hosts
- Use the overall average lead time (31 days) as a baseline for your pricing and availability strategy in Campobello.
- For December stays, consider implementing length-of-stay discounts or slightly higher rates for bookings made less than 47 days out to capitalize on advance planning.
- Target marketing efforts for the Summer season well in advance (at least 33 days) to capture early planners.
- Monitor your own booking lead times against these Campobello averages to identify opportunities for dynamic pricing adjustments.
Popular & Essential Airbnb Amenities in Campobello (2026)
Amenity Prevalence
Amenity Insights for Campobello
- Essential amenities in Campobello that guests expect include: Free parking on premises, Smoke alarm, Air conditioning, Wifi. Lacking these (any) could significantly impact bookings.
- Popular amenities like Heating, Fire extinguisher, Hot water are common but not universal. Offering these can provide a competitive edge.
Recommendations for Hosts
- Ensure your listing includes all essential amenities for Campobello: Free parking on premises, Smoke alarm, Air conditioning, Wifi.
- Prioritize adding missing essentials: Free parking on premises, Smoke alarm, Air conditioning, Wifi.
- Consider adding popular differentiators like Heating or Fire extinguisher to increase appeal.
- Highlight unique or less common amenities you offer (e.g., hot tub, dedicated workspace, EV charger) in your listing description and photos.
- Regularly check competitor amenities in Campobello to stay competitive.
Campobello Airbnb Guest Demographics & Profile Analysis (2026)
Guest Profile Summary for Campobello
- The typical guest profile for Airbnb in Campobello consists of primarily domestic travelers (98%), often arriving from nearby Greenville, typically belonging to the Post-2000s (Gen Z/Alpha) group (50%), primarily speaking English or Spanish.
- Domestic travelers account for 98.1% of guests.
- Key international markets include United States (98.1%) and Costa Rica (0.5%).
- Top languages spoken are English (73.1%) followed by Spanish (14.4%).
- A significant demographic segment is the Post-2000s (Gen Z/Alpha) group, representing 50% of guests.
Recommendations for Hosts
- Target domestic marketing efforts towards travelers from Greenville and Columbia.
- Tailor amenities and listing descriptions to appeal to the dominant Post-2000s (Gen Z/Alpha) demographic (e.g., highlight fast WiFi, smart home features, local guides).
- Highlight unique local experiences or amenities relevant to the primary guest profile.
- Consider seasonal promotions aligned with peak travel times for key origin markets.
Nearby Short-Term Rental Market Comparison
How does the Campobello Airbnb market stack up against its neighbors? Compare key performance metrics like average monthly revenue, ADR, and occupancy rates in surrounding areas to understand the broader regional STR landscape.
| Market | Active Properties | Monthly Revenue | Daily Rate | Avg. Occupancy |
|---|---|---|---|---|
| Sevier County | 68 | $7,108 | $567.95 | 44% |
| Catawba | 16 | $6,093 | $582.49 | 38% |
| Union Mills | 15 | $4,938 | $442.76 | 41% |
| Sevierville | 6,269 | $4,747 | $370.20 | 46% |
| Six Mile | 57 | $4,396 | $449.78 | 42% |
| Gatlinburg | 3,565 | $4,385 | $353.70 | 45% |
| Commerce | 19 | $4,298 | $285.34 | 45% |
| Pigeon Forge | 2,938 | $4,158 | $337.10 | 45% |
| West Union | 30 | $4,126 | $564.92 | 32% |
| Sautee | 14 | $4,105 | $408.17 | 39% |