Greenwood Airbnb Market Analysis 2026: Short Term Rental Data & Vacation Rental Statistics in South Carolina, United States
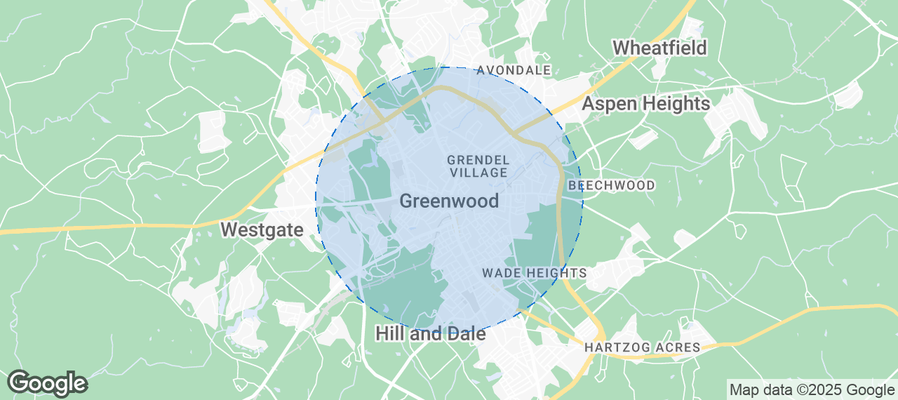
Is Airbnb profitable in Greenwood in 2026? Explore comprehensive Airbnb analytics for Greenwood, South Carolina, United States to uncover income potential. This 2026 STR market report for Greenwood, based on AirROI data from February 2025 to January 2026, reveals key trends in the niche market of 67 active listings.
Whether you're considering an Airbnb investment in Greenwood, optimizing your existing vacation rental, or exploring rental arbitrage opportunities, understanding the Greenwood Airbnb data is crucial. Leveraging the low regulation environment is key to maximizing your short term rental income potential. Let's dive into the specifics.
Key Greenwood Airbnb Performance Metrics Overview
Monthly Airbnb Revenue Variations & Income Potential in Greenwood (2026)
Understanding the monthly revenue variations for Airbnb listings in Greenwood is key to maximizing your short term rental income potential. Seasonality significantly impacts earnings. Our analysis, based on data from the past 12 months, shows that the peak revenue month for STRs in Greenwood is typically July, while January often presents the lowest earnings, highlighting opportunities for strategic pricing adjustments during shoulder and low seasons. Explore the typical Airbnb income in Greenwood across different performance tiers:
- Best-in-class properties (Top 10%) achieve $4,892+ monthly, often utilizing dynamic pricing and superior guest experiences.
- Strong performing properties (Top 25%) earn $3,557 or more, indicating effective management and desirable locations/amenities.
- Typical properties (Median) generate around $2,246 per month, representing the average market performance.
- Entry-level properties (Bottom 25%) see earnings around $1,132, often with potential for optimization.
Average Monthly Airbnb Earnings Trend in Greenwood
Greenwood Airbnb Occupancy Rate Trends (2026)
Maximize your bookings by understanding the Greenwood STR occupancy trends. Seasonal demand shifts significantly influence how often properties are booked. Typically, Marchsees the highest demand (peak season occupancy), while January experiences the lowest (low season). Effective strategies, like adjusting minimum stays or offering promotions, can boost occupancy during slower periods. Here's how different property tiers perform in Greenwood:
- Best-in-class properties (Top 10%) achieve 77%+ occupancy, indicating high desirability and potentially optimized availability.
- Strong performing properties (Top 25%) maintain 64% or higher occupancy, suggesting good market fit and guest satisfaction.
- Typical properties (Median) have an occupancy rate around 44%.
- Entry-level properties (Bottom 25%) average 25% occupancy, potentially facing higher vacancy.
Average Monthly Occupancy Rate Trend in Greenwood
Average Daily Rate (ADR) Airbnb Trends in Greenwood (2026)
Effective short term rental pricing strategy in Greenwood involves understanding monthly ADR fluctuations. The Average Daily Rate (ADR) for Airbnb in Greenwood typically peaks in October and dips lowest during February. Leveraging Airbnb dynamic pricing tools or strategies based on this seasonality can significantly boost revenue. Here's a look at the typical nightly rates achieved:
- Best-in-class properties (Top 10%) command rates of $255+ per night, often due to premium features or locations.
- Strong performing properties (Top 25%) achieve nightly rates of $215 or more.
- Typical properties (Median) charge around $154 per night.
- Entry-level properties (Bottom 25%) earn around $101 per night.
Average Daily Rate (ADR) Trend by Month in Greenwood
Get Live Greenwood Market Intelligence 👇
Explore Real-time Analytics
Airbnb Seasonality Analysis & Trends in Greenwood (2026)
Peak Season (July, August, June)
- Revenue averages $3,090 per month
- Occupancy rates average 47.6%
- Daily rates average $171
Shoulder Season
- Revenue averages $2,629 per month
- Occupancy maintains around 47.3%
- Daily rates hold near $168
Low Season (January, February, December)
- Revenue drops to average $2,005 per month
- Occupancy decreases to average 38.6%
- Daily rates adjust to average $168
Seasonality Insights for Greenwood
- The Airbnb seasonality in Greenwood shows moderate seasonality with distinct peak and low periods. While the sections above show seasonal averages, it's also insightful to look at the extremes:
- During the high season, the absolute peak month showcases Greenwood's highest earning potential, with monthly revenues capable of climbing to $3,298, occupancy reaching a high of 57.3%, and ADRs peaking at $177.
- Conversely, the slowest single month of the year, typically falling within the low season, marks the market's lowest point. In this month, revenue might dip to $1,599, occupancy could drop to 27.4%, and ADRs may adjust down to $153.
- Understanding both the seasonal averages and these monthly peaks and troughs in revenue, occupancy, and ADR is crucial for maximizing your Airbnb profit potential in Greenwood.
Seasonal Strategies for Maximizing Profit
- Peak Season: Maximize revenue through premium pricing and potentially longer minimum stays. Ensure high availability.
- Low Season: Offer competitive pricing, special promotions (e.g., extended stay discounts), and flexible cancellation policies. Target off-season travelers like remote workers or budget-conscious guests.
- Shoulder Seasons: Implement dynamic pricing that balances peak and low rates. Target weekend travelers or specific events. Offer slightly more flexible terms than peak season.
- Regularly analyze your own performance against these Greenwood seasonality benchmarks and adjust your pricing and availability strategy accordingly.
Best Areas for Airbnb Investment in Greenwood (2026)
Exploring the top neighborhoods for short-term rentals in Greenwood? This section highlights key areas, outlining why they are attractive for hosts and guests, along with notable local attractions. Consider these locations based on your target guest profile and investment strategy.
| Neighborhood / Area | Why Host Here? (Target Guests & Appeal) | Key Attractions & Landmarks |
|---|---|---|
| Downtown Greenwood | The vibrant hub of Greenwood with a mix of history and modernity. Attracts both business travelers and tourists due to its central location and variety of dining and shopping options. | Lander University, Greenwood Museum, Uptown Market, Emerald Farm, Palmetto Festival Grounds |
| Lake Hartwell | A popular outdoor destination known for fishing, boating, and summer vacations. Ideal for those looking for a lakeside retreat. | Lake Hartwell State Park, Fishing and boating activities, Hartwell Dam, Ft. Yargo State Park, Parks and picnic areas |
| West End | A flourishing area known for its artistic community and boutique shops. Perfect for travelers looking for a charming experience close to arts and culture. | West End Historic District, Art galleries, Local theaters, Restaurants and cafes, Annual events and festivals |
| Emerald Triangle | A unique area with a blend of natural beauty and cultural heritage. Attracts families and nature enthusiasts looking for outdoor fun. | Lake Hartwell, Ninety Six National Historic Site, Greenwood State Park, Walking trails, Nature activities |
| Greenwood Historic District | Rich in history with beautifully restored homes and businesses. Great for those who appreciate heritage and a sense of community. | Historic sites, Local restaurants, Cultural events, Art galleries, Community festivals |
| Broad Street | Known for its vibrant shopping and dining options, this area is ideal for those looking to enjoy local cuisine and unique shops. | Shops and boutiques, Restaurants, Art studios, Theatre events, Public gatherings |
| Piedmont | A quiet suburban area that offers access to outdoor activities and family-friendly amenities. Attractive for families and longer stays. | Parks and recreational areas, Community events, Local dining, Sports facilities, Outdoor trails |
| Greenwood Area | Expanding region with plenty of potential for investment and tourism. Great for those looking to tap into growing markets. | Nearby lakes, Local attractions, Emerging businesses, Community parks, Recreational leagues |
Understanding Airbnb License Requirements & STR Laws in Greenwood (2026)
While Greenwood, South Carolina, United States currently shows low STR regulations, specific Airbnb license requirements might still exist or change. Always verify the latest short term rental regulations and Airbnb license requirements directly with local government authorities for Greenwood to ensure full compliance before hosting.
(Source: AirROI data, 2026, finding no licensed listings among those analyzed)
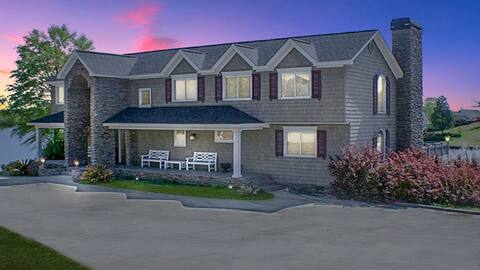
Top Performing Airbnb Properties in Greenwood (2026)
Benchmark your potential! Explore examples of top-performing Airbnb properties in Greenwoodbased on Trailing Twelve Month (TTM) revenue. Analyze their characteristics, revenue, occupancy rate, and ADR to understand what drives success in this market.

Lakefront Home and Cabin on Lake Greenwood
Entire Place • 3 bedrooms
Luxury 6 Bedroom 4.5 bath Lakefront Escape
Entire Place • 6 bedrooms
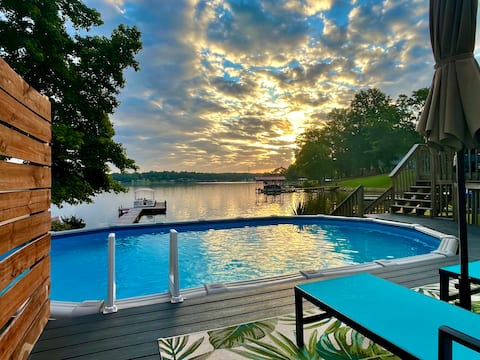
Pool, King, Fireplace, Lakefront, Kayaks, Firepit
Entire Place • 3 bedrooms

Lake Greenwood Private Home
Entire Place • 2 bedrooms

Greenwood Getaway w/ Furnished Patio & Lake View
Entire Place • 2 bedrooms

Charming 4-Bedroom Home!
Entire Place • 4 bedrooms
Note: Performance varies based on location, size, amenities, seasonality, and management quality. Data reflects the past 12 months.
Top Performing Airbnb Hosts in Greenwood (2026)
Learn from the best! This table showcases top-performing Airbnb hosts in Greenwood based on the number of properties managed and estimated total revenue over the past year. Analyze their scale and performance metrics.
| Host Name | Properties | Grossing Revenue | Stay Reviews | Avg Rating |
|---|---|---|---|---|
| Evolve | 11 | $257,366 | 161 | 4.77/5.0 |
| Lauren | 3 | $149,767 | 295 | 4.96/5.0 |
| Vinetta | 3 | $82,550 | 180 | 4.91/5.0 |
| Renee' | 1 | $69,497 | 45 | 4.84/5.0 |
| Joel | 1 | $68,326 | 87 | 4.99/5.0 |
| Francisco | 2 | $61,413 | 101 | 4.88/5.0 |
| April | 3 | $56,046 | 247 | 4.89/5.0 |
| Chase | 2 | $54,406 | 236 | 4.97/5.0 |
| Tamara | 2 | $50,798 | 65 | 4.94/5.0 |
| Sol | 1 | $39,923 | 23 | 4.87/5.0 |
Analyzing the strategies of top hosts, such as their property selection, pricing, and guest communication, can offer valuable lessons for optimizing your own Airbnb operations in Greenwood.
Dive Deeper: Advanced Greenwood STR Market Data (2026)
Ready to unlock more insights? AirROI provides access to advanced metrics and comprehensive Airbnb data for Greenwood. Explore detailed analytics beyond this report to refine your investment strategy, optimize pricing, and maximize your vacation rental profits.
Explore Advanced MetricsGreenwood Short-Term Rental Market Composition (2026): Property & Room Types
Room Type Distribution
Property Type Distribution
Market Composition Insights for Greenwood
- The Greenwood Airbnb market composition is heavily skewed towards Entire Home/Apt listings, which make up 89.6% of the 67 active rentals. This indicates strong guest preference for privacy and space.
- Looking at the property type distribution in Greenwood, House properties are the most common (82.1%), reflecting the local real estate landscape.
- Houses represent a significant 82.1% portion, catering likely to families or larger groups.
- Smaller segments like others, hotel/boutique (combined 6.0%) offer potential for unique stay experiences.
Greenwood Airbnb Room Capacity Analysis (2026): Bedroom Distribution
Distribution of Listings by Number of Bedrooms
Room Capacity Insights for Greenwood
- The dominant room capacity in Greenwood is 3 bedrooms listings, making up 34.3% of the market. This suggests a strong demand for properties suitable for families or small groups.
- Together, 3 bedrooms and 2 bedrooms properties represent 64.2% of the active Airbnb listings in Greenwood, indicating a high concentration in these sizes.
- A significant 43.3% of listings offer 3+ bedrooms, catering to larger groups and families seeking more space in Greenwood.
Greenwood Vacation Rental Guest Capacity Trends (2026)
Distribution of Listings by Guest Capacity
Guest Capacity Insights for Greenwood
- The most common guest capacity trend in Greenwood vacation rentals is listings accommodating 8+ guests (26.9%). This suggests the primary traveler segment is likely larger groups.
- Properties designed for 8+ guests and 6 guests dominate the Greenwood STR market, accounting for 53.8% of listings.
- 58.3% of properties accommodate 6+ guests, serving the market segment for larger families or group travel in Greenwood.
- On average, properties in Greenwood are equipped to host 5.1 guests.
Greenwood Airbnb Booking Patterns (2026): Available vs. Booked Days
Available Days Distribution
Booked Days Distribution
Booking Pattern Insights for Greenwood
- The most common availability pattern in Greenwood falls within the 181-270 days range, representing 43.3% of listings. This suggests many properties have significant open periods on their calendars.
- Approximately 83.6% of listings show high availability (181+ days open annually), indicating potential for increased bookings or specific owner usage patterns.
- For booked days, the 91-180 days range is most frequent in Greenwood (43.3%), reflecting common guest stay durations or potential owner blocking patterns.
- A notable 17.9% of properties secure long booking periods (181+ days booked per year), highlighting successful long-term rental strategies or significant owner usage.
Greenwood Airbnb Minimum Stay Requirements Analysis
Distribution of Listings by Minimum Night Requirement
1 Night
14 listings
20.9% of total
2 Nights
29 listings
43.3% of total
3 Nights
2 listings
3% of total
7-29 Nights
1 listings
1.5% of total
30+ Nights
21 listings
31.3% of total
Key Insights
- The most prevalent minimum stay requirement in Greenwood is 2 Nights, adopted by 43.3% of listings. This highlights the market's preference for shorter, flexible bookings.
- A strong majority (64.2%) of the Greenwood Airbnb data shows acceptance of very short stays (1-2 nights), indicating a dynamic, high-turnover market.
- A significant segment (31.3%) caters to monthly stays (30+ nights) in Greenwood, pointing to opportunities in the extended-stay market.
Recommendations
- Align with the market by considering a 2 Nights minimum stay, as 43.3% of Greenwood hosts use this setting.
- If feasible, allowing 1-night stays, especially midweek or during low season, could capture last-minute bookings, as only 20.9% currently do.
- Explore offering discounts for stays of 30+ nights to attract the 31.3% of the market seeking extended stays.
- Adjust minimum nights based on seasonality – potentially shorter during low season and longer during peak demand periods in Greenwood.
Greenwood Airbnb Cancellation Policy Trends Analysis (2026)
Flexible
12 listings
17.9% of total
Moderate
19 listings
28.4% of total
Firm
22 listings
32.8% of total
Strict
14 listings
20.9% of total
Cancellation Policy Insights for Greenwood
- The prevailing Airbnb cancellation policy trend in Greenwood is Firm, used by 32.8% of listings.
- A majority (53.7%) of hosts in Greenwood utilize Firm or Strict policies, indicating a market where hosts prioritize booking security.
Recommendations for Hosts
- Consider adopting a Firm policy to align with the 32.8% market standard in Greenwood.
- Regularly review your cancellation policy against competitors and market demand shifts in Greenwood.
Greenwood STR Booking Lead Time Analysis (2026)
Average Booking Lead Time by Month
Booking Lead Time Insights for Greenwood
- The overall average booking lead time for vacation rentals in Greenwood is 27 days.
- Guests book furthest in advance for stays during April (average 42 days), likely coinciding with peak travel demand or local events.
- The shortest booking windows occur for stays in February (average 14 days), indicating more last-minute travel plans during this time.
- Seasonally, Spring (35 days avg.) sees the longest lead times, while Winter (19 days avg.) has the shortest, reflecting typical travel planning cycles.
Recommendations for Hosts
- Use the overall average lead time (27 days) as a baseline for your pricing and availability strategy in Greenwood.
- For April stays, consider implementing length-of-stay discounts or slightly higher rates for bookings made less than 42 days out to capitalize on advance planning.
- During February, focus on last-minute booking availability and promotions, as guests book with very short notice (14 days avg.).
- Target marketing efforts for the Spring season well in advance (at least 35 days) to capture early planners.
- Monitor your own booking lead times against these Greenwood averages to identify opportunities for dynamic pricing adjustments.
Popular & Essential Airbnb Amenities in Greenwood (2026)
Amenity Prevalence
Amenity Insights for Greenwood
- Essential amenities in Greenwood that guests expect include: Air conditioning, Wifi, Free parking on premises, Smoke alarm. Lacking these (any) could significantly impact bookings.
- Popular amenities like TV, Heating, Kitchen are common but not universal. Offering these can provide a competitive edge.
Recommendations for Hosts
- Ensure your listing includes all essential amenities for Greenwood: Air conditioning, Wifi, Free parking on premises, Smoke alarm.
- Prioritize adding missing essentials: Free parking on premises, Smoke alarm.
- Consider adding popular differentiators like TV or Heating to increase appeal.
- Highlight unique or less common amenities you offer (e.g., hot tub, dedicated workspace, EV charger) in your listing description and photos.
- Regularly check competitor amenities in Greenwood to stay competitive.
Greenwood Airbnb Guest Demographics & Profile Analysis (2026)
Guest Profile Summary for Greenwood
- The typical guest profile for Airbnb in Greenwood consists of primarily domestic travelers (97%), often arriving from nearby Charlotte, typically belonging to the Post-2000s (Gen Z/Alpha) group (50%), primarily speaking English or Spanish.
- Domestic travelers account for 97.2% of guests.
- Key international markets include United States (97.2%) and Honduras (0.6%).
- Top languages spoken are English (77.2%) followed by Spanish (8.8%).
- A significant demographic segment is the Post-2000s (Gen Z/Alpha) group, representing 50% of guests.
Recommendations for Hosts
- Target domestic marketing efforts towards travelers from Charlotte and Columbia.
- Tailor amenities and listing descriptions to appeal to the dominant Post-2000s (Gen Z/Alpha) demographic (e.g., highlight fast WiFi, smart home features, local guides).
- Highlight unique local experiences or amenities relevant to the primary guest profile.
- Consider seasonal promotions aligned with peak travel times for key origin markets.
Nearby Short-Term Rental Market Comparison
How does the Greenwood Airbnb market stack up against its neighbors? Compare key performance metrics like average monthly revenue, ADR, and occupancy rates in surrounding areas to understand the broader regional STR landscape.
| Market | Active Properties | Monthly Revenue | Daily Rate | Avg. Occupancy |
|---|---|---|---|---|
| Sevier County | 68 | $7,108 | $567.95 | 44% |
| Catawba | 16 | $6,093 | $582.49 | 38% |
| Bogart | 13 | $5,528 | $637.81 | 35% |
| Union Mills | 15 | $4,938 | $442.76 | 41% |
| Sevierville | 6,269 | $4,747 | $370.20 | 46% |
| Six Mile | 57 | $4,396 | $449.78 | 42% |
| Gatlinburg | 3,565 | $4,385 | $353.70 | 45% |
| Commerce | 19 | $4,298 | $285.34 | 45% |
| Eatonton | 236 | $4,178 | $502.80 | 33% |
| Pigeon Forge | 2,938 | $4,158 | $337.10 | 45% |