Brentwood Airbnb Market Analysis 2025: Short Term Rental Data & Vacation Rental Statistics in Tennessee, United States
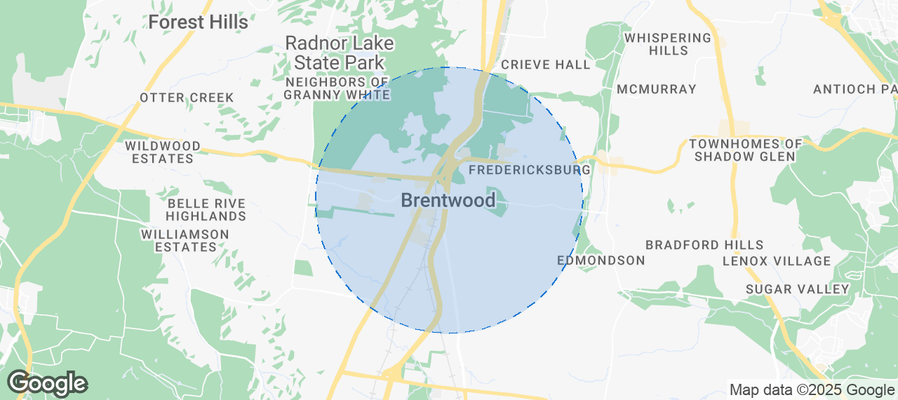
Is Airbnb profitable in Brentwood in 2025? Explore comprehensive Airbnb analytics for Brentwood, Tennessee, United States to uncover income potential. This 2025 STR market report for Brentwood, based on AirROI data from April 2024 to March 2025, reveals key trends in the niche market of 17 active listings.
Whether you're considering an Airbnb investment in Brentwood, optimizing your existing vacation rental, or exploring rental arbitrage opportunities, understanding the Brentwood Airbnb data is crucial. Leveraging the low regulation environment is key to maximizing your short term rental income potential. Let's dive into the specifics.
Key Brentwood Airbnb Performance Metrics Overview
Monthly Airbnb Revenue Variations & Income Potential in Brentwood (2025)
Understanding the monthly revenue variations for Airbnb listings in Brentwood is key to maximizing your short term rental income potential. Seasonality significantly impacts earnings. Our analysis, based on data from the past 12 months, shows that the peak revenue month for STRs in Brentwood is typically April, while March often presents the lowest earnings, highlighting opportunities for strategic pricing adjustments during shoulder and low seasons. Explore the typical Airbnb income in Brentwood across different performance tiers:
- Best-in-class properties (Top 10%) achieve $15,735+ monthly, often utilizing dynamic pricing and superior guest experiences.
- Strong performing properties (Top 25%) earn $5,973 or more, indicating effective management and desirable locations/amenities.
- Typical properties (Median) generate around $3,276 per month, representing the average market performance.
- Entry-level properties (Bottom 25%) see earnings around $1,818, often with potential for optimization.
Average Monthly Airbnb Earnings Trend in Brentwood
Brentwood Airbnb Occupancy Rate Trends (2025)
Maximize your bookings by understanding the Brentwood STR occupancy trends. Seasonal demand shifts significantly influence how often properties are booked. Typically, Maysees the highest demand (peak season occupancy), while March experiences the lowest (low season). Effective strategies, like adjusting minimum stays or offering promotions, can boost occupancy during slower periods. Here's how different property tiers perform in Brentwood:
- Best-in-class properties (Top 10%) achieve 69%+ occupancy, indicating high desirability and potentially optimized availability.
- Strong performing properties (Top 25%) maintain 56% or higher occupancy, suggesting good market fit and guest satisfaction.
- Typical properties (Median) have an occupancy rate around 39%.
- Entry-level properties (Bottom 25%) average 22% occupancy, potentially facing higher vacancy.
Average Monthly Occupancy Rate Trend in Brentwood
Average Daily Rate (ADR) Airbnb Trends in Brentwood (2025)
Effective short term rental pricing strategy in Brentwood involves understanding monthly ADR fluctuations. The Average Daily Rate (ADR) for Airbnb in Brentwood typically peaks in March and dips lowest during September. Leveraging Airbnb dynamic pricing tools or strategies based on this seasonality can significantly boost revenue. Here's a look at the typical nightly rates achieved:
- Best-in-class properties (Top 10%) command rates of $685+ per night, often due to premium features or locations.
- Strong performing properties (Top 25%) achieve nightly rates of $335 or more.
- Typical properties (Median) charge around $175 per night.
- Entry-level properties (Bottom 25%) earn around $100 per night.
Average Daily Rate (ADR) Trend by Month in Brentwood
Get Live Brentwood Market Intelligence 👇
Explore Real-time Analytics
Airbnb Seasonality Analysis & Trends in Brentwood (2025)
Peak Season (April, May, October)
- Revenue averages $7,834 per month
- Occupancy rates average 45.5%
- Daily rates average $259
Shoulder Season
- Revenue averages $6,219 per month
- Occupancy maintains around 43.4%
- Daily rates hold near $298
Low Season (January, March, September)
- Revenue drops to average $4,279 per month
- Occupancy decreases to average 33.7%
- Daily rates adjust to average $311
Seasonality Insights for Brentwood
- The Airbnb seasonality in Brentwood shows highly seasonal trends requiring careful strategy. While the sections above show seasonal averages, it's also insightful to look at the extremes:
- During the high season, the absolute peak month showcases Brentwood's highest earning potential, with monthly revenues capable of climbing to $8,783, occupancy reaching a high of 49.8%, and ADRs peaking at $351.
- Conversely, the slowest single month of the year, typically falling within the low season, marks the market's lowest point. In this month, revenue might dip to $3,774, occupancy could drop to 30.0%, and ADRs may adjust down to $252.
- Understanding both the seasonal averages and these monthly peaks and troughs in revenue, occupancy, and ADR is crucial for maximizing your Airbnb profit potential in Brentwood.
Seasonal Strategies for Maximizing Profit
- Peak Season: Maximize revenue through premium pricing and potentially longer minimum stays. Ensure high availability.
- Low Season: Offer competitive pricing, special promotions (e.g., extended stay discounts), and flexible cancellation policies. Target off-season travelers like remote workers or budget-conscious guests.
- Shoulder Seasons: Implement dynamic pricing that balances peak and low rates. Target weekend travelers or specific events. Offer slightly more flexible terms than peak season.
- Regularly analyze your own performance against these Brentwood seasonality benchmarks and adjust your pricing and availability strategy accordingly.
Best Areas for Airbnb Investment in Brentwood (2025)
Exploring the top neighborhoods for short-term rentals in Brentwood? This section highlights key areas, outlining why they are attractive for hosts and guests, along with notable local attractions. Consider these locations based on your target guest profile and investment strategy.
| Neighborhood / Area | Why Host Here? (Target Guests & Appeal) | Key Attractions & Landmarks |
|---|---|---|
| Brentwood Park | A family-friendly neighborhood with spacious homes and access to parks. Ideal for families looking for a quiet suburban experience while still being close to Nashville's attractions. | Brentwood Park, Tower Park, Smith Park, Brentwood Library, Local restaurants and shops |
| Marymont | Known for its executive homes and proximity to Nashville's business districts. A great option for business travelers and professionals seeking upscale accommodations. | Marymont Park, Brentwood Country Club, Golfing options, Nearby shopping centers |
| Edwin Warner Park | Offers a natural escape with vast park lands and scenic trails, attracting nature lovers and families looking for outdoor activities. | Edwin Warner Park trails, Percy Warner Park, Nashville Zoo nearby, Picnic areas, Nature centers |
| South Brentwood | A serene area combining residential charm and easy access to the vibrant Brentwood community and Nashville's attractions. Perfect for short-term rentals. | Local cafes, Shopping areas, Brentwood Library, Close to freeway access |
| Brentwood Hills | A peaceful neighborhood known for its family homes and community feel. It’s convenient for those visiting Nashville yet desiring quiet accommodation. | Brentwood Hills Park, Nearby shopping, Local dining options |
| Strawberry Hill | A quaint community closer to the heart of Brentwood, offering boutique accommodation and easy access to restaurants and shops. Ideal for tourists. | Strawberry Hill Park, Local markets, Proximity to Nashville attractions |
| Moore’s Lane | A bustling road featuring a mix of residential and commercial properties, popular for both business travelers and tourists looking for convenience near amenities. | Corporate offices, Shopping centers, Restaurants and cafes |
| Nolensville Road Corridor | An area offering diverse restaurants and cultural experiences, making it attractive for those who want to explore local offerings away from major tourist spots. | Local eateries, Cultural festivals, Community events |
Understanding Airbnb License Requirements & STR Laws in Brentwood (2025)
While Brentwood, Tennessee, United States currently shows low STR regulations, specific Airbnb license requirements might still exist or change. Always verify the latest short term rental regulations and Airbnb license requirements directly with local government authorities for Brentwood to ensure full compliance before hosting.
(Source: AirROI data, 2025, finding no licensed listings among those analyzed)
Top Performing Airbnb Properties in Brentwood (2025)
Benchmark your potential! Explore examples of top-performing Airbnb properties in Brentwoodbased on Trailing Twelve Month (TTM) revenue. Analyze their characteristics, revenue, occupancy rate, and ADR to understand what drives success in this market.
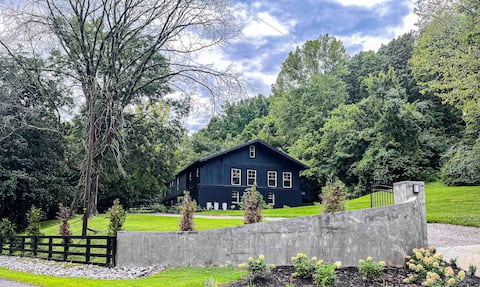
Sunnyside Manor 8 bdrm Barndominium - No pet fee
Entire Place • 8 bedrooms
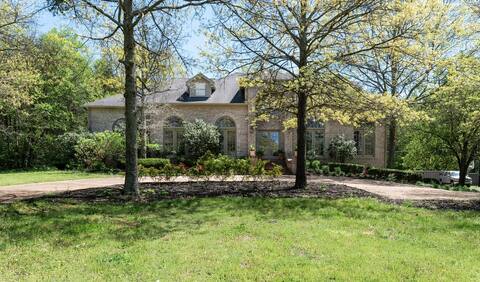
5b Brentwood Home btwn Downtown Nashville/Franklin
Entire Place • 5 bedrooms
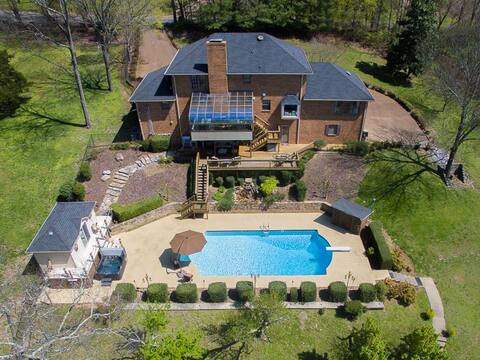
Music City Luxury sleeps 12+ pool, hot tub, tennis
Entire Place • 5 bedrooms
Brentwood Lease 90 day minimum required to book
Entire Place • 4 bedrooms
Beautiful Nashville Area Hillside Home
Entire Place • 4 bedrooms
Historic Forge Seat Brentwood c.1808 Smokehouse
Entire Place • 2 bedrooms
Note: Performance varies based on location, size, amenities, seasonality, and management quality. Data reflects the past 12 months.
Top Performing Airbnb Hosts in Brentwood (2025)
Learn from the best! This table showcases top-performing Airbnb hosts in Brentwood based on the number of properties managed and estimated total revenue over the past year. Analyze their scale and performance metrics.
| Host Name | Properties | Grossing Revenue | Stay Reviews | Avg Rating |
|---|---|---|---|---|
| Wayne | 1 | $324,524 | 32 | 4.91/5.0 |
| Letty James | 1 | $109,771 | 11 | 4.64/5.0 |
| Chris And Denise | 1 | $64,548 | 38 | 4.79/5.0 |
| Kim | 1 | $55,619 | 42 | 4.88/5.0 |
| Steve | 1 | $53,392 | 131 | 4.98/5.0 |
| Ann | 1 | $42,640 | 75 | 4.97/5.0 |
| Beth | 1 | $34,390 | 270 | 4.87/5.0 |
| Doug | 1 | $33,585 | 65 | 4.80/5.0 |
| Amy | 2 | $22,137 | 58 | 4.77/5.0 |
| Matt | 1 | $12,244 | 5 | 5.00/5.0 |
Analyzing the strategies of top hosts, such as their property selection, pricing, and guest communication, can offer valuable lessons for optimizing your own Airbnb operations in Brentwood.
Dive Deeper: Advanced Brentwood STR Market Data (2025)
Ready to unlock more insights? AirROI provides access to advanced metrics and comprehensive Airbnb data for Brentwood. Explore detailed analytics beyond this report to refine your investment strategy, optimize pricing, and maximize your vacation rental profits.
Explore Advanced MetricsBrentwood Short-Term Rental Market Composition (2025): Property & Room Types
Room Type Distribution
Property Type Distribution
Market Composition Insights for Brentwood
- The Brentwood Airbnb market composition is heavily skewed towards Entire Home/Apt listings, which make up 82.4% of the 17 active rentals. This indicates strong guest preference for privacy and space.
- Looking at the property type distribution in Brentwood, House properties are the most common (58.8%), reflecting the local real estate landscape.
- Houses represent a significant 58.8% portion, catering likely to families or larger groups.
- The presence of 5.9% Hotel/Boutique listings indicates integration with traditional hospitality.
Brentwood Airbnb Room Capacity Analysis (2025): Bedroom Distribution
Distribution of Listings by Number of Bedrooms
Room Capacity Insights for Brentwood
- The dominant room capacity in Brentwood is 4 bedrooms listings, making up 29.4% of the market. This suggests a strong demand for properties suitable for families or small groups.
- Together, 4 bedrooms and 2 bedrooms properties represent 52.9% of the active Airbnb listings in Brentwood, indicating a high concentration in these sizes.
- A significant 58.8% of listings offer 3+ bedrooms, catering to larger groups and families seeking more space in Brentwood.
Brentwood Vacation Rental Guest Capacity Trends (2025)
Distribution of Listings by Guest Capacity
Guest Capacity Insights for Brentwood
- The most common guest capacity trend in Brentwood vacation rentals is listings accommodating 8+ guests (41.2%). This suggests the primary traveler segment is likely larger groups.
- Properties designed for 8+ guests and 4 guests dominate the Brentwood STR market, accounting for 58.8% of listings.
- 58.9% of properties accommodate 6+ guests, serving the market segment for larger families or group travel in Brentwood.
- On average, properties in Brentwood are equipped to host 5.5 guests.
Brentwood Airbnb Booking Patterns (2025): Available vs. Booked Days
Available Days Distribution
Booked Days Distribution
Booking Pattern Insights for Brentwood
- The most common availability pattern in Brentwood falls within the 271-366 days range, representing 47.1% of listings. This suggests many properties have significant open periods on their calendars.
- Approximately 88.3% of listings show high availability (181+ days open annually), indicating potential for increased bookings or specific owner usage patterns.
- For booked days, the 91-180 days range is most frequent in Brentwood (41.2%), reflecting common guest stay durations or potential owner blocking patterns.
- A notable 11.8% of properties secure long booking periods (181+ days booked per year), highlighting successful long-term rental strategies or significant owner usage.
Brentwood Airbnb Minimum Stay Requirements Analysis
Distribution of Listings by Minimum Night Requirement
1 Night
4 listings
25% of total
2 Nights
4 listings
25% of total
3 Nights
4 listings
25% of total
7-29 Nights
1 listings
6.3% of total
30+ Nights
3 listings
18.8% of total
Key Insights
- The most prevalent minimum stay requirement in Brentwood is 1 Night, adopted by 25% of listings. This highlights the market's preference for shorter, flexible bookings.
- A significant segment (18.8%) caters to monthly stays (30+ nights) in Brentwood, pointing to opportunities in the extended-stay market.
Recommendations
- Align with the market by considering a 1 Night minimum stay, as 25% of Brentwood hosts use this setting.
- If feasible, allowing 1-night stays, especially midweek or during low season, could capture last-minute bookings, as only 25% currently do.
- Explore offering discounts for stays of 30+ nights to attract the 18.8% of the market seeking extended stays.
- Adjust minimum nights based on seasonality – potentially shorter during low season and longer during peak demand periods in Brentwood.
Brentwood Airbnb Cancellation Policy Trends Analysis (2025)
Flexible
6 listings
40% of total
Moderate
2 listings
13.3% of total
Firm
4 listings
26.7% of total
Strict
3 listings
20% of total
Cancellation Policy Insights for Brentwood
- The prevailing Airbnb cancellation policy trend in Brentwood is Flexible, used by 40% of listings.
- There's a relatively balanced mix between guest-friendly (53.3%) and stricter (46.7%) policies, offering choices for different guest needs.
Recommendations for Hosts
- Consider adopting a Flexible policy to align with the 40% market standard in Brentwood.
- Regularly review your cancellation policy against competitors and market demand shifts in Brentwood.
Brentwood STR Booking Lead Time Analysis (2025)
Average Booking Lead Time by Month
Booking Lead Time Insights for Brentwood
- The overall average booking lead time for vacation rentals in Brentwood is 55 days.
- Guests book furthest in advance for stays during October (average 81 days), likely coinciding with peak travel demand or local events.
- The shortest booking windows occur for stays in February (average 13 days), indicating more last-minute travel plans during this time.
- Seasonally, Fall (68 days avg.) sees the longest lead times, while Winter (49 days avg.) has the shortest, reflecting typical travel planning cycles.
Recommendations for Hosts
- Use the overall average lead time (55 days) as a baseline for your pricing and availability strategy in Brentwood.
- For October stays, consider implementing length-of-stay discounts or slightly higher rates for bookings made less than 81 days out to capitalize on advance planning.
- During February, focus on last-minute booking availability and promotions, as guests book with very short notice (13 days avg.).
- Target marketing efforts for the Fall season well in advance (at least 68 days) to capture early planners.
- Monitor your own booking lead times against these Brentwood averages to identify opportunities for dynamic pricing adjustments.
Popular & Essential Airbnb Amenities in Brentwood (2025)
Amenity Prevalence
Amenity Insights for Brentwood
- Essential amenities in Brentwood that guests expect include: Hot water, Air conditioning, Smoke alarm, Heating, Free parking on premises, TV, Essentials. Lacking these (any) could significantly impact bookings.
- Popular amenities like Wifi, BBQ grill, Bed linens are common but not universal. Offering these can provide a competitive edge.
- Warning: Wifi is not universally provided but is considered essential globally. Ensure reliable Wifi is offered.
Recommendations for Hosts
- Ensure your listing includes all essential amenities for Brentwood: Hot water, Air conditioning, Smoke alarm, Heating, Free parking on premises, TV, Essentials.
- Consider adding popular differentiators like Wifi or BBQ grill to increase appeal.
- Highlight unique or less common amenities you offer (e.g., hot tub, dedicated workspace, EV charger) in your listing description and photos.
- Regularly check competitor amenities in Brentwood to stay competitive.
Brentwood Airbnb Guest Demographics & Profile Analysis (2025)
Guest Profile Summary for Brentwood
- The typical guest profile for Airbnb in Brentwood consists of primarily domestic travelers (97%), often arriving from nearby Atlanta, typically belonging to the Post-2000s (Gen Z/Alpha) group (50%), primarily speaking English or Spanish.
- Domestic travelers account for 97.4% of guests.
- Key international markets include United States (97.4%) and Canada (0.9%).
- Top languages spoken are English (93.3%) followed by Spanish (6.7%).
- A significant demographic segment is the Post-2000s (Gen Z/Alpha) group, representing 50% of guests.
Recommendations for Hosts
- Target domestic marketing efforts towards travelers from Atlanta and Chicago.
- Tailor amenities and listing descriptions to appeal to the dominant Post-2000s (Gen Z/Alpha) demographic (e.g., highlight fast WiFi, smart home features, local guides).
- Highlight unique local experiences or amenities relevant to the primary guest profile.
- Consider seasonal promotions aligned with peak travel times for key origin markets.
Nearby Short-Term Rental Market Comparison
How does the Brentwood Airbnb market stack up against its neighbors? Compare key performance metrics like average monthly revenue, ADR, and occupancy rates in surrounding areas to understand the broader regional STR landscape.
| Market | Active Properties | Monthly Revenue | Daily Rate | Avg. Occupancy |
|---|---|---|---|---|
| Bremen | 23 | $4,643 | $555.48 | 30% |
| Arley | 43 | $4,358 | $448.18 | 40% |
| Cedar Bluff | 33 | $4,317 | $458.84 | 39% |
| Pleasant View | 12 | $4,019 | $271.32 | 42% |
| Berry Hill | 132 | $3,977 | $291.14 | 47% |
| Mt. Juliet | 51 | $3,672 | $302.68 | 46% |
| Nashville-Davidson | 7,508 | $3,597 | $287.82 | 45% |
| Estill Springs | 22 | $3,590 | $375.46 | 39% |
| Lookout Mountain | 75 | $3,588 | $295.52 | 49% |
| Crane Hill | 98 | $3,479 | $414.20 | 35% |