Del Rio Airbnb Market Analysis 2025: Short Term Rental Data & Vacation Rental Statistics in Tennessee, United States
Is Airbnb profitable in Del Rio in 2025? Explore comprehensive Airbnb analytics for Del Rio, Tennessee, United States to uncover income potential. This 2025 STR market report for Del Rio, based on AirROI data from July 2024 to June 2025, reveals key trends in the niche market of 18 active listings.
Whether you're considering an Airbnb investment in Del Rio, optimizing your existing vacation rental, or exploring rental arbitrage opportunities, understanding the Del Rio Airbnb data is crucial. Leveraging the low regulation environment is key to maximizing your short term rental income potential. Let's dive into the specifics.
Key Del Rio Airbnb Performance Metrics Overview
Monthly Airbnb Revenue Variations & Income Potential in Del Rio (2025)
Understanding the monthly revenue variations for Airbnb listings in Del Rio is key to maximizing your short term rental income potential. Seasonality significantly impacts earnings. Our analysis, based on data from the past 12 months, shows that the peak revenue month for STRs in Del Rio is typically July, while February often presents the lowest earnings, highlighting opportunities for strategic pricing adjustments during shoulder and low seasons. Explore the typical Airbnb income in Del Rio across different performance tiers:
- Best-in-class properties (Top 10%) achieve $3,533+ monthly, often utilizing dynamic pricing and superior guest experiences.
- Strong performing properties (Top 25%) earn $1,738 or more, indicating effective management and desirable locations/amenities.
- Typical properties (Median) generate around $843 per month, representing the average market performance.
- Entry-level properties (Bottom 25%) see earnings around $398, often with potential for optimization.
Average Monthly Airbnb Earnings Trend in Del Rio
Del Rio Airbnb Occupancy Rate Trends (2025)
Maximize your bookings by understanding the Del Rio STR occupancy trends. Seasonal demand shifts significantly influence how often properties are booked. Typically, Maysees the highest demand (peak season occupancy), while December experiences the lowest (low season). Effective strategies, like adjusting minimum stays or offering promotions, can boost occupancy during slower periods. Here's how different property tiers perform in Del Rio:
- Best-in-class properties (Top 10%) achieve 80%+ occupancy, indicating high desirability and potentially optimized availability.
- Strong performing properties (Top 25%) maintain 55% or higher occupancy, suggesting good market fit and guest satisfaction.
- Typical properties (Median) have an occupancy rate around 30%.
- Entry-level properties (Bottom 25%) average 13% occupancy, potentially facing higher vacancy.
Average Monthly Occupancy Rate Trend in Del Rio
Average Daily Rate (ADR) Airbnb Trends in Del Rio (2025)
Effective short term rental pricing strategy in Del Rio involves understanding monthly ADR fluctuations. The Average Daily Rate (ADR) for Airbnb in Del Rio typically peaks in June and dips lowest during September. Leveraging Airbnb dynamic pricing tools or strategies based on this seasonality can significantly boost revenue. Here's a look at the typical nightly rates achieved:
- Best-in-class properties (Top 10%) command rates of $216+ per night, often due to premium features or locations.
- Strong performing properties (Top 25%) achieve nightly rates of $137 or more.
- Typical properties (Median) charge around $111 per night.
- Entry-level properties (Bottom 25%) earn around $73 per night.
Average Daily Rate (ADR) Trend by Month in Del Rio
Get Live Del Rio Market Intelligence 👇

Explore Real-time Analytics
Airbnb Seasonality Analysis & Trends in Del Rio (2025)
Peak Season (July, June, August)
- Revenue averages $1,733 per month
- Occupancy rates average 43.7%
- Daily rates average $117
Shoulder Season
- Revenue averages $1,318 per month
- Occupancy maintains around 35.2%
- Daily rates hold near $115
Low Season (January, February, March)
- Revenue drops to average $931 per month
- Occupancy decreases to average 33.4%
- Daily rates adjust to average $114
Seasonality Insights for Del Rio
- The Airbnb seasonality in Del Rio shows highly seasonal trends requiring careful strategy. While the sections above show seasonal averages, it's also insightful to look at the extremes:
- During the high season, the absolute peak month showcases Del Rio's highest earning potential, with monthly revenues capable of climbing to $1,881, occupancy reaching a high of 54.0%, and ADRs peaking at $128.
- Conversely, the slowest single month of the year, typically falling within the low season, marks the market's lowest point. In this month, revenue might dip to $723, occupancy could drop to 28.0%, and ADRs may adjust down to $109.
- Understanding both the seasonal averages and these monthly peaks and troughs in revenue, occupancy, and ADR is crucial for maximizing your Airbnb profit potential in Del Rio.
Seasonal Strategies for Maximizing Profit
- Peak Season: Maximize revenue through premium pricing and potentially longer minimum stays. Ensure high availability.
- Low Season: Offer competitive pricing, special promotions (e.g., extended stay discounts), and flexible cancellation policies. Target off-season travelers like remote workers or budget-conscious guests.
- Shoulder Seasons: Implement dynamic pricing that balances peak and low rates. Target weekend travelers or specific events. Offer slightly more flexible terms than peak season.
- Regularly analyze your own performance against these Del Rio seasonality benchmarks and adjust your pricing and availability strategy accordingly.
Best Areas for Airbnb Investment in Del Rio (2025)
Exploring the top neighborhoods for short-term rentals in Del Rio? This section highlights key areas, outlining why they are attractive for hosts and guests, along with notable local attractions. Consider these locations based on your target guest profile and investment strategy.
| Neighborhood / Area | Why Host Here? (Target Guests & Appeal) | Key Attractions & Landmarks |
|---|---|---|
| Downtown Del Rio | The heart of Del Rio with a variety of local shops, restaurants, and attractions. Ideal for travelers looking for convenience and a taste of local culture. | Whitehead Memorial Museum, San Felipe Springs, Del Rio Civic Center, Parks and Publix, Golf courses |
| Lake Amistad | A popular destination for water sports and outdoor enthusiasts, offering beautiful views and plenty of recreational activities. Great for families and adventure seekers. | Amistad National Recreation Area, Boating and fishing, Water sports activities, Camping and picnicking, Nature trails |
| Del Rio International Airport | A strategic location for those traveling through or needing to stay near the airport. Caters to business travelers and airport staff. | Airport lounges, Car rental services, Proximity to city center |
| Civic Center Area | Close to venues for events and activities, making it a prime spot for visitors attending shows, sports, or fairs. | Civic Center events, Local fairs, Concerts and shows, Sporting events |
| Cienega Ranch | A serene community near Del Rio, popular for its spacious ranch-style homes and proximity to nature. Perfect for those looking for a more relaxed stay away from city noise. | Nature walks, Ranch-style living, Quiet neighborhood |
| Historic Downtown | Rich in history and charm, this area draws visitors interested in Del Rio's past and unique architecture. A picturesque area to explore. | Historic buildings, Local art galleries, Quaint cafes, Walking tours |
| Shopping District | Home to various local and national retail shops. Ideal for tourists interested in shopping and dining experiences in one location. | Local boutiques, Grocery stores, Shopping malls, Dining options |
| Eagle Pass | Just across the border in Texas, Eagle Pass provides access to additional shopping, dining, and cultural experiences for travelers in Del Rio. | Shopping and dining, Fort Duncan Park, Cultural events, Casinos |
Understanding Airbnb License Requirements & STR Laws in Del Rio (2025)
While Del Rio, Tennessee, United States currently shows low STR regulations, specific Airbnb license requirements might still exist or change. Always verify the latest short term rental regulations and Airbnb license requirements directly with local government authorities for Del Rio to ensure full compliance before hosting.
(Source: AirROI data, 2025, finding no licensed listings among those analyzed)
Top Performing Airbnb Properties in Del Rio (2025)
Benchmark your potential! Explore examples of top-performing Airbnb properties in Del Riobased on Trailing Twelve Month (TTM) revenue. Analyze their characteristics, revenue, occupancy rate, and ADR to understand what drives success in this market.
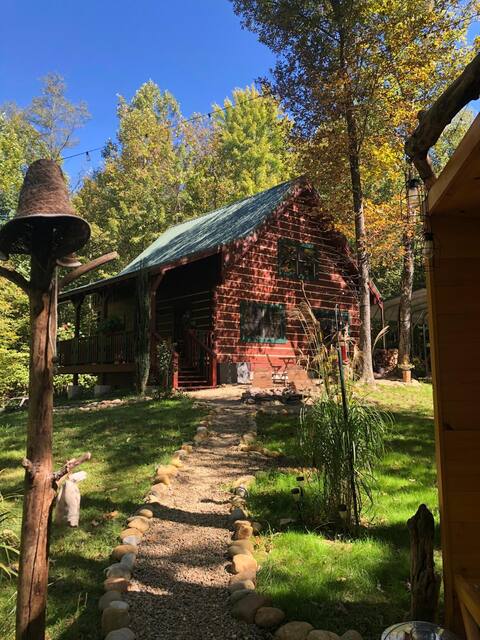
Log cabin with Wellness feature
Entire Place • 2 bedrooms

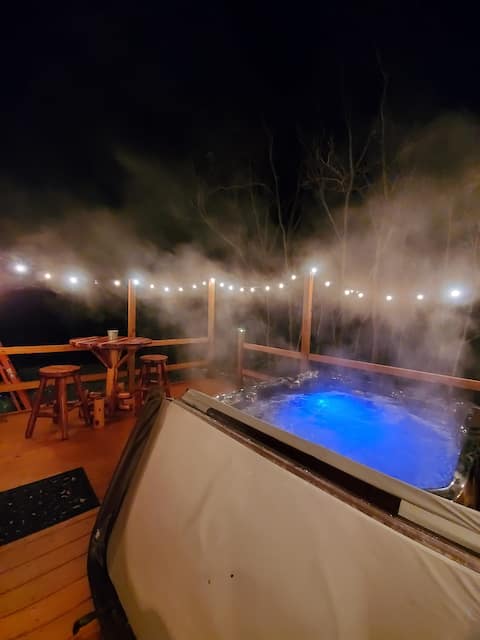
RiverZen Retreat in the Smokies
Entire Place • 2 bedrooms
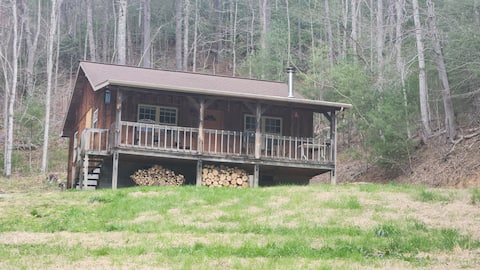
Bare Run: A Secluded Cabin in the Mountains
Entire Place • 2 bedrooms
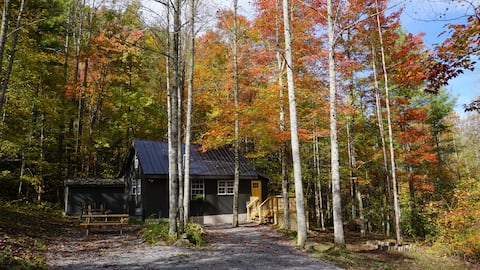
Beautiful Cabin with detached Studio in the woods!
Entire Place • 1 bedroom
The Banty Rooster Cabin
Entire Place • 1 bedroom
Chateau Sharrott Beautiful 2 bedroom cabin w/Loft
Entire Place • 3 bedrooms
Note: Performance varies based on location, size, amenities, seasonality, and management quality. Data reflects the past 12 months.
Top Performing Airbnb Hosts in Del Rio (2025)
Learn from the best! This table showcases top-performing Airbnb hosts in Del Rio based on the number of properties managed and estimated total revenue over the past year. Analyze their scale and performance metrics.
| Host Name | Properties | Grossing Revenue | Stay Reviews | Avg Rating |
|---|---|---|---|---|
| Peggy | 1 | $42,045 | 27 | 4.96/5.0 |
| David | 2 | $20,166 | 45 | 4.93/5.0 |
| Host #27777957 | 1 | $17,461 | 5 | 5.00/5.0 |
| Eric | 1 | $15,995 | 39 | 4.90/5.0 |
| Maria | 1 | $15,759 | 221 | 4.97/5.0 |
| Steffanie | 2 | $13,209 | 146 | 4.81/5.0 |
| Sherry | 4 | $13,194 | 49 | 4.82/5.0 |
| Tammy | 1 | $11,555 | 66 | 4.97/5.0 |
| Ryan And Marisela | 1 | $11,383 | 48 | 4.83/5.0 |
| Host #129050421 | 1 | $10,430 | 6 | 5.00/5.0 |
Analyzing the strategies of top hosts, such as their property selection, pricing, and guest communication, can offer valuable lessons for optimizing your own Airbnb operations in Del Rio.
Dive Deeper: Advanced Del Rio STR Market Data (2025)
Ready to unlock more insights? AirROI provides access to advanced metrics and comprehensive Airbnb data for Del Rio. Explore detailed analytics beyond this report to refine your investment strategy, optimize pricing, and maximize your vacation rental profits.
Explore Advanced MetricsDel Rio Short-Term Rental Market Composition (2025): Property & Room Types
Room Type Distribution
Property Type Distribution
Market Composition Insights for Del Rio
- The Del Rio Airbnb market composition is heavily skewed towards Entire Home/Apt listings, which make up 100% of the 18 active rentals. This indicates strong guest preference for privacy and space.
- Looking at the property type distribution in Del Rio, Outdoor/Unique properties are the most common (83.3%), reflecting the local real estate landscape.
Del Rio Airbnb Room Capacity Analysis (2025): Bedroom Distribution
Distribution of Listings by Number of Bedrooms
Room Capacity Insights for Del Rio
- The dominant room capacity in Del Rio is 1 bedroom listings, making up 55.6% of the market. This suggests a strong demand for properties suitable for couples or solo travelers.
- Together, 1 bedroom and 2 bedrooms properties represent 88.9% of the active Airbnb listings in Del Rio, indicating a high concentration in these sizes.
- With over half the market (55.6%) consisting of studios or 1-bedroom units, Del Rio is particularly well-suited for individuals or couples.
- Listings with 3+ bedrooms (5.6%) represent a smaller niche, potentially indicating an underserved market for larger group accommodations in Del Rio.
Del Rio Vacation Rental Guest Capacity Trends (2025)
Distribution of Listings by Guest Capacity
Guest Capacity Insights for Del Rio
- The most common guest capacity trend in Del Rio vacation rentals is listings accommodating 4 guests (44.4%). This suggests the primary traveler segment is likely small families or groups.
- Properties designed for 4 guests and 3 guests dominate the Del Rio STR market, accounting for 77.7% of listings.
- 11.2% of properties accommodate 6+ guests, serving the market segment for larger families or group travel in Del Rio.
- On average, properties in Del Rio are equipped to host 3.8 guests.
Del Rio Airbnb Booking Patterns (2025): Available vs. Booked Days
Available Days Distribution
Booked Days Distribution
Booking Pattern Insights for Del Rio
- The most common availability pattern in Del Rio falls within the 271-366 days range, representing 50% of listings. This suggests many properties have significant open periods on their calendars.
- Approximately 94.4% of listings show high availability (181+ days open annually), indicating potential for increased bookings or specific owner usage patterns.
- For booked days, the 91-180 days range is most frequent in Del Rio (44.4%), reflecting common guest stay durations or potential owner blocking patterns.
- A notable 5.6% of properties secure long booking periods (181+ days booked per year), highlighting successful long-term rental strategies or significant owner usage.
Del Rio Airbnb Minimum Stay Requirements Analysis
Distribution of Listings by Minimum Night Requirement
1 Night
8 listings
50% of total
2 Nights
8 listings
50% of total
Key Insights
- The most prevalent minimum stay requirement in Del Rio is 1 Night, adopted by 50% of listings. This highlights the market's preference for shorter, flexible bookings.
- A strong majority (100.0%) of the Del Rio Airbnb data shows acceptance of very short stays (1-2 nights), indicating a dynamic, high-turnover market.
Recommendations
- Align with the market by considering a 1 Night minimum stay, as 50% of Del Rio hosts use this setting.
- Adjust minimum nights based on seasonality – potentially shorter during low season and longer during peak demand periods in Del Rio.
Del Rio Airbnb Cancellation Policy Trends Analysis (2025)
Flexible
2 listings
12.5% of total
Moderate
5 listings
31.3% of total
Firm
4 listings
25% of total
Strict
5 listings
31.3% of total
Cancellation Policy Insights for Del Rio
- The prevailing Airbnb cancellation policy trend in Del Rio is Moderate, used by 31.3% of listings.
- A majority (56.3%) of hosts in Del Rio utilize Firm or Strict policies, indicating a market where hosts prioritize booking security.
Recommendations for Hosts
- Consider adopting a Moderate policy to align with the 31.3% market standard in Del Rio.
- With 31.3% using Strict terms, this is a viable option in Del Rio, particularly for high-value properties or during peak demand periods.
- Regularly review your cancellation policy against competitors and market demand shifts in Del Rio.
Del Rio STR Booking Lead Time Analysis (2025)
Average Booking Lead Time by Month
Booking Lead Time Insights for Del Rio
- The overall average booking lead time for vacation rentals in Del Rio is 27 days.
- Guests book furthest in advance for stays during December (average 62 days), likely coinciding with peak travel demand or local events.
- The shortest booking windows occur for stays in February (average 9 days), indicating more last-minute travel plans during this time.
- Seasonally, Winter (38 days avg.) sees the longest lead times, while Summer (21 days avg.) has the shortest, reflecting typical travel planning cycles.
Recommendations for Hosts
- Use the overall average lead time (27 days) as a baseline for your pricing and availability strategy in Del Rio.
- For December stays, consider implementing length-of-stay discounts or slightly higher rates for bookings made less than 62 days out to capitalize on advance planning.
- During February, focus on last-minute booking availability and promotions, as guests book with very short notice (9 days avg.).
- Target marketing efforts for the Winter season well in advance (at least 38 days) to capture early planners.
- Monitor your own booking lead times against these Del Rio averages to identify opportunities for dynamic pricing adjustments.
Popular & Essential Airbnb Amenities in Del Rio (2025)
Amenity data is currently unavailable for Del Rio.
Del Rio Airbnb Guest Demographics & Profile Analysis (2025)
Guest Profile Summary for Del Rio
- The typical guest profile for Airbnb in Del Rio consists of primarily domestic travelers (99%), often arriving from nearby Chicago, typically belonging to the Post-2000s (Gen Z/Alpha) group (50%), primarily speaking English or Spanish.
- Domestic travelers account for 98.9% of guests.
- Key international markets include United States (98.9%) and Estonia (1.1%).
- Top languages spoken are English (67.1%) followed by Spanish (16.5%).
- A significant demographic segment is the Post-2000s (Gen Z/Alpha) group, representing 50% of guests.
Recommendations for Hosts
- Target domestic marketing efforts towards travelers from Chicago and Newport.
- Tailor amenities and listing descriptions to appeal to the dominant Post-2000s (Gen Z/Alpha) demographic (e.g., highlight fast WiFi, smart home features, local guides).
- Highlight unique local experiences or amenities relevant to the primary guest profile.
- Consider seasonal promotions aligned with peak travel times for key origin markets.
Nearby Short-Term Rental Market Comparison
How does the Del Rio Airbnb market stack up against its neighbors? Compare key performance metrics like average monthly revenue, ADR, and occupancy rates in surrounding areas to understand the broader regional STR landscape.
| Market | Active Properties | Monthly Revenue | Daily Rate | Avg. Occupancy |
|---|---|---|---|---|
| Sevier County | 67 | $6,255 | $588.35 | 43% |
| Union Mills | 15 | $5,107 | $450.39 | 43% |
| Gilmer County | 20 | $5,059 | $378.00 | 43% |
| Sevierville | 5,696 | $4,407 | $340.55 | 47% |
| Fannin County | 38 | $4,397 | $388.85 | 41% |
| Six Mile | 57 | $4,071 | $430.71 | 42% |
| Gatlinburg | 3,268 | $3,981 | $327.66 | 45% |
| West Union | 31 | $3,921 | $505.83 | 35% |
| Wears Valley | 218 | $3,781 | $310.09 | 43% |
| Pigeon Forge | 2,788 | $3,764 | $309.40 | 44% |