Savannah Airbnb Market Analysis 2026: Short Term Rental Data & Vacation Rental Statistics in Tennessee, United States
Is Airbnb profitable in Savannah in 2026? Explore comprehensive Airbnb analytics for Savannah, Tennessee, United States to uncover income potential. This 2026 STR market report for Savannah, based on AirROI data from February 2025 to January 2026, reveals key trends in the niche market of 35 active listings.
Whether you're considering an Airbnb investment in Savannah, optimizing your existing vacation rental, or exploring rental arbitrage opportunities, understanding the Savannah Airbnb data is crucial. Leveraging the low regulation environment is key to maximizing your short term rental income potential. Let's dive into the specifics.
Key Savannah Airbnb Performance Metrics Overview
Monthly Airbnb Revenue Variations & Income Potential in Savannah (2026)
Understanding the monthly revenue variations for Airbnb listings in Savannah is key to maximizing your short term rental income potential. Seasonality significantly impacts earnings. Our analysis, based on data from the past 12 months, shows that the peak revenue month for STRs in Savannah is typically July, while February often presents the lowest earnings, highlighting opportunities for strategic pricing adjustments during shoulder and low seasons. Explore the typical Airbnb income in Savannah across different performance tiers:
- Best-in-class properties (Top 10%) achieve $5,322+ monthly, often utilizing dynamic pricing and superior guest experiences.
- Strong performing properties (Top 25%) earn $2,718 or more, indicating effective management and desirable locations/amenities.
- Typical properties (Median) generate around $1,604 per month, representing the average market performance.
- Entry-level properties (Bottom 25%) see earnings around $924, often with potential for optimization.
Average Monthly Airbnb Earnings Trend in Savannah
Savannah Airbnb Occupancy Rate Trends (2026)
Maximize your bookings by understanding the Savannah STR occupancy trends. Seasonal demand shifts significantly influence how often properties are booked. Typically, Marchsees the highest demand (peak season occupancy), while August experiences the lowest (low season). Effective strategies, like adjusting minimum stays or offering promotions, can boost occupancy during slower periods. Here's how different property tiers perform in Savannah:
- Best-in-class properties (Top 10%) achieve 77%+ occupancy, indicating high desirability and potentially optimized availability.
- Strong performing properties (Top 25%) maintain 57% or higher occupancy, suggesting good market fit and guest satisfaction.
- Typical properties (Median) have an occupancy rate around 34%.
- Entry-level properties (Bottom 25%) average 16% occupancy, potentially facing higher vacancy.
Average Monthly Occupancy Rate Trend in Savannah
Average Daily Rate (ADR) Airbnb Trends in Savannah (2026)
Effective short term rental pricing strategy in Savannah involves understanding monthly ADR fluctuations. The Average Daily Rate (ADR) for Airbnb in Savannah typically peaks in July and dips lowest during January. Leveraging Airbnb dynamic pricing tools or strategies based on this seasonality can significantly boost revenue. Here's a look at the typical nightly rates achieved:
- Best-in-class properties (Top 10%) command rates of $463+ per night, often due to premium features or locations.
- Strong performing properties (Top 25%) achieve nightly rates of $317 or more.
- Typical properties (Median) charge around $172 per night.
- Entry-level properties (Bottom 25%) earn around $124 per night.
Average Daily Rate (ADR) Trend by Month in Savannah
Get Live Savannah Market Intelligence 👇

Explore Real-time Analytics
Airbnb Seasonality Analysis & Trends in Savannah (2026)
Peak Season (July, August, June)
- Revenue averages $3,037 per month
- Occupancy rates average 38.4%
- Daily rates average $243
Shoulder Season
- Revenue averages $2,377 per month
- Occupancy maintains around 39.6%
- Daily rates hold near $228
Low Season (February, March, April)
- Revenue drops to average $1,832 per month
- Occupancy decreases to average 39.7%
- Daily rates adjust to average $223
Seasonality Insights for Savannah
- The Airbnb seasonality in Savannah shows highly seasonal trends requiring careful strategy. While the sections above show seasonal averages, it's also insightful to look at the extremes:
- During the high season, the absolute peak month showcases Savannah's highest earning potential, with monthly revenues capable of climbing to $3,199, occupancy reaching a high of 46.1%, and ADRs peaking at $247.
- Conversely, the slowest single month of the year, typically falling within the low season, marks the market's lowest point. In this month, revenue might dip to $1,394, occupancy could drop to 33.9%, and ADRs may adjust down to $219.
- Understanding both the seasonal averages and these monthly peaks and troughs in revenue, occupancy, and ADR is crucial for maximizing your Airbnb profit potential in Savannah.
Seasonal Strategies for Maximizing Profit
- Peak Season: Maximize revenue through premium pricing and potentially longer minimum stays. Ensure high availability.
- Low Season: Offer competitive pricing, special promotions (e.g., extended stay discounts), and flexible cancellation policies. Target off-season travelers like remote workers or budget-conscious guests.
- Shoulder Seasons: Implement dynamic pricing that balances peak and low rates. Target weekend travelers or specific events. Offer slightly more flexible terms than peak season.
- Regularly analyze your own performance against these Savannah seasonality benchmarks and adjust your pricing and availability strategy accordingly.
Best Areas for Airbnb Investment in Savannah (2026)
Exploring the top neighborhoods for short-term rentals in Savannah? This section highlights key areas, outlining why they are attractive for hosts and guests, along with notable local attractions. Consider these locations based on your target guest profile and investment strategy.
| Neighborhood / Area | Why Host Here? (Target Guests & Appeal) | Key Attractions & Landmarks |
|---|---|---|
| Historic District | The Historic District is known for its well-preserved architecture, cobblestone streets, and rich history. It attracts tourists interested in culture, history, and Southern charm, making it a prime area for Airbnb investment. | Forsyth Park, Savannah College of Art and Design, Savannah Riverfront, Cathedral of St. John the Baptist, Juliette Gordon Low Birthplace, Oglethorpe Square |
| River Street | River Street is a bustling waterfront area filled with shops, restaurants, and bars. Its picturesque setting along the Savannah River makes it a popular destination for tourists looking for nightlife and scenic views. | River Street Shops, Savannah Riverwalk, Cotton Exchange, The Waving Girl, Fountain at Emmet Park, Savannah Belles Ferry |
| Tybee Island | Just a short drive from Savannah, Tybee Island offers beautiful beaches and a laid-back atmosphere. It's a favored spot for both tourists and locals seeking sun and sand, making it attractive for Airbnb hosts. | Tybee Island Beach, Fort Pulaski National Monument, Tybee Island Light Station, Dolphin Tours, North Beach, South Beach |
| Davenport House Museum area | This area features beautiful historic homes and quiet streets, offering a charming residential experience for visitors who want to immerse themselves in Savannah's history and tranquility. | Davenport House Museum, Reynolds Square, Green-Meldrim House, Savannah History Museum, Harrison Square, Columbia Square |
| Starland District | An up-and-coming area known for its artsy vibe, local cafes, and boutique shops. It attracts young travelers and offers a unique experience away from the main tourist spots. | Starland Dairy, The Sentient Bean, Lulu's Chocolate, Oglethorpe Mall, Savannah Arts Academy, Art Rise Savannah |
| Southside Savannah | This region is more suburban and offers various amenities. It's popular with families and business travelers looking for a quieter stay while still being near Savannah's attractions. | Savannah Mall, Skidaway Island State Park, Laroche Park, Lake Mayer, Abercorn Common, Southside Fitness |
| Thunderbolt | A small, charming enclave near Savannah that attracts tourists with its peaceful streets and proximity to the waterfront. It is becoming popular for visitors looking for a quiet getaway. | Thunderbolt Marina, River Drive, The Olde Pink House, Bonaventure Cemetery, Wilmington Island, Isle of Hope |
| Whitemarsh Island | A residential area with close proximity to beaches and outdoor activities. It's an excellent option for families and nature lovers looking for longer stays. | Whitemarsh Island Dog Park, Fort McAllister, Skidaway Island State Park, Savannah National Wildlife Refuge, Tybee Island Beach, Cattle Wash |
Understanding Airbnb License Requirements & STR Laws in Savannah (2026)
While Savannah, Tennessee, United States currently shows low STR regulations, specific Airbnb license requirements might still exist or change. Always verify the latest short term rental regulations and Airbnb license requirements directly with local government authorities for Savannah to ensure full compliance before hosting.
(Source: AirROI data, 2026, finding no licensed listings among those analyzed)
Top Performing Airbnb Properties in Savannah (2026)
Benchmark your potential! Explore examples of top-performing Airbnb properties in Savannahbased on Trailing Twelve Month (TTM) revenue. Analyze their characteristics, revenue, occupancy rate, and ADR to understand what drives success in this market.
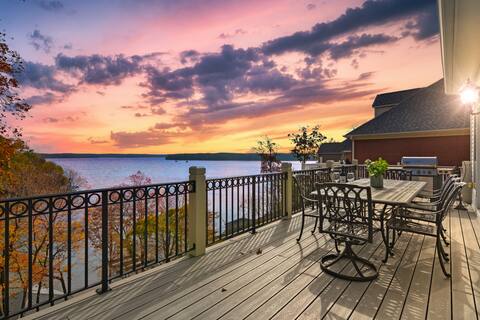
Luxury Pickwick Lake home with Million Dollar View
Entire Place • 5 bedrooms

New! Coral Ridge on Indian Creek-A Couples Getaway
Entire Place ��• 1 bedroom
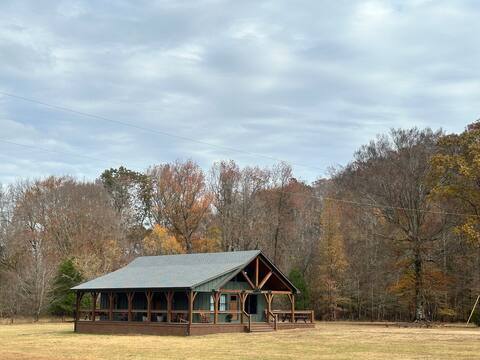
Hollow Hideaway
Entire Place • 3 bedrooms

Cottage on the bluffs at Pickwick Lake
Entire Place • 3 bedrooms
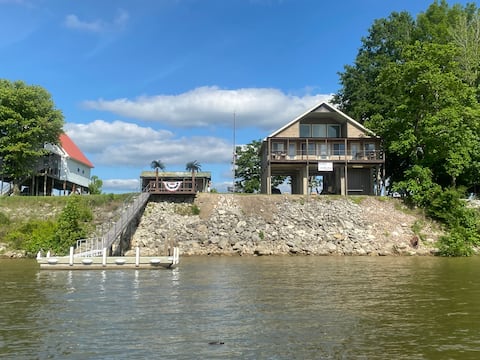
"Hooked On The River Dock 172" Tennessee River
Entire Place • 3 bedrooms

King Bed 3BR—Clean, Peaceful, Pickwick & Boats
Entire Place • 3 bedrooms
Note: Performance varies based on location, size, amenities, seasonality, and management quality. Data reflects the past 12 months.
Top Performing Airbnb Hosts in Savannah (2026)
Learn from the best! This table showcases top-performing Airbnb hosts in Savannah based on the number of properties managed and estimated total revenue over the past year. Analyze their scale and performance metrics.
| Host Name | Properties | Grossing Revenue | Stay Reviews | Avg Rating |
|---|---|---|---|---|
| Chris | 1 | $109,732 | 29 | 5.00/5.0 |
| Charles | 1 | $81,367 | 114 | 4.99/5.0 |
| Chrissie | 2 | $61,230 | 60 | 5.00/5.0 |
| Prospector | 3 | $45,121 | 400 | 4.77/5.0 |
| Kimberly Lynne | 2 | $41,342 | 97 | 5.00/5.0 |
| Kim | 1 | $39,182 | 17 | 5.00/5.0 |
| Andrea | 1 | $30,844 | 170 | 4.95/5.0 |
| Taslima | 1 | $28,016 | 4 | 5.00/5.0 |
| Sean | 1 | $27,454 | 48 | 4.92/5.0 |
| Sarah | 1 | $22,657 | 47 | 4.83/5.0 |
Analyzing the strategies of top hosts, such as their property selection, pricing, and guest communication, can offer valuable lessons for optimizing your own Airbnb operations in Savannah.
Dive Deeper: Advanced Savannah STR Market Data (2026)
Ready to unlock more insights? AirROI provides access to advanced metrics and comprehensive Airbnb data for Savannah. Explore detailed analytics beyond this report to refine your investment strategy, optimize pricing, and maximize your vacation rental profits.
Explore Advanced MetricsSavannah Short-Term Rental Market Composition (2026): Property & Room Types
Room Type Distribution
Property Type Distribution
Market Composition Insights for Savannah
- The Savannah Airbnb market composition is heavily skewed towards Entire Home/Apt listings, which make up 91.4% of the 35 active rentals. This indicates strong guest preference for privacy and space.
- Looking at the property type distribution in Savannah, House properties are the most common (62.9%), reflecting the local real estate landscape.
- Houses represent a significant 62.9% portion, catering likely to families or larger groups.
Savannah Airbnb Room Capacity Analysis (2026): Bedroom Distribution
Distribution of Listings by Number of Bedrooms
Room Capacity Insights for Savannah
- The dominant room capacity in Savannah is 3 bedrooms listings, making up 34.3% of the market. This suggests a strong demand for properties suitable for families or small groups.
- Together, 3 bedrooms and 2 bedrooms properties represent 62.9% of the active Airbnb listings in Savannah, indicating a high concentration in these sizes.
- A significant 48.6% of listings offer 3+ bedrooms, catering to larger groups and families seeking more space in Savannah.
Savannah Vacation Rental Guest Capacity Trends (2026)
Distribution of Listings by Guest Capacity
Guest Capacity Insights for Savannah
- The most common guest capacity trend in Savannah vacation rentals is listings accommodating 8+ guests (34.3%). This suggests the primary traveler segment is likely larger groups.
- Properties designed for 8+ guests and 6 guests dominate the Savannah STR market, accounting for 62.9% of listings.
- 65.8% of properties accommodate 6+ guests, serving the market segment for larger families or group travel in Savannah.
- On average, properties in Savannah are equipped to host 5.6 guests.
Savannah Airbnb Booking Patterns (2026): Available vs. Booked Days
Available Days Distribution
Booked Days Distribution
Booking Pattern Insights for Savannah
- The most common availability pattern in Savannah falls within the 271-366 days range, representing 54.3% of listings. This suggests many properties have significant open periods on their calendars.
- Approximately 85.7% of listings show high availability (181+ days open annually), indicating potential for increased bookings or specific owner usage patterns.
- For booked days, the 91-180 days range is most frequent in Savannah (31.4%), reflecting common guest stay durations or potential owner blocking patterns.
- A notable 17.1% of properties secure long booking periods (181+ days booked per year), highlighting successful long-term rental strategies or significant owner usage.
Savannah Airbnb Minimum Stay Requirements Analysis
Distribution of Listings by Minimum Night Requirement
1 Night
13 listings
37.1% of total
2 Nights
12 listings
34.3% of total
4-6 Nights
1 listings
2.9% of total
30+ Nights
9 listings
25.7% of total
Key Insights
- The most prevalent minimum stay requirement in Savannah is 1 Night, adopted by 37.1% of listings. This highlights the market's preference for shorter, flexible bookings.
- A strong majority (71.4%) of the Savannah Airbnb data shows acceptance of very short stays (1-2 nights), indicating a dynamic, high-turnover market.
- A significant segment (25.7%) caters to monthly stays (30+ nights) in Savannah, pointing to opportunities in the extended-stay market.
Recommendations
- Align with the market by considering a 1 Night minimum stay, as 37.1% of Savannah hosts use this setting.
- Explore offering discounts for stays of 30+ nights to attract the 25.7% of the market seeking extended stays.
- Adjust minimum nights based on seasonality – potentially shorter during low season and longer during peak demand periods in Savannah.
Savannah Airbnb Cancellation Policy Trends Analysis (2026)
Flexible
12 listings
34.3% of total
Moderate
9 listings
25.7% of total
Firm
11 listings
31.4% of total
Strict
3 listings
8.6% of total
Cancellation Policy Insights for Savannah
- The prevailing Airbnb cancellation policy trend in Savannah is Flexible, used by 34.3% of listings.
- There's a relatively balanced mix between guest-friendly (60.0%) and stricter (40.0%) policies, offering choices for different guest needs.
- Strict cancellation policies are quite rare (8.6%), potentially making listings with this policy less competitive unless justified by high demand or property type.
Recommendations for Hosts
- Consider adopting a Flexible policy to align with the 34.3% market standard in Savannah.
- Using a Strict policy might deter some guests, as only 8.6% of listings use it. Evaluate if potential revenue protection outweighs possible lower booking rates.
- Regularly review your cancellation policy against competitors and market demand shifts in Savannah.
Savannah STR Booking Lead Time Analysis (2026)
Average Booking Lead Time by Month
Booking Lead Time Insights for Savannah
- The overall average booking lead time for vacation rentals in Savannah is 41 days.
- Guests book furthest in advance for stays during April (average 61 days), likely coinciding with peak travel demand or local events.
- The shortest booking windows occur for stays in February (average 17 days), indicating more last-minute travel plans during this time.
- Seasonally, Summer (49 days avg.) sees the longest lead times, while Winter (22 days avg.) has the shortest, reflecting typical travel planning cycles.
Recommendations for Hosts
- Use the overall average lead time (41 days) as a baseline for your pricing and availability strategy in Savannah.
- For April stays, consider implementing length-of-stay discounts or slightly higher rates for bookings made less than 61 days out to capitalize on advance planning.
- Target marketing efforts for the Summer season well in advance (at least 49 days) to capture early planners.
- Monitor your own booking lead times against these Savannah averages to identify opportunities for dynamic pricing adjustments.
Popular & Essential Airbnb Amenities in Savannah (2026)
Amenity Prevalence
Amenity Insights for Savannah
- Essential amenities in Savannah that guests expect include: Free parking on premises, Air conditioning, TV. Lacking these (any) could significantly impact bookings.
- Popular amenities like Heating, Smoke alarm, Microwave are common but not universal. Offering these can provide a competitive edge.
- Warning: Wifi is not universally provided but is considered essential globally. Ensure reliable Wifi is offered.
Recommendations for Hosts
- Ensure your listing includes all essential amenities for Savannah: Free parking on premises, Air conditioning, TV.
- Prioritize adding missing essentials: TV.
- Consider adding popular differentiators like Heating or Smoke alarm to increase appeal.
- Highlight unique or less common amenities you offer (e.g., hot tub, dedicated workspace, EV charger) in your listing description and photos.
- Regularly check competitor amenities in Savannah to stay competitive.
Savannah Airbnb Guest Demographics & Profile Analysis (2026)
Guest Profile Summary for Savannah
- The typical guest profile for Airbnb in Savannah consists of primarily domestic travelers (100%), often arriving from nearby South Bend, typically belonging to the Post-2000s (Gen Z/Alpha) group (50%), primarily speaking English or Spanish.
- Domestic travelers account for 99.5% of guests.
- Key international markets include United States (99.5%) and Canada (0.5%).
- Top languages spoken are English (95.7%) followed by Spanish (2.9%).
- A significant demographic segment is the Post-2000s (Gen Z/Alpha) group, representing 50% of guests.
Recommendations for Hosts
- Target domestic marketing efforts towards travelers from South Bend and Savannah.
- Tailor amenities and listing descriptions to appeal to the dominant Post-2000s (Gen Z/Alpha) demographic (e.g., highlight fast WiFi, smart home features, local guides).
- Highlight unique local experiences or amenities relevant to the primary guest profile.
- Consider seasonal promotions aligned with peak travel times for key origin markets.
Nearby Short-Term Rental Market Comparison
How does the Savannah Airbnb market stack up against its neighbors? Compare key performance metrics like average monthly revenue, ADR, and occupancy rates in surrounding areas to understand the broader regional STR landscape.
| Market | Active Properties | Monthly Revenue | Daily Rate | Avg. Occupancy |
|---|---|---|---|---|
| Bremen | 23 | $4,914 | $603.74 | 33% |
| Arley | 47 | $4,531 | $525.71 | 35% |
| Pegram | 19 | $3,535 | $254.12 | 45% |
| Crane Hill | 98 | $3,479 | $452.36 | 35% |
| Pleasant View | 16 | $3,414 | $338.69 | 38% |
| Taylor | 12 | $3,235 | $657.63 | 29% |
| Houston | 13 | $3,234 | $556.49 | 34% |
| Kingston Springs | 32 | $3,230 | $258.02 | 44% |
| Cadiz | 127 | $2,863 | $319.44 | 34% |
| Oxford | 967 | $2,713 | $564.99 | 27% |