Emporia Airbnb Market Analysis 2026: Short Term Rental Data & Vacation Rental Statistics in Virginia, United States
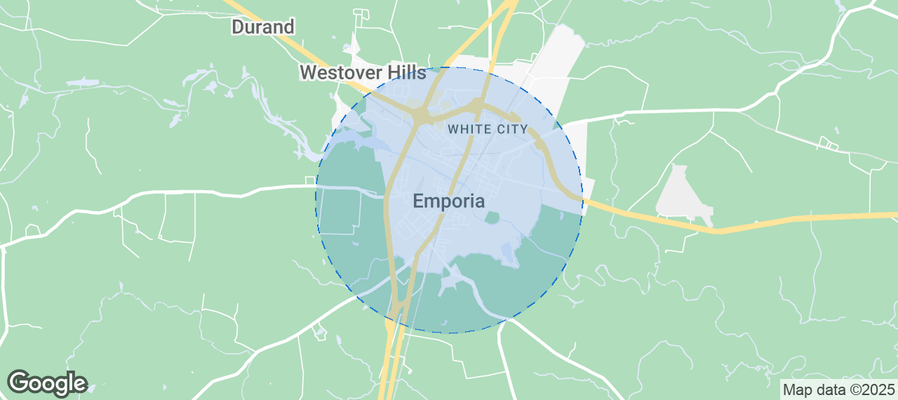
Is Airbnb profitable in Emporia in 2026? Explore comprehensive Airbnb analytics for Emporia, Virginia, United States to uncover income potential. This 2026 STR market report for Emporia, based on AirROI data from July 2024 to June 2025, reveals key trends in the niche market of 18 active listings.
Whether you're considering an Airbnb investment in Emporia, optimizing your existing vacation rental, or exploring rental arbitrage opportunities, understanding the Emporia Airbnb data is crucial. Leveraging the low regulation environment is key to maximizing your short term rental income potential. Let's dive into the specifics.
Key Emporia Airbnb Performance Metrics Overview
Monthly Airbnb Revenue Variations & Income Potential in Emporia (2026)
Understanding the monthly revenue variations for Airbnb listings in Emporia is key to maximizing your short term rental income potential. Seasonality significantly impacts earnings. Our analysis, based on data from the past 12 months, shows that the peak revenue month for STRs in Emporia is typically October, while January often presents the lowest earnings, highlighting opportunities for strategic pricing adjustments during shoulder and low seasons. Explore the typical Airbnb income in Emporia across different performance tiers:
- Best-in-class properties (Top 10%) achieve $4,143+ monthly, often utilizing dynamic pricing and superior guest experiences.
- Strong performing properties (Top 25%) earn $2,759 or more, indicating effective management and desirable locations/amenities.
- Typical properties (Median) generate around $1,811 per month, representing the average market performance.
- Entry-level properties (Bottom 25%) see earnings around $1,012, often with potential for optimization.
Average Monthly Airbnb Earnings Trend in Emporia
Emporia Airbnb Occupancy Rate Trends (2026)
Maximize your bookings by understanding the Emporia STR occupancy trends. Seasonal demand shifts significantly influence how often properties are booked. Typically, Octobersees the highest demand (peak season occupancy), while January experiences the lowest (low season). Effective strategies, like adjusting minimum stays or offering promotions, can boost occupancy during slower periods. Here's how different property tiers perform in Emporia:
- Best-in-class properties (Top 10%) achieve 72%+ occupancy, indicating high desirability and potentially optimized availability.
- Strong performing properties (Top 25%) maintain 57% or higher occupancy, suggesting good market fit and guest satisfaction.
- Typical properties (Median) have an occupancy rate around 37%.
- Entry-level properties (Bottom 25%) average 25% occupancy, potentially facing higher vacancy.
Average Monthly Occupancy Rate Trend in Emporia
Average Daily Rate (ADR) Airbnb Trends in Emporia (2026)
Effective short term rental pricing strategy in Emporia involves understanding monthly ADR fluctuations. The Average Daily Rate (ADR) for Airbnb in Emporia typically peaks in June and dips lowest during July. Leveraging Airbnb dynamic pricing tools or strategies based on this seasonality can significantly boost revenue. Here's a look at the typical nightly rates achieved:
- Best-in-class properties (Top 10%) command rates of $198+ per night, often due to premium features or locations.
- Strong performing properties (Top 25%) achieve nightly rates of $140 or more.
- Typical properties (Median) charge around $60 per night.
- Entry-level properties (Bottom 25%) earn around $46 per night.
Average Daily Rate (ADR) Trend by Month in Emporia
Get Live Emporia Market Intelligence 👇
Explore Real-time Analytics
Airbnb Seasonality Analysis & Trends in Emporia (2025)
Peak Season (October, December, November)
- Revenue averages $2,531 per month
- Occupancy rates average 52.6%
- Daily rates average $83
Shoulder Season
- Revenue averages $1,888 per month
- Occupancy maintains around 39.9%
- Daily rates hold near $93
Low Season (January, March, June)
- Revenue drops to average $1,553 per month
- Occupancy decreases to average 31.0%
- Daily rates adjust to average $101
Seasonality Insights for Emporia
- The Airbnb seasonality in Emporia shows moderate seasonality with distinct peak and low periods. While the sections above show seasonal averages, it's also insightful to look at the extremes:
- During the high season, the absolute peak month showcases Emporia's highest earning potential, with monthly revenues capable of climbing to $2,649, occupancy reaching a high of 54.3%, and ADRs peaking at $114.
- Conversely, the slowest single month of the year, typically falling within the low season, marks the market's lowest point. In this month, revenue might dip to $1,448, occupancy could drop to 24.9%, and ADRs may adjust down to $82.
- Understanding both the seasonal averages and these monthly peaks and troughs in revenue, occupancy, and ADR is crucial for maximizing your Airbnb profit potential in Emporia.
Seasonal Strategies for Maximizing Profit
- Peak Season: Maximize revenue through premium pricing and potentially longer minimum stays. Ensure high availability.
- Low Season: Offer competitive pricing, special promotions (e.g., extended stay discounts), and flexible cancellation policies. Target off-season travelers like remote workers or budget-conscious guests.
- Shoulder Seasons: Implement dynamic pricing that balances peak and low rates. Target weekend travelers or specific events. Offer slightly more flexible terms than peak season.
- Regularly analyze your own performance against these Emporia seasonality benchmarks and adjust your pricing and availability strategy accordingly.
Best Areas for Airbnb Investment in Emporia (2026)
Exploring the top neighborhoods for short-term rentals in Emporia? This section highlights key areas, outlining why they are attractive for hosts and guests, along with notable local attractions. Consider these locations based on your target guest profile and investment strategy.
| Neighborhood / Area | Why Host Here? (Target Guests & Appeal) | Key Attractions & Landmarks |
|---|---|---|
| Downtown Emporia | The heart of the city with shops, restaurants, and cultural attractions. Ideal for visitors wanting to explore local amenities and the vibrant community life. | Emporia City Park, Historic Downtown Emporia, Local eateries and cafes, Emporia Arts Council, Virginia's Southside Heritage |
| Lake Gaston | A popular recreation area with water sports and outdoor activities. Perfect for families and groups seeking relaxation and adventure by the water. | Lake Gaston, Fishing and boating, Hiking trails around the lake, Public beaches, Watson's Mill |
| Greensville County | An area rich in history and nature, attracting guests interested in exploring the natural beauty and historical landmarks of Virginia. | Greensville County Historical Society, Lake Gaston State Park, Scenic hiking trails, Cultural heritage sites |
| Nearby Roanoke Rapids | A neighboring town that offers additional dining and shopping options, as well as access to community events and activities. | Roanoke Rapids Theatre, Lakeside Park, Roanoke River trails, Shopping at local malls, Local dining options |
| Emporia Community Events | Hosting events and festivals throughout the year makes Emporia a lively destination for guests looking to immerse themselves in local culture. | Virginia Crappie Festival, Emporia Fall Festival, Music and arts events, Local farmers' markets, Community gatherings |
| Back Roads Virginia | Ideal for guests seeking a rural experience and exploring the beautiful countryside surrounding Emporia, including hidden gems and local farms. | Wine and cider tours, Farmers' markets, Scenic byways, Outdoor picnicking spots, Biking and hiking trails |
| Historic Homes District | Showcasing beautiful historic architecture, this area attracts visitors interested in history and photography. | Historic homes and buildings tour, Local museums, Photography opportunities, Arts and craft shops, Community history events |
| Local Restaurants and Cafes | Emporia is known for its heartfelt local dining experiences that showcase Southern cuisine, attracting food lovers. | Local barbecue joints, Southern comfort food, Family-run diners, Cafes with local treats, Food festivals |
Understanding Airbnb License Requirements & STR Laws in Emporia (2026)
While Emporia, Virginia, United States currently shows low STR regulations, specific Airbnb license requirements might still exist or change. Always verify the latest short term rental regulations and Airbnb license requirements directly with local government authorities for Emporia to ensure full compliance before hosting.
(Source: AirROI data, 2026, finding no licensed listings among those analyzed)
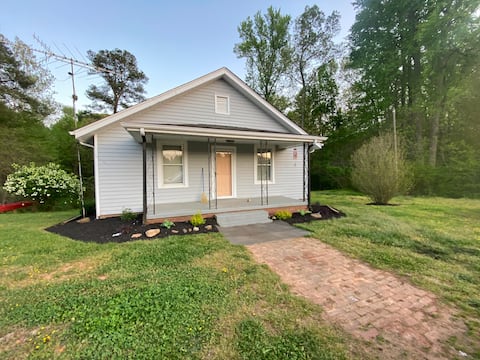
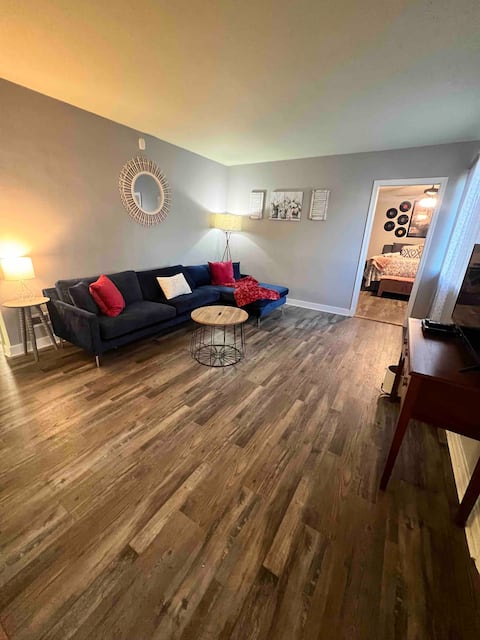
Top Performing Airbnb Properties in Emporia (2026)
Benchmark your potential! Explore examples of top-performing Airbnb properties in Emporiabased on Trailing Twelve Month (TTM) revenue. Analyze their characteristics, revenue, occupancy rate, and ADR to understand what drives success in this market.

Fortsville Plantation
Entire Place • 5 bedrooms
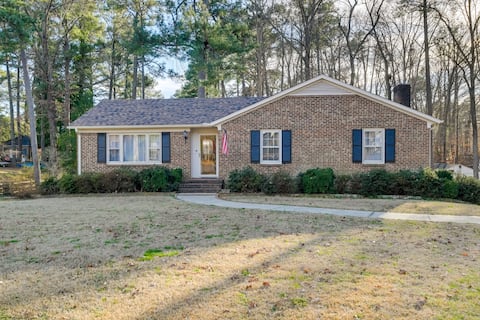
Charming Emporia Home w/ Deck & Patio!
Entire Place • 3 bedrooms

Farm Stay, Country Getaway, Retreat
Entire Place • 3 bedrooms
Little Creekside Cottage
Entire Place • 3 bedrooms
Slagle’s Vintage Inn
Entire Place • 3 bedrooms
Tucker's Country Inn
Entire Place • 5 bedrooms
Note: Performance varies based on location, size, amenities, seasonality, and management quality. Data reflects the past 12 months.
Top Performing Airbnb Hosts in Emporia (2026)
Learn from the best! This table showcases top-performing Airbnb hosts in Emporia based on the number of properties managed and estimated total revenue over the past year. Analyze their scale and performance metrics.
| Host Name | Properties | Grossing Revenue | Stay Reviews | Avg Rating |
|---|---|---|---|---|
| Jessica And David | 3 | $95,372 | 915 | 4.78/5.0 |
| Evolve | 1 | $33,142 | 8 | 4.50/5.0 |
| Marsha | 1 | $32,320 | 157 | 5.00/5.0 |
| Carlissa | 2 | $22,723 | 524 | 4.83/5.0 |
| Garvey | 1 | $15,611 | 61 | 4.75/5.0 |
| Theresita | 7 | $3,556 | 49 | 4.87/5.0 |
| Daisy Merlin | 3 | $2,429 | 27 | 5.00/5.0 |
Analyzing the strategies of top hosts, such as their property selection, pricing, and guest communication, can offer valuable lessons for optimizing your own Airbnb operations in Emporia.
Dive Deeper: Advanced Emporia STR Market Data (2026)
Ready to unlock more insights? AirROI provides access to advanced metrics and comprehensive Airbnb data for Emporia. Explore detailed analytics beyond this report to refine your investment strategy, optimize pricing, and maximize your vacation rental profits.
Explore Advanced MetricsEmporia Short-Term Rental Market Composition (2026): Property & Room Types
Room Type Distribution
Property Type Distribution
Market Composition Insights for Emporia
- The Emporia Airbnb market composition is heavily skewed towards Private Room listings, which make up 55.6% of the 18 active rentals. This indicates strong guest preference for privacy and space.
- Looking at the property type distribution in Emporia, House properties are the most common (83.3%), reflecting the local real estate landscape.
- Houses represent a significant 83.3% portion, catering likely to families or larger groups.
Emporia Airbnb Room Capacity Analysis (2026): Bedroom Distribution
Distribution of Listings by Number of Bedrooms
Room Capacity Insights for Emporia
- The dominant room capacity in Emporia is 3 bedrooms listings, making up 22.2% of the market. This suggests a strong demand for properties suitable for families or small groups.
- Together, 3 bedrooms and 5+ bedrooms properties represent 33.3% of the active Airbnb listings in Emporia, indicating a high concentration in these sizes.
- A significant 33.3% of listings offer 3+ bedrooms, catering to larger groups and families seeking more space in Emporia.
Emporia Vacation Rental Guest Capacity Trends (2026)
Distribution of Listings by Guest Capacity
Guest Capacity Insights for Emporia
- The most common guest capacity trend in Emporia vacation rentals is listings accommodating 6 guests (16.7%). This suggests the primary traveler segment is likely larger groups.
- Properties designed for 6 guests and 8+ guests dominate the Emporia STR market, accounting for 33.4% of listings.
- 39.0% of properties accommodate 6+ guests, serving the market segment for larger families or group travel in Emporia.
- On average, properties in Emporia are equipped to host 2.9 guests.
Emporia Airbnb Booking Patterns (2026): Available vs. Booked Days
Available Days Distribution
Booked Days Distribution
Booking Pattern Insights for Emporia
- The most common availability pattern in Emporia falls within the 271-366 days range, representing 61.1% of listings. This suggests many properties have significant open periods on their calendars.
- Approximately 83.3% of listings show high availability (181+ days open annually), indicating potential for increased bookings or specific owner usage patterns.
- For booked days, the 1-30 days range is most frequent in Emporia (50%), reflecting common guest stay durations or potential owner blocking patterns.
- A notable 16.7% of properties secure long booking periods (181+ days booked per year), highlighting successful long-term rental strategies or significant owner usage.
Emporia Airbnb Minimum Stay Requirements Analysis
Distribution of Listings by Minimum Night Requirement
1 Night
9 listings
56.3% of total
2 Nights
6 listings
37.5% of total
30+ Nights
1 listings
6.3% of total
Key Insights
- The most prevalent minimum stay requirement in Emporia is 1 Night, adopted by 56.3% of listings. This highlights the market's preference for shorter, flexible bookings.
- A strong majority (93.8%) of the Emporia Airbnb data shows acceptance of very short stays (1-2 nights), indicating a dynamic, high-turnover market.
Recommendations
- Align with the market by considering a 1 Night minimum stay, as 56.3% of Emporia hosts use this setting.
- Explore offering discounts for stays of 30+ nights to attract the 6.3% of the market seeking extended stays.
- Adjust minimum nights based on seasonality – potentially shorter during low season and longer during peak demand periods in Emporia.
Emporia Airbnb Cancellation Policy Trends Analysis (2026)
Flexible
6 listings
33.3% of total
Moderate
5 listings
27.8% of total
Firm
4 listings
22.2% of total
Strict
3 listings
16.7% of total
Cancellation Policy Insights for Emporia
- The prevailing Airbnb cancellation policy trend in Emporia is Flexible, used by 33.3% of listings.
- There's a relatively balanced mix between guest-friendly (61.1%) and stricter (38.9%) policies, offering choices for different guest needs.
Recommendations for Hosts
- Consider adopting a Flexible policy to align with the 33.3% market standard in Emporia.
- Regularly review your cancellation policy against competitors and market demand shifts in Emporia.
Emporia STR Booking Lead Time Analysis (2026)
Average Booking Lead Time by Month
Booking Lead Time Insights for Emporia
- The overall average booking lead time for vacation rentals in Emporia is 26 days.
- Guests book furthest in advance for stays during November (average 56 days), likely coinciding with peak travel demand or local events.
- The shortest booking windows occur for stays in March (average 15 days), indicating more last-minute travel plans during this time.
- Seasonally, Fall (46 days avg.) sees the longest lead times, while Spring (27 days avg.) has the shortest, reflecting typical travel planning cycles.
Recommendations for Hosts
- Use the overall average lead time (26 days) as a baseline for your pricing and availability strategy in Emporia.
- For November stays, consider implementing length-of-stay discounts or slightly higher rates for bookings made less than 56 days out to capitalize on advance planning.
- Target marketing efforts for the Fall season well in advance (at least 46 days) to capture early planners.
- Monitor your own booking lead times against these Emporia averages to identify opportunities for dynamic pricing adjustments.
Popular & Essential Airbnb Amenities in Emporia (2026)
Amenity data is currently unavailable for Emporia.
Emporia Airbnb Guest Demographics & Profile Analysis (2026)
Guest Profile Summary for Emporia
- The typical guest profile for Airbnb in Emporia consists of primarily domestic travelers (94%), often arriving from nearby Pittsburgh, typically belonging to the Post-2000s (Gen Z/Alpha) group (50%), primarily speaking English or French.
- Domestic travelers account for 94.2% of guests.
- Key international markets include United States (94.2%) and Canada (2.4%).
- Top languages spoken are English (75.3%) followed by French (10.5%).
- A significant demographic segment is the Post-2000s (Gen Z/Alpha) group, representing 50% of guests.
Recommendations for Hosts
- Target domestic marketing efforts towards travelers from Pittsburgh and New York.
- Tailor amenities and listing descriptions to appeal to the dominant Post-2000s (Gen Z/Alpha) demographic (e.g., highlight fast WiFi, smart home features, local guides).
- Highlight unique local experiences or amenities relevant to the primary guest profile.
- Consider seasonal promotions aligned with peak travel times for key origin markets.
Nearby Short-Term Rental Market Comparison
How does the Emporia Airbnb market stack up against its neighbors? Compare key performance metrics like average monthly revenue, ADR, and occupancy rates in surrounding areas to understand the broader regional STR landscape.
| Market | Active Properties | Monthly Revenue | Daily Rate | Avg. Occupancy |
|---|---|---|---|---|
| Littleton | 108 | $4,433 | $442.80 | 42% |
| Afton | 136 | $4,376 | $354.92 | 41% |
| Nellysford | 70 | $4,350 | $396.28 | 37% |
| Cobbs Creek | 10 | $4,197 | $318.64 | 48% |
| Wintergreen Resort | 56 | $4,031 | $369.91 | 42% |
| White Stone | 40 | $4,002 | $379.97 | 43% |
| Lanexa | 13 | $3,891 | $293.44 | 50% |
| Macon | 37 | $3,839 | $494.51 | 34% |
| Weems | 12 | $3,675 | $311.17 | 49% |
| Henrico | 69 | $3,640 | $420.30 | 39% |