Free Union Airbnb Market Analysis 2025: Short Term Rental Data & Vacation Rental Statistics in Virginia, United States
Is Airbnb profitable in Free Union in 2025? Explore comprehensive Airbnb analytics for Free Union, Virginia, United States to uncover income potential. This 2025 STR market report for Free Union, based on AirROI data from May 2024 to April 2025, reveals key trends in the niche market of 17 active listings.
Whether you're considering an Airbnb investment in Free Union, optimizing your existing vacation rental, or exploring rental arbitrage opportunities, understanding the Free Union Airbnb data is crucial. Leveraging the low regulation environment is key to maximizing your short term rental income potential. Let's dive into the specifics.
Key Free Union Airbnb Performance Metrics Overview
Monthly Airbnb Revenue Variations & Income Potential in Free Union (2025)
Understanding the monthly revenue variations for Airbnb listings in Free Union is key to maximizing your short term rental income potential. Seasonality significantly impacts earnings. Our analysis, based on data from the past 12 months, shows that the peak revenue month for STRs in Free Union is typically May, while February often presents the lowest earnings, highlighting opportunities for strategic pricing adjustments during shoulder and low seasons. Explore the typical Airbnb income in Free Union across different performance tiers:
- Best-in-class properties (Top 10%) achieve $9,048+ monthly, often utilizing dynamic pricing and superior guest experiences.
- Strong performing properties (Top 25%) earn $4,891 or more, indicating effective management and desirable locations/amenities.
- Typical properties (Median) generate around $2,796 per month, representing the average market performance.
- Entry-level properties (Bottom 25%) see earnings around $1,455, often with potential for optimization.
Average Monthly Airbnb Earnings Trend in Free Union
Free Union Airbnb Occupancy Rate Trends (2025)
Maximize your bookings by understanding the Free Union STR occupancy trends. Seasonal demand shifts significantly influence how often properties are booked. Typically, Octobersees the highest demand (peak season occupancy), while March experiences the lowest (low season). Effective strategies, like adjusting minimum stays or offering promotions, can boost occupancy during slower periods. Here's how different property tiers perform in Free Union:
- Best-in-class properties (Top 10%) achieve 85%+ occupancy, indicating high desirability and potentially optimized availability.
- Strong performing properties (Top 25%) maintain 71% or higher occupancy, suggesting good market fit and guest satisfaction.
- Typical properties (Median) have an occupancy rate around 47%.
- Entry-level properties (Bottom 25%) average 32% occupancy, potentially facing higher vacancy.
Average Monthly Occupancy Rate Trend in Free Union
Average Daily Rate (ADR) Airbnb Trends in Free Union (2025)
Effective short term rental pricing strategy in Free Union involves understanding monthly ADR fluctuations. The Average Daily Rate (ADR) for Airbnb in Free Union typically peaks in December and dips lowest during September. Leveraging Airbnb dynamic pricing tools or strategies based on this seasonality can significantly boost revenue. Here's a look at the typical nightly rates achieved:
- Best-in-class properties (Top 10%) command rates of $629+ per night, often due to premium features or locations.
- Strong performing properties (Top 25%) achieve nightly rates of $305 or more.
- Typical properties (Median) charge around $209 per night.
- Entry-level properties (Bottom 25%) earn around $145 per night.
Average Daily Rate (ADR) Trend by Month in Free Union
Get Live Free Union Market Intelligence 👇

Explore Real-time Analytics
Airbnb Seasonality Analysis & Trends in Free Union (2025)
Peak Season (May, October, July)
- Revenue averages $5,624 per month
- Occupancy rates average 61.4%
- Daily rates average $292
Shoulder Season
- Revenue averages $4,491 per month
- Occupancy maintains around 49.8%
- Daily rates hold near $295
Low Season (February, April, August)
- Revenue drops to average $3,584 per month
- Occupancy decreases to average 44.4%
- Daily rates adjust to average $289
Seasonality Insights for Free Union
- The Airbnb seasonality in Free Union shows moderate seasonality with distinct peak and low periods. While the sections above show seasonal averages, it's also insightful to look at the extremes:
- During the high season, the absolute peak month showcases Free Union's highest earning potential, with monthly revenues capable of climbing to $5,963, occupancy reaching a high of 65.6%, and ADRs peaking at $325.
- Conversely, the slowest single month of the year, typically falling within the low season, marks the market's lowest point. In this month, revenue might dip to $3,285, occupancy could drop to 42.2%, and ADRs may adjust down to $281.
- Understanding both the seasonal averages and these monthly peaks and troughs in revenue, occupancy, and ADR is crucial for maximizing your Airbnb profit potential in Free Union.
Seasonal Strategies for Maximizing Profit
- Peak Season: Maximize revenue through premium pricing and potentially longer minimum stays. Ensure high availability.
- Low Season: Offer competitive pricing, special promotions (e.g., extended stay discounts), and flexible cancellation policies. Target off-season travelers like remote workers or budget-conscious guests.
- Shoulder Seasons: Implement dynamic pricing that balances peak and low rates. Target weekend travelers or specific events. Offer slightly more flexible terms than peak season.
- Regularly analyze your own performance against these Free Union seasonality benchmarks and adjust your pricing and availability strategy accordingly.
Best Areas for Airbnb Investment in Free Union (2025)
Exploring the top neighborhoods for short-term rentals in Free Union? This section highlights key areas, outlining why they are attractive for hosts and guests, along with notable local attractions. Consider these locations based on your target guest profile and investment strategy.
| Neighborhood / Area | Why Host Here? (Target Guests & Appeal) | Key Attractions & Landmarks |
|---|---|---|
| Free Union | A charming rural community near Charlottesville, Free Union offers a peaceful escape with scenic views and historic charm. It's ideal for guests looking for a quiet getaway close to nature and local wineries. | Monticello, Shenandoah National Park, Virginia Wine Country, Historic Garden Week, Local farms and markets, Charlottesville Downtown Mall |
| Charlottesville | Just a short drive from Free Union, Charlottesville is known for its vibrant arts scene, historical significance, and top-notch dining. It's a hotspot for tourists visiting the University of Virginia and various outdoor activities. | University of Virginia, Monticello, Downtown Mall, Virginia Discovery Museum, Miller Center, Kluge-Ruhe Aboriginal Art Collection |
| Lake Monticello | A beautiful lakeside community offering opportunities for relaxation and outdoor activities, attracting families and recreational enthusiasts looking for a fun and adventurous stay. | Lake Monticello, Golf courses, Horseback riding, Hiking trails, Community events, Local fishing spots |
| Richmond | As the capital of Virginia, Richmond has a rich history and vibrant cultural scene. It draws visitors for its historical landmarks, art, and music festivals, making it a great investment location. | Virginia State Capitol, Maymont Park, The Museum of Fine Arts, Richmond National Battlefield Park, Shocked State Historic Park, Canal Walk |
| Williamsburg | Known for its living-history museum, Colonial Williamsburg attracts many tourists interested in American history and culture. It's perfect for those seeking a historical and educational experience. | Colonial Williamsburg, Busch Gardens, Jamestown Settlement, Yorktown Victory Center, Merchants Square, Historic Jamestowne |
| Lexington | A small, historic town with a beautiful landscape, Lexington is popular for its outdoor activities and historical sites, attracting nature lovers and history buffs alike. | Washington and Lee University, Virginia Military Institute, Natural Bridge, Historic Downtown, Rockbridge Vineyard, Hiking trails |
| Staunton | Famous for its vibrant arts community and historic architecture, Staunton offers unique experiences for guests interested in culture and the arts. | American Shakespeare Center, Woodrow Wilson Presidential Library, Blackfriars Playhouse, Gypsy Hill Park, Traditional music festivals, Local art galleries |
| Skyline Drive | A scenic drive through Shenandoah National Park, Skyline Drive attracts nature lovers seeking breathtaking views and hiking opportunities. Ideal for those wanting a retreat into nature. | Shenandoah National Park, Hiking trails, Wildlife viewing, Skyline Drive overlooks, Camping areas, Scenic viewpoints |
Understanding Airbnb License Requirements & STR Laws in Free Union (2025)
While Free Union, Virginia, United States currently shows low STR regulations, specific Airbnb license requirements might still exist or change. Always verify the latest short term rental regulations and Airbnb license requirements directly with local government authorities for Free Union to ensure full compliance before hosting.
(Source: AirROI data, 2025, finding no licensed listings among those analyzed)
Top Performing Airbnb Properties in Free Union (2025)
Benchmark your potential! Explore examples of top-performing Airbnb properties in Free Unionbased on Trailing Twelve Month (TTM) revenue. Analyze their characteristics, revenue, occupancy rate, and ADR to understand what drives success in this market.
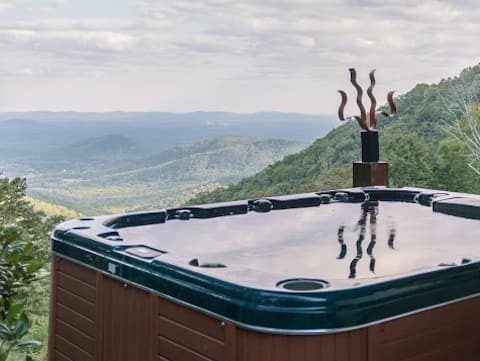
Stunning Mountain-Top Views w Hot-Tub & 6 Bedrooms
Entire Place • 6 bedrooms

Shenandoah Stargazer with Sauna
Entire Place • 3 bedrooms

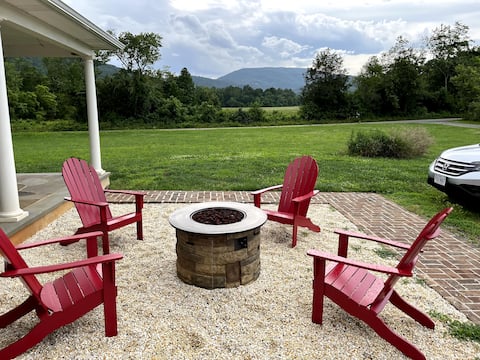
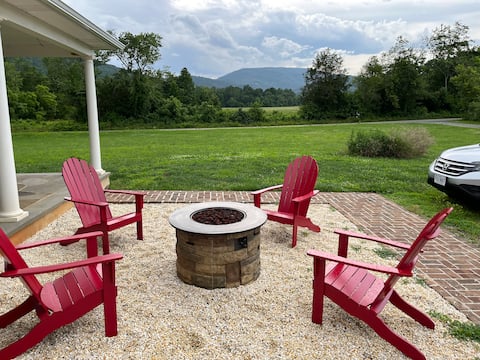
Top of the Mountain Cabin + Views Firepit Games
Entire Place • 3 bedrooms
Riverfront Country Home with Blue Mountain Views
Entire Place • 4 bedrooms

Studio Apartment on Working Farm
Entire Place • 1 bedroom
Riverfront Country Home with Blue Mountain Views
Entire Place • 4 bedrooms
Note: Performance varies based on location, size, amenities, seasonality, and management quality. Data reflects the past 12 months.
Top Performing Airbnb Hosts in Free Union (2025)
Learn from the best! This table showcases top-performing Airbnb hosts in Free Union based on the number of properties managed and estimated total revenue over the past year. Analyze their scale and performance metrics.
| Host Name | Properties | Grossing Revenue | Stay Reviews | Avg Rating |
|---|---|---|---|---|
| Erin | 1 | $246,243 | 29 | 5.00/5.0 |
| Culin | 1 | $90,498 | 115 | 5.00/5.0 |
| Andrew | 1 | $85,416 | 153 | 4.95/5.0 |
| Sarah And Larry | 2 | $69,982 | 73 | 4.79/5.0 |
| Molly | 1 | $33,772 | 53 | 5.00/5.0 |
| Jonathan And Sibylle | 1 | $30,796 | 313 | 4.95/5.0 |
| Tessy | 1 | $23,118 | 9 | 5.00/5.0 |
| Stephen And Kate | 1 | $22,077 | 36 | 5.00/5.0 |
| Mary Scott And Mark | 1 | $22,041 | 188 | 4.89/5.0 |
| Gail | 1 | $17,997 | 343 | 4.98/5.0 |
Analyzing the strategies of top hosts, such as their property selection, pricing, and guest communication, can offer valuable lessons for optimizing your own Airbnb operations in Free Union.
Dive Deeper: Advanced Free Union STR Market Data (2025)
Ready to unlock more insights? AirROI provides access to advanced metrics and comprehensive Airbnb data for Free Union. Explore detailed analytics beyond this report to refine your investment strategy, optimize pricing, and maximize your vacation rental profits.
Explore Advanced MetricsFree Union Short-Term Rental Market Composition (2025): Property & Room Types
Room Type Distribution
Property Type Distribution
Market Composition Insights for Free Union
- The Free Union Airbnb market composition is heavily skewed towards Entire Home/Apt listings, which make up 100% of the 17 active rentals. This indicates strong guest preference for privacy and space.
- Looking at the property type distribution in Free Union, House properties are the most common (58.8%), reflecting the local real estate landscape.
- Houses represent a significant 58.8% portion, catering likely to families or larger groups.
- The presence of 11.8% Hotel/Boutique listings indicates integration with traditional hospitality.
Free Union Airbnb Room Capacity Analysis (2025): Bedroom Distribution
Distribution of Listings by Number of Bedrooms
Room Capacity Insights for Free Union
- The dominant room capacity in Free Union is 3 bedrooms listings, making up 29.4% of the market. This suggests a strong demand for properties suitable for families or small groups.
- Together, 3 bedrooms and 4 bedrooms properties represent 47.0% of the active Airbnb listings in Free Union, indicating a high concentration in these sizes.
- A significant 58.8% of listings offer 3+ bedrooms, catering to larger groups and families seeking more space in Free Union.
Free Union Vacation Rental Guest Capacity Trends (2025)
Distribution of Listings by Guest Capacity
Guest Capacity Insights for Free Union
- The most common guest capacity trend in Free Union vacation rentals is listings accommodating 8+ guests (29.4%). This suggests the primary traveler segment is likely larger groups.
- Properties designed for 8+ guests and 2 guests dominate the Free Union STR market, accounting for 47.0% of listings.
- 47.1% of properties accommodate 6+ guests, serving the market segment for larger families or group travel in Free Union.
- On average, properties in Free Union are equipped to host 5.3 guests.
Free Union Airbnb Booking Patterns (2025): Available vs. Booked Days
Available Days Distribution
Booked Days Distribution
Booking Pattern Insights for Free Union
- The most common availability pattern in Free Union falls within the 181-270 days range, representing 35.3% of listings. This suggests many properties have significant open periods on their calendars.
- Approximately 64.7% of listings show high availability (181+ days open annually), indicating potential for increased bookings or specific owner usage patterns.
- For booked days, the 91-180 days range is most frequent in Free Union (47.1%), reflecting common guest stay durations or potential owner blocking patterns.
- A notable 35.3% of properties secure long booking periods (181+ days booked per year), highlighting successful long-term rental strategies or significant owner usage.
Free Union Airbnb Minimum Stay Requirements Analysis
Distribution of Listings by Minimum Night Requirement
1 Night
2 listings
12.5% of total
2 Nights
10 listings
62.5% of total
7-29 Nights
1 listings
6.3% of total
30+ Nights
3 listings
18.8% of total
Key Insights
- The most prevalent minimum stay requirement in Free Union is 2 Nights, adopted by 62.5% of listings. This highlights the market's preference for shorter, flexible bookings.
- A strong majority (75.0%) of the Free Union Airbnb data shows acceptance of very short stays (1-2 nights), indicating a dynamic, high-turnover market.
- A significant segment (18.8%) caters to monthly stays (30+ nights) in Free Union, pointing to opportunities in the extended-stay market.
Recommendations
- Align with the market by considering a 2 Nights minimum stay, as 62.5% of Free Union hosts use this setting.
- If feasible, allowing 1-night stays, especially midweek or during low season, could capture last-minute bookings, as only 12.5% currently do.
- A 2-night minimum appears standard (62.5%). Consider this for weekends or peak periods.
- Explore offering discounts for stays of 30+ nights to attract the 18.8% of the market seeking extended stays.
- Adjust minimum nights based on seasonality – potentially shorter during low season and longer during peak demand periods in Free Union.
Free Union Airbnb Cancellation Policy Trends Analysis (2025)
Flexible
4 listings
26.7% of total
Moderate
3 listings
20% of total
Firm
4 listings
26.7% of total
Strict
4 listings
26.7% of total
Cancellation Policy Insights for Free Union
- The prevailing Airbnb cancellation policy trend in Free Union is Flexible, used by 26.7% of listings.
- A majority (53.4%) of hosts in Free Union utilize Firm or Strict policies, indicating a market where hosts prioritize booking security.
Recommendations for Hosts
- Consider adopting a Flexible policy to align with the 26.7% market standard in Free Union.
- Regularly review your cancellation policy against competitors and market demand shifts in Free Union.
Free Union STR Booking Lead Time Analysis (2025)
Average Booking Lead Time by Month
Booking Lead Time Insights for Free Union
- The overall average booking lead time for vacation rentals in Free Union is 49 days.
- Guests book furthest in advance for stays during May (average 75 days), likely coinciding with peak travel demand or local events.
- The shortest booking windows occur for stays in January (average 19 days), indicating more last-minute travel plans during this time.
- Seasonally, Fall (51 days avg.) sees the longest lead times, while Winter (36 days avg.) has the shortest, reflecting typical travel planning cycles.
Recommendations for Hosts
- Use the overall average lead time (49 days) as a baseline for your pricing and availability strategy in Free Union.
- For May stays, consider implementing length-of-stay discounts or slightly higher rates for bookings made less than 75 days out to capitalize on advance planning.
- Target marketing efforts for the Fall season well in advance (at least 51 days) to capture early planners.
- Monitor your own booking lead times against these Free Union averages to identify opportunities for dynamic pricing adjustments.
Popular & Essential Airbnb Amenities in Free Union (2025)
Amenity Prevalence
Amenity Insights for Free Union
- Essential amenities in Free Union that guests expect include: Hot water, Smoke alarm, Heating, Air conditioning, Wifi, Free parking on premises. Lacking these (any) could significantly impact bookings.
- Popular amenities like Fire extinguisher, Carbon monoxide alarm, Kitchen are common but not universal. Offering these can provide a competitive edge.
Recommendations for Hosts
- Ensure your listing includes all essential amenities for Free Union: Hot water, Smoke alarm, Heating, Air conditioning, Wifi, Free parking on premises.
- Consider adding popular differentiators like Fire extinguisher or Carbon monoxide alarm to increase appeal.
- Highlight unique or less common amenities you offer (e.g., hot tub, dedicated workspace, EV charger) in your listing description and photos.
- Regularly check competitor amenities in Free Union to stay competitive.
Free Union Airbnb Guest Demographics & Profile Analysis (2025)
Guest Profile Summary for Free Union
- The typical guest profile for Airbnb in Free Union consists of primarily domestic travelers (91%), often arriving from nearby Richmond, typically belonging to the Post-2000s (Gen Z/Alpha) group (50%), primarily speaking English or Spanish.
- Domestic travelers account for 90.9% of guests.
- Key international markets include United States (90.9%) and DC (7.2%).
- Top languages spoken are English (72.8%) followed by Spanish (10.8%).
- A significant demographic segment is the Post-2000s (Gen Z/Alpha) group, representing 50% of guests.
Recommendations for Hosts
- Target domestic marketing efforts towards travelers from Richmond and Washington.
- Tailor amenities and listing descriptions to appeal to the dominant Post-2000s (Gen Z/Alpha) demographic (e.g., highlight fast WiFi, smart home features, local guides).
- Highlight unique local experiences or amenities relevant to the primary guest profile.
- Consider seasonal promotions aligned with peak travel times for key origin markets.
Nearby Short-Term Rental Market Comparison
How does the Free Union Airbnb market stack up against its neighbors? Compare key performance metrics like average monthly revenue, ADR, and occupancy rates in surrounding areas to understand the broader regional STR landscape.
| Market | Active Properties | Monthly Revenue | Daily Rate | Avg. Occupancy |
|---|---|---|---|---|
| Castleton | 10 | $6,431 | $530.12 | 39% |
| Bentonville | 21 | $5,097 | $394.47 | 53% |
| Shannondale | 45 | $4,918 | $301.01 | 56% |
| Skyland Estates | 13 | $4,558 | $255.83 | 62% |
| Nellysford | 62 | $4,228 | $381.92 | 37% |
| Washington | 11 | $4,208 | $384.83 | 45% |
| Penhook | 18 | $4,178 | $569.85 | 39% |
| Middleburg | 40 | $4,147 | $455.88 | 41% |
| Shenandoah Shores | 15 | $4,138 | $398.57 | 43% |
| Rockbridge Baths | 11 | $3,979 | $289.68 | 44% |