McLean Airbnb Market Analysis 2026: Short Term Rental Data & Vacation Rental Statistics in Virginia, United States
Is Airbnb profitable in McLean in 2026? Explore comprehensive Airbnb analytics for McLean, Virginia, United States to uncover income potential. This 2026 STR market report for McLean, based on AirROI data from February 2025 to January 2026, reveals key trends in the niche market of 39 active listings.
Whether you're considering an Airbnb investment in McLean, optimizing your existing vacation rental, or exploring rental arbitrage opportunities, understanding the McLean Airbnb data is crucial. Leveraging the low regulation environment is key to maximizing your short term rental income potential. Let's dive into the specifics.
Key McLean Airbnb Performance Metrics Overview
Monthly Airbnb Revenue Variations & Income Potential in McLean (2026)
Understanding the monthly revenue variations for Airbnb listings in McLean is key to maximizing your short term rental income potential. Seasonality significantly impacts earnings. Our analysis, based on data from the past 12 months, shows that the peak revenue month for STRs in McLean is typically October, while January often presents the lowest earnings, highlighting opportunities for strategic pricing adjustments during shoulder and low seasons. Explore the typical Airbnb income in McLean across different performance tiers:
- Best-in-class properties (Top 10%) achieve $14,523+ monthly, often utilizing dynamic pricing and superior guest experiences.
- Strong performing properties (Top 25%) earn $6,735 or more, indicating effective management and desirable locations/amenities.
- Typical properties (Median) generate around $4,118 per month, representing the average market performance.
- Entry-level properties (Bottom 25%) see earnings around $1,659, often with potential for optimization.
Average Monthly Airbnb Earnings Trend in McLean
McLean Airbnb Occupancy Rate Trends (2026)
Maximize your bookings by understanding the McLean STR occupancy trends. Seasonal demand shifts significantly influence how often properties are booked. Typically, Octobersees the highest demand (peak season occupancy), while May experiences the lowest (low season). Effective strategies, like adjusting minimum stays or offering promotions, can boost occupancy during slower periods. Here's how different property tiers perform in McLean:
- Best-in-class properties (Top 10%) achieve 85%+ occupancy, indicating high desirability and potentially optimized availability.
- Strong performing properties (Top 25%) maintain 72% or higher occupancy, suggesting good market fit and guest satisfaction.
- Typical properties (Median) have an occupancy rate around 44%.
- Entry-level properties (Bottom 25%) average 21% occupancy, potentially facing higher vacancy.
Average Monthly Occupancy Rate Trend in McLean
Average Daily Rate (ADR) Airbnb Trends in McLean (2026)
Effective short term rental pricing strategy in McLean involves understanding monthly ADR fluctuations. The Average Daily Rate (ADR) for Airbnb in McLean typically peaks in June and dips lowest during January. Leveraging Airbnb dynamic pricing tools or strategies based on this seasonality can significantly boost revenue. Here's a look at the typical nightly rates achieved:
- Best-in-class properties (Top 10%) command rates of $940+ per night, often due to premium features or locations.
- Strong performing properties (Top 25%) achieve nightly rates of $294 or more.
- Typical properties (Median) charge around $208 per night.
- Entry-level properties (Bottom 25%) earn around $155 per night.
Average Daily Rate (ADR) Trend by Month in McLean
Get Live McLean Market Intelligence 👇

Explore Real-time Analytics
Airbnb Seasonality Analysis & Trends in McLean (2026)
Peak Season (October, September, April)
- Revenue averages $6,765 per month
- Occupancy rates average 53.1%
- Daily rates average $378
Shoulder Season
- Revenue averages $5,646 per month
- Occupancy maintains around 50.6%
- Daily rates hold near $409
Low Season (January, May, December)
- Revenue drops to average $4,421 per month
- Occupancy decreases to average 34.2%
- Daily rates adjust to average $375
Seasonality Insights for McLean
- The Airbnb seasonality in McLean shows moderate seasonality with distinct peak and low periods. While the sections above show seasonal averages, it's also insightful to look at the extremes:
- During the high season, the absolute peak month showcases McLean's highest earning potential, with monthly revenues capable of climbing to $6,773, occupancy reaching a high of 57.3%, and ADRs peaking at $432.
- Conversely, the slowest single month of the year, typically falling within the low season, marks the market's lowest point. In this month, revenue might dip to $3,945, occupancy could drop to 31.9%, and ADRs may adjust down to $337.
- Understanding both the seasonal averages and these monthly peaks and troughs in revenue, occupancy, and ADR is crucial for maximizing your Airbnb profit potential in McLean.
Seasonal Strategies for Maximizing Profit
- Peak Season: Maximize revenue through premium pricing and potentially longer minimum stays. Ensure high availability.
- Low Season: Offer competitive pricing, special promotions (e.g., extended stay discounts), and flexible cancellation policies. Target off-season travelers like remote workers or budget-conscious guests.
- Shoulder Seasons: Implement dynamic pricing that balances peak and low rates. Target weekend travelers or specific events. Offer slightly more flexible terms than peak season.
- Regularly analyze your own performance against these McLean seasonality benchmarks and adjust your pricing and availability strategy accordingly.
Best Areas for Airbnb Investment in McLean (2026)
Exploring the top neighborhoods for short-term rentals in McLean? This section highlights key areas, outlining why they are attractive for hosts and guests, along with notable local attractions. Consider these locations based on your target guest profile and investment strategy.
| Neighborhood / Area | Why Host Here? (Target Guests & Appeal) | Key Attractions & Landmarks |
|---|---|---|
| Langley | A desirable community known for its proximity to Washington, D.C. and great schools. Ideal for families and professionals working in the city who seek suburban comfort. | Wolf Trap National Park, Marymount University, Tysons Corner Center, Great Falls Park, McLean Community Center |
| Downtown McLean | The heart of McLean with easy access to shopping, dining, and entertainment. It attracts visitors looking for urban conveniences in a safe neighborhood. | McLean Central Park, McLean Farmers Market, Tysons Galleria, Chesterbrook Residences, local boutiques and cafes |
| West McLean | A residential area with upscale homes and a quiet environment, popular among long-term renters and visitors seeking a peaceful stay near the D.C. area. | Clemyjontri Park, Scott’s Run Nature Preserve, McLean Hamlet Park, local gourmet restaurants, community events |
| Tysons Corner | A major commercial district with a mix of retail, dining, and corporate offices. Great for short-term rentals catering to business travelers and shoppers. | Tysons Corner Center, The Galleria at Tysons II, Capital One Hall, local dining options, public transportation access |
| Chesterbrook | A scenic neighborhood with parks and walking trails, ideal for those seeking outdoor activities and family-friendly environments. | Chesterbrook Park, Mason District Park, local community events, nature trails, family-friendly playgrounds |
| Idylwood | A quaint community with various dining options and parks, popular with those who want a suburban feel while being close to urban amenities. | Falls Church City Farmers Market, Idylwood Park, local cafes, public transport access, community gatherings |
| McLean Hamlet | A beautiful residential area known for spacious homes and an active community, appealing to visitors seeking a home-like atmosphere. | McLean Hamlet Park, nearby nature trails, family-friendly activities, local schools, community clubs |
| Great Falls | Just outside McLean, this area is known for its natural beauty and luxurious homes, perfect for visitors looking for a serene retreat near D.C. | Great Falls Park, Virginia Studios, local artisan shops, scenic walking trails, small local eateries |
Understanding Airbnb License Requirements & STR Laws in McLean (2026)
While McLean, Virginia, United States currently shows low STR regulations, specific Airbnb license requirements might still exist or change. Always verify the latest short term rental regulations and Airbnb license requirements directly with local government authorities for McLean to ensure full compliance before hosting.
(Source: AirROI data, 2026, finding no licensed listings among those analyzed)
Top Performing Airbnb Properties in McLean (2026)
Benchmark your potential! Explore examples of top-performing Airbnb properties in McLeanbased on Trailing Twelve Month (TTM) revenue. Analyze their characteristics, revenue, occupancy rate, and ADR to understand what drives success in this market.

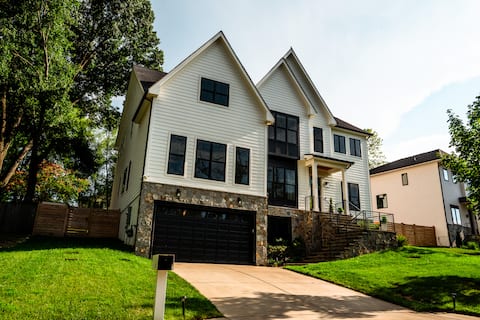
Modern Luxury in the Heart of McLean
Entire Place • 5 bedrooms
Modern 6 Bd DC/NOVA Dream Home!+gym+theater+playrm
Entire Place • 6 bedrooms
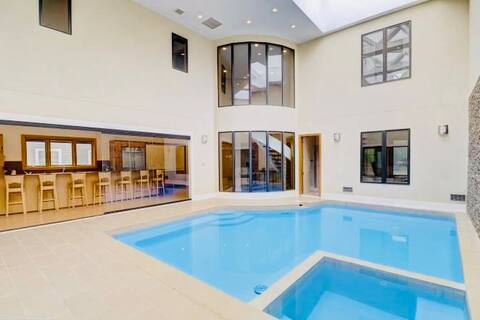
Heated Indoor Pool & 10 Miles to DC!
Entire Place • 5 bedrooms
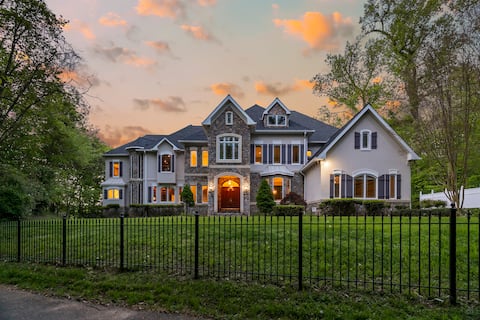
Private Retreat with Spectacular Waterfront Views
Entire Place • 7 bedrooms

Stay,Work,Thrive:premier House
Entire Place • 6 bedrooms

The McLean Luxury Retreat
Entire Place • 6 bedrooms
Note: Performance varies based on location, size, amenities, seasonality, and management quality. Data reflects the past 12 months.
Top Performing Airbnb Hosts in McLean (2026)
Learn from the best! This table showcases top-performing Airbnb hosts in McLean based on the number of properties managed and estimated total revenue over the past year. Analyze their scale and performance metrics.
| Host Name | Properties | Grossing Revenue | Stay Reviews | Avg Rating |
|---|---|---|---|---|
| Jay | 5 | $263,212 | 142 | 4.75/5.0 |
| Dominic | 1 | $195,814 | 44 | 5.00/5.0 |
| Becky | 2 | $187,566 | 44 | 4.85/5.0 |
| Mark | 1 | $166,977 | 10 | 5.00/5.0 |
| Stella Lux | 6 | $151,277 | 46 | 4.87/5.0 |
| Eiman | 1 | $134,667 | 20 | 5.00/5.0 |
| Fgc Llc | 1 | $133,863 | 26 | 4.58/5.0 |
| Nickolas | 1 | $88,646 | 5 | 5.00/5.0 |
| Danielle | 1 | $53,628 | 111 | 4.95/5.0 |
| Saraa As | 1 | $47,636 | 7 | 4.57/5.0 |
Analyzing the strategies of top hosts, such as their property selection, pricing, and guest communication, can offer valuable lessons for optimizing your own Airbnb operations in McLean.
Dive Deeper: Advanced McLean STR Market Data (2026)
Ready to unlock more insights? AirROI provides access to advanced metrics and comprehensive Airbnb data for McLean. Explore detailed analytics beyond this report to refine your investment strategy, optimize pricing, and maximize your vacation rental profits.
Explore Advanced MetricsMcLean Short-Term Rental Market Composition (2026): Property & Room Types
Room Type Distribution
Property Type Distribution
Market Composition Insights for McLean
- The McLean Airbnb market composition is heavily skewed towards Entire Home/Apt listings, which make up 92.3% of the 39 active rentals. This indicates strong guest preference for privacy and space.
- Looking at the property type distribution in McLean, Apartment/Condo properties are the most common (59%), reflecting the local real estate landscape.
- Houses represent a significant 30.8% portion, catering likely to families or larger groups.
- Smaller segments like outdoor/unique, hotel/boutique (combined 5.2%) offer potential for unique stay experiences.
McLean Airbnb Room Capacity Analysis (2026): Bedroom Distribution
Distribution of Listings by Number of Bedrooms
Room Capacity Insights for McLean
- The dominant room capacity in McLean is 2 bedrooms listings, making up 48.7% of the market. This suggests a strong demand for properties suitable for couples or solo travelers.
- Together, 2 bedrooms and 5+ bedrooms properties represent 66.6% of the active Airbnb listings in McLean, indicating a high concentration in these sizes.
- A significant 28.1% of listings offer 3+ bedrooms, catering to larger groups and families seeking more space in McLean.
McLean Vacation Rental Guest Capacity Trends (2026)
Distribution of Listings by Guest Capacity
Guest Capacity Insights for McLean
- The most common guest capacity trend in McLean vacation rentals is listings accommodating 4 guests (43.6%). This suggests the primary traveler segment is likely small families or groups.
- Properties designed for 4 guests and 8+ guests dominate the McLean STR market, accounting for 66.7% of listings.
- 28.2% of properties accommodate 6+ guests, serving the market segment for larger families or group travel in McLean.
- On average, properties in McLean are equipped to host 4.8 guests.
McLean Airbnb Booking Patterns (2026): Available vs. Booked Days
Available Days Distribution
Booked Days Distribution
Booking Pattern Insights for McLean
- The most common availability pattern in McLean falls within the 271-366 days range, representing 43.6% of listings. This suggests many properties have significant open periods on their calendars.
- Approximately 82.1% of listings show high availability (181+ days open annually), indicating potential for increased bookings or specific owner usage patterns.
- For booked days, the 91-180 days range is most frequent in McLean (38.5%), reflecting common guest stay durations or potential owner blocking patterns.
- A notable 17.9% of properties secure long booking periods (181+ days booked per year), highlighting successful long-term rental strategies or significant owner usage.
McLean Airbnb Minimum Stay Requirements Analysis
Distribution of Listings by Minimum Night Requirement
1 Night
2 listings
5.1% of total
2 Nights
4 listings
10.3% of total
3 Nights
2 listings
5.1% of total
4-6 Nights
7 listings
17.9% of total
7-29 Nights
12 listings
30.8% of total
30+ Nights
12 listings
30.8% of total
Key Insights
- The most prevalent minimum stay requirement in McLean is 7-29 Nights, adopted by 30.8% of listings. This highlights the market's preference for shorter, flexible bookings.
- Very short stays (1-2 nights) are less common (15.4%), suggesting hosts prefer slightly longer bookings to optimize turnover.
- A significant segment (30.8%) caters to monthly stays (30+ nights) in McLean, pointing to opportunities in the extended-stay market.
Recommendations
- Align with the market by considering a 7-29 Nights minimum stay, as 30.8% of McLean hosts use this setting.
- If feasible, allowing 1-night stays, especially midweek or during low season, could capture last-minute bookings, as only 5.1% currently do.
- Explore offering discounts for stays of 30+ nights to attract the 30.8% of the market seeking extended stays.
- Adjust minimum nights based on seasonality – potentially shorter during low season and longer during peak demand periods in McLean.
McLean Airbnb Cancellation Policy Trends Analysis (2026)
Limited
1 listings
2.6% of total
Flexible
6 listings
15.4% of total
Moderate
4 listings
10.3% of total
Firm
14 listings
35.9% of total
Strict
14 listings
35.9% of total
Cancellation Policy Insights for McLean
- The prevailing Airbnb cancellation policy trend in McLean is Firm, used by 35.9% of listings.
- A majority (71.8%) of hosts in McLean utilize Firm or Strict policies, indicating a market where hosts prioritize booking security.
Recommendations for Hosts
- Consider adopting a Firm policy to align with the 35.9% market standard in McLean.
- With 35.9% using Strict terms, this is a viable option in McLean, particularly for high-value properties or during peak demand periods.
- Regularly review your cancellation policy against competitors and market demand shifts in McLean.
McLean STR Booking Lead Time Analysis (2026)
Average Booking Lead Time by Month
Booking Lead Time Insights for McLean
- The overall average booking lead time for vacation rentals in McLean is 32 days.
- Guests book furthest in advance for stays during December (average 52 days), likely coinciding with peak travel demand or local events.
- The shortest booking windows occur for stays in January (average 16 days), indicating more last-minute travel plans during this time.
- Seasonally, Spring (41 days avg.) sees the longest lead times, while Summer (31 days avg.) has the shortest, reflecting typical travel planning cycles.
Recommendations for Hosts
- Use the overall average lead time (32 days) as a baseline for your pricing and availability strategy in McLean.
- For December stays, consider implementing length-of-stay discounts or slightly higher rates for bookings made less than 52 days out to capitalize on advance planning.
- Target marketing efforts for the Spring season well in advance (at least 41 days) to capture early planners.
- Monitor your own booking lead times against these McLean averages to identify opportunities for dynamic pricing adjustments.
Popular & Essential Airbnb Amenities in McLean (2026)
Amenity Prevalence
Amenity Insights for McLean
- Essential amenities in McLean that guests expect include: Smoke alarm, Wifi, Air conditioning, TV, Microwave, Heating, Refrigerator. Lacking these (any) could significantly impact bookings.
- Popular amenities like Washer, Coffee maker, Iron are common but not universal. Offering these can provide a competitive edge.
Recommendations for Hosts
- Ensure your listing includes all essential amenities for McLean: Smoke alarm, Wifi, Air conditioning, TV, Microwave, Heating, Refrigerator.
- Prioritize adding missing essentials: TV, Microwave, Heating, Refrigerator.
- Consider adding popular differentiators like Washer or Coffee maker to increase appeal.
- Highlight unique or less common amenities you offer (e.g., hot tub, dedicated workspace, EV charger) in your listing description and photos.
- Regularly check competitor amenities in McLean to stay competitive.
McLean Airbnb Guest Demographics & Profile Analysis (2026)
Guest Profile Summary for McLean
- The typical guest profile for Airbnb in McLean consists of primarily domestic travelers (79%), often arriving from nearby Washington, typically belonging to the Post-2000s (Gen Z/Alpha) group (50%), primarily speaking English or Spanish.
- Domestic travelers account for 79.1% of guests.
- Key international markets include United States (79.1%) and DC (7.3%).
- Top languages spoken are English (57%) followed by Spanish (15.9%).
- A significant demographic segment is the Post-2000s (Gen Z/Alpha) group, representing 50% of guests.
Recommendations for Hosts
- Target domestic marketing efforts towards travelers from Washington and New York.
- Tailor amenities and listing descriptions to appeal to the dominant Post-2000s (Gen Z/Alpha) demographic (e.g., highlight fast WiFi, smart home features, local guides).
- Highlight unique local experiences or amenities relevant to the primary guest profile.
- Consider seasonal promotions aligned with peak travel times for key origin markets.
Nearby Short-Term Rental Market Comparison
How does the McLean Airbnb market stack up against its neighbors? Compare key performance metrics like average monthly revenue, ADR, and occupancy rates in surrounding areas to understand the broader regional STR landscape.
| Market | Active Properties | Monthly Revenue | Daily Rate | Avg. Occupancy |
|---|---|---|---|---|
| Centreville | 17 | $6,298 | $565.66 | 45% |
| McGaheysville | 83 | $6,156 | $431.72 | 45% |
| Mayo | 13 | $5,915 | $447.58 | 51% |
| Shannondale | 45 | $5,808 | $337.30 | 54% |
| Stevensville | 80 | $5,412 | $556.79 | 41% |
| Bentonville | 23 | $5,372 | $420.82 | 51% |
| Nellysford | 62 | $5,276 | $426.33 | 39% |
| Weems | 11 | $5,077 | $417.22 | 47% |
| Lower Windsor Township | 14 | $5,062 | $428.71 | 45% |
| Arundel on the Bay | 29 | $5,043 | $486.96 | 40% |