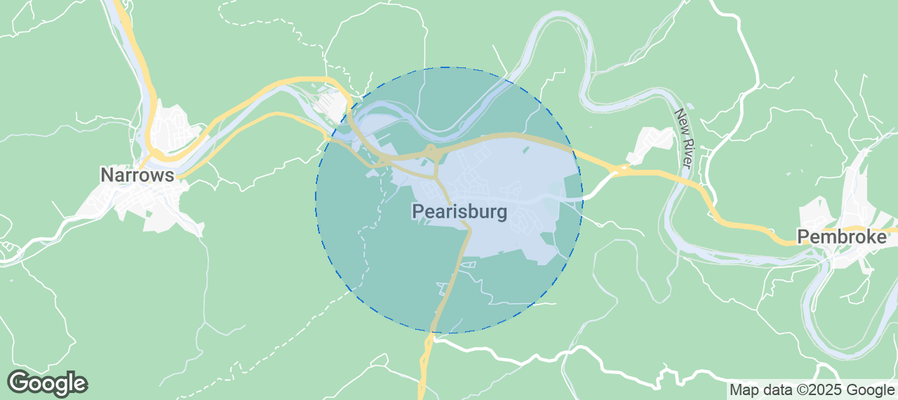
Pearisburg Airbnb Market Analysis 2026: Short Term Rental Data & Vacation Rental Statistics in Virginia, United States
Is Airbnb profitable in Pearisburg in 2026? Explore comprehensive Airbnb analytics for Pearisburg, Virginia, United States to uncover income potential. This 2026 STR market report for Pearisburg, based on AirROI data from February 2025 to January 2026, reveals key trends in the niche market of 20 active listings.
Whether you're considering an Airbnb investment in Pearisburg, optimizing your existing vacation rental, or exploring rental arbitrage opportunities, understanding the Pearisburg Airbnb data is crucial. Leveraging the low regulation environment is key to maximizing your short term rental income potential. Let's dive into the specifics.
Key Pearisburg Airbnb Performance Metrics Overview
Monthly Airbnb Revenue Variations & Income Potential in Pearisburg (2026)
Understanding the monthly revenue variations for Airbnb listings in Pearisburg is key to maximizing your short term rental income potential. Seasonality significantly impacts earnings. Our analysis, based on data from the past 12 months, shows that the peak revenue month for STRs in Pearisburg is typically July, while March often presents the lowest earnings, highlighting opportunities for strategic pricing adjustments during shoulder and low seasons. Explore the typical Airbnb income in Pearisburg across different performance tiers:
- Best-in-class properties (Top 10%) achieve $3,959+ monthly, often utilizing dynamic pricing and superior guest experiences.
- Strong performing properties (Top 25%) earn $2,670 or more, indicating effective management and desirable locations/amenities.
- Typical properties (Median) generate around $1,501 per month, representing the average market performance.
- Entry-level properties (Bottom 25%) see earnings around $822, often with potential for optimization.
Average Monthly Airbnb Earnings Trend in Pearisburg
Pearisburg Airbnb Occupancy Rate Trends (2026)
Maximize your bookings by understanding the Pearisburg STR occupancy trends. Seasonal demand shifts significantly influence how often properties are booked. Typically, Julysees the highest demand (peak season occupancy), while January experiences the lowest (low season). Effective strategies, like adjusting minimum stays or offering promotions, can boost occupancy during slower periods. Here's how different property tiers perform in Pearisburg:
- Best-in-class properties (Top 10%) achieve 59%+ occupancy, indicating high desirability and potentially optimized availability.
- Strong performing properties (Top 25%) maintain 44% or higher occupancy, suggesting good market fit and guest satisfaction.
- Typical properties (Median) have an occupancy rate around 26%.
- Entry-level properties (Bottom 25%) average 14% occupancy, potentially facing higher vacancy.
Average Monthly Occupancy Rate Trend in Pearisburg
Average Daily Rate (ADR) Airbnb Trends in Pearisburg (2026)
Effective short term rental pricing strategy in Pearisburg involves understanding monthly ADR fluctuations. The Average Daily Rate (ADR) for Airbnb in Pearisburg typically peaks in October and dips lowest during February. Leveraging Airbnb dynamic pricing tools or strategies based on this seasonality can significantly boost revenue. Here's a look at the typical nightly rates achieved:
- Best-in-class properties (Top 10%) command rates of $260+ per night, often due to premium features or locations.
- Strong performing properties (Top 25%) achieve nightly rates of $231 or more.
- Typical properties (Median) charge around $149 per night.
- Entry-level properties (Bottom 25%) earn around $96 per night.
Average Daily Rate (ADR) Trend by Month in Pearisburg
Get Live Pearisburg Market Intelligence 👇
Explore Real-time Analytics
Airbnb Seasonality Analysis & Trends in Pearisburg (2026)
Peak Season (July, May, October)
- Revenue averages $2,391 per month
- Occupancy rates average 36.9%
- Daily rates average $168
Shoulder Season
- Revenue averages $1,981 per month
- Occupancy maintains around 32.1%
- Daily rates hold near $164
Low Season (January, February, March)
- Revenue drops to average $1,152 per month
- Occupancy decreases to average 22.9%
- Daily rates adjust to average $158
Seasonality Insights for Pearisburg
- The Airbnb seasonality in Pearisburg shows highly seasonal trends requiring careful strategy. While the sections above show seasonal averages, it's also insightful to look at the extremes:
- During the high season, the absolute peak month showcases Pearisburg's highest earning potential, with monthly revenues capable of climbing to $2,410, occupancy reaching a high of 41.9%, and ADRs peaking at $173.
- Conversely, the slowest single month of the year, typically falling within the low season, marks the market's lowest point. In this month, revenue might dip to $1,058, occupancy could drop to 15.6%, and ADRs may adjust down to $154.
- Understanding both the seasonal averages and these monthly peaks and troughs in revenue, occupancy, and ADR is crucial for maximizing your Airbnb profit potential in Pearisburg.
Seasonal Strategies for Maximizing Profit
- Peak Season: Maximize revenue through premium pricing and potentially longer minimum stays. Ensure high availability.
- Low Season: Offer competitive pricing, special promotions (e.g., extended stay discounts), and flexible cancellation policies. Target off-season travelers like remote workers or budget-conscious guests.
- Shoulder Seasons: Implement dynamic pricing that balances peak and low rates. Target weekend travelers or specific events. Offer slightly more flexible terms than peak season.
- Regularly analyze your own performance against these Pearisburg seasonality benchmarks and adjust your pricing and availability strategy accordingly.
Best Areas for Airbnb Investment in Pearisburg (2026)
Exploring the top neighborhoods for short-term rentals in Pearisburg? This section highlights key areas, outlining why they are attractive for hosts and guests, along with notable local attractions. Consider these locations based on your target guest profile and investment strategy.
| Neighborhood / Area | Why Host Here? (Target Guests & Appeal) | Key Attractions & Landmarks |
|---|---|---|
| New River Valley | Picturesque region offering stunning natural vistas and outdoor activities, ideal for tourists seeking adventure in nature or relaxation by the river. | New River Gorge, Blue Ridge Parkway, Dolly Sods Wilderness, Hiking trails, Kayaking and canoeing opportunities |
| Giles County | Charming county with rich history and lovely landscapes, perfect for guests interested in exploring Virginia's heritage and natural beauty. | Giles County Historical Society, The Cascades, Mountain Lake, Hiking trails, Local wineries |
| Claytor Lake | Beautiful lake surrounded by nature, popular for water activities and camping. Attracts families and outdoor enthusiasts looking for recreational fun. | Claytor Lake State Park, Fishing and boating, Nature trails, Picnic areas, Wildlife watching |
| Pearisburg Historic District | Historic area with beautiful architecture and rich culture. Great for visitors interested in exploring history and local arts. | Historic buildings, Local art galleries, Annual festivals, Walking tours, Nearby scenic views |
| Blackburg | Vibrant town home to Virginia Tech, attracts students and visitors year-round looking for college-town atmosphere and diverse activities. | Virginia Tech campus, Museum of Geosciences, Hahn Horticulture Garden, Downtown shopping, Local music scene |
| Radford | Neighboring city known for its historic downtown and vibrant arts scene, appealing to those interested in culture and community events. | Radford University, New River Trail, Historic downtown, Local breweries, Theatre performances |
| Jefferson National Forest | Ideal for nature lovers and outdoor adventurers, with abundant trails and natural beauty, attracts hikers and campers year-round. | Appalachian Trail, Hiking and camping spots, Stunning scenic views, Wildlife observing, Nature photography opportunities |
| Christiansburg | Growing town with quick access to nearby attractions, perfect for visitors seeking both urban and rural experiences. | Downtown Christiansburg, Shopping centers, Local parks, Near the Appalachian Mountains, Dining options |
Understanding Airbnb License Requirements & STR Laws in Pearisburg (2026)
While Pearisburg, Virginia, United States currently shows low STR regulations, specific Airbnb license requirements might still exist or change. Always verify the latest short term rental regulations and Airbnb license requirements directly with local government authorities for Pearisburg to ensure full compliance before hosting.
(Source: AirROI data, 2026, finding no licensed listings among those analyzed)
Top Performing Airbnb Properties in Pearisburg (2026)
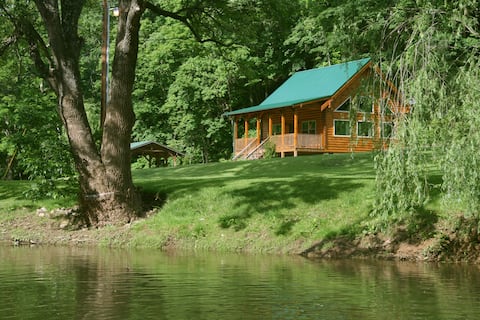
Benchmark your potential! Explore examples of top-performing Airbnb properties in Pearisburgbased on Trailing Twelve Month (TTM) revenue. Analyze their characteristics, revenue, occupancy rate, and ADR to understand what drives success in this market.
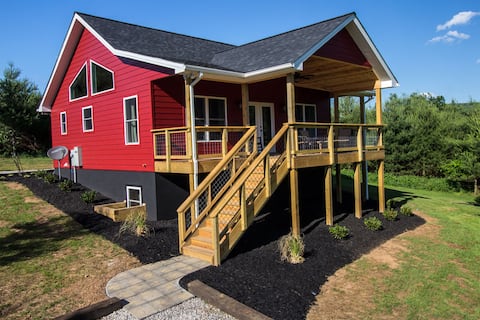
30 min from Blacksburg-Red Pine on Walker Creek
Entire Place • 3 bedrooms
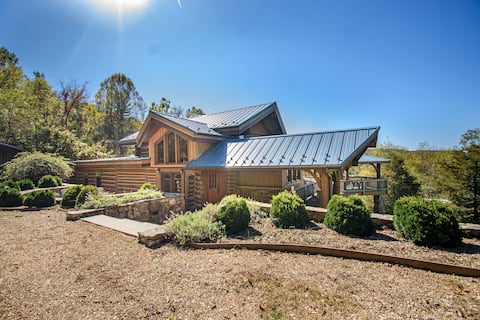
Walnut Hill Lodge
Entire Place • 4 bedrooms
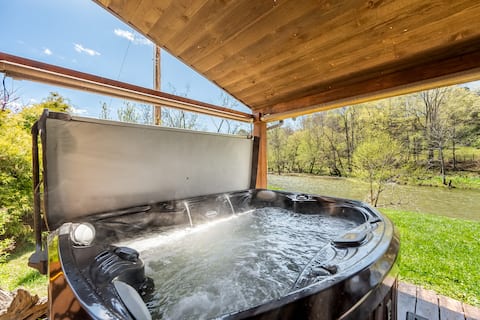
Riverside Cottage w/Hot Tub near Trails&Vineyard
Entire Place • 2 bedrooms
30 min from Blacksburg -Bear Foot on Walker Creek
Entire Place • 2 bedrooms
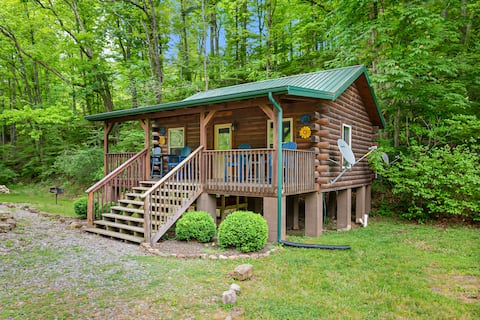
Lazy Days
Entire Place • 1 bedroom

Creekside Cabin in the Mountains
Entire Place • 2 bedrooms
Note: Performance varies based on location, size, amenities, seasonality, and management quality. Data reflects the past 12 months.
Top Performing Airbnb Hosts in Pearisburg (2026)
Learn from the best! This table showcases top-performing Airbnb hosts in Pearisburg based on the number of properties managed and estimated total revenue over the past year. Analyze their scale and performance metrics.
| Host Name | Properties | Grossing Revenue | Stay Reviews | Avg Rating |
|---|---|---|---|---|
| New River | 2 | $63,610 | 35 | 4.89/5.0 |
| Blue Ridge Escapes | 2 | $58,397 | 49 | 4.84/5.0 |
| Michelle | 2 | $55,895 | 50 | 4.94/5.0 |
| Kelley | 6 | $39,862 | 312 | 4.89/5.0 |
| Hannah | 2 | $30,107 | 65 | 4.99/5.0 |
| Lindsey | 1 | $17,459 | 18 | 4.94/5.0 |
| Erica And Jay | 1 | $15,243 | 30 | 5.00/5.0 |
| Neville | 4 | $3,349 | 121 | 4.96/5.0 |
Analyzing the strategies of top hosts, such as their property selection, pricing, and guest communication, can offer valuable lessons for optimizing your own Airbnb operations in Pearisburg.
Dive Deeper: Advanced Pearisburg STR Market Data (2026)
Ready to unlock more insights? AirROI provides access to advanced metrics and comprehensive Airbnb data for Pearisburg. Explore detailed analytics beyond this report to refine your investment strategy, optimize pricing, and maximize your vacation rental profits.
Explore Advanced MetricsPearisburg Short-Term Rental Market Composition (2026): Property & Room Types
Room Type Distribution
Property Type Distribution
Market Composition Insights for Pearisburg
- The Pearisburg Airbnb market composition is heavily skewed towards Entire Home/Apt listings, which make up 55% of the 20 active rentals. This indicates strong guest preference for privacy and space.
- However, a notable 45% share for Private Rooms suggests opportunities for budget-conscious travelers or hosts renting out spare rooms.
- Looking at the property type distribution in Pearisburg, Outdoor/Unique properties are the most common (40%), reflecting the local real estate landscape.
- Houses represent a significant 40% portion, catering likely to families or larger groups.
- The presence of 15% Hotel/Boutique listings indicates integration with traditional hospitality.
Pearisburg Airbnb Room Capacity Analysis (2026): Bedroom Distribution
Distribution of Listings by Number of Bedrooms
Room Capacity Insights for Pearisburg
- The dominant room capacity in Pearisburg is 1 bedroom listings, making up 30% of the market. This suggests a strong demand for properties suitable for couples or solo travelers.
- Together, 1 bedroom and 2 bedrooms properties represent 55.0% of the active Airbnb listings in Pearisburg, indicating a high concentration in these sizes.
Pearisburg Vacation Rental Guest Capacity Trends (2026)
Distribution of Listings by Guest Capacity
Guest Capacity Insights for Pearisburg
- The most common guest capacity trend in Pearisburg vacation rentals is listings accommodating 8+ guests (30%). This suggests the primary traveler segment is likely larger groups.
- Properties designed for 8+ guests and 2 guests dominate the Pearisburg STR market, accounting for 40.0% of listings.
- 35.0% of properties accommodate 6+ guests, serving the market segment for larger families or group travel in Pearisburg.
- On average, properties in Pearisburg are equipped to host 4.0 guests.
Pearisburg Airbnb Booking Patterns (2026): Available vs. Booked Days
Available Days Distribution
Booked Days Distribution
Booking Pattern Insights for Pearisburg
- The most common availability pattern in Pearisburg falls within the 271-366 days range, representing 65% of listings. This suggests many properties have significant open periods on their calendars.
- Approximately 100.0% of listings show high availability (181+ days open annually), indicating potential for increased bookings or specific owner usage patterns.
- For booked days, the 31-90 days range is most frequent in Pearisburg (40%), reflecting common guest stay durations or potential owner blocking patterns.
Pearisburg Airbnb Minimum Stay Requirements Analysis
Distribution of Listings by Minimum Night Requirement
1 Night
9 listings
45% of total
2 Nights
7 listings
35% of total
7-29 Nights
1 listings
5% of total
30+ Nights
3 listings
15% of total
Key Insights
- The most prevalent minimum stay requirement in Pearisburg is 1 Night, adopted by 45% of listings. This highlights the market's preference for shorter, flexible bookings.
- A strong majority (80.0%) of the Pearisburg Airbnb data shows acceptance of very short stays (1-2 nights), indicating a dynamic, high-turnover market.
- A significant segment (15%) caters to monthly stays (30+ nights) in Pearisburg, pointing to opportunities in the extended-stay market.
Recommendations
- Align with the market by considering a 1 Night minimum stay, as 45% of Pearisburg hosts use this setting.
- Explore offering discounts for stays of 30+ nights to attract the 15% of the market seeking extended stays.
- Adjust minimum nights based on seasonality – potentially shorter during low season and longer during peak demand periods in Pearisburg.
Pearisburg Airbnb Cancellation Policy Trends Analysis (2026)
Flexible
7 listings
35% of total
Moderate
8 listings
40% of total
Firm
5 listings
25% of total
Cancellation Policy Insights for Pearisburg
- The prevailing Airbnb cancellation policy trend in Pearisburg is Moderate, used by 40% of listings.
- The market strongly favors guest-friendly terms, with 75.0% of listings offering Flexible or Moderate policies. This suggests guests in Pearisburg may expect booking flexibility.
Recommendations for Hosts
- Consider adopting a Moderate policy to align with the 40% market standard in Pearisburg.
- Regularly review your cancellation policy against competitors and market demand shifts in Pearisburg.
Pearisburg STR Booking Lead Time Analysis (2026)
Average Booking Lead Time by Month
Booking Lead Time Insights for Pearisburg
- The overall average booking lead time for vacation rentals in Pearisburg is 52 days.
- Guests book furthest in advance for stays during May (average 98 days), likely coinciding with peak travel demand or local events.
- The shortest booking windows occur for stays in February (average 10 days), indicating more last-minute travel plans during this time.
- Seasonally, Fall (68 days avg.) sees the longest lead times, while Winter (24 days avg.) has the shortest, reflecting typical travel planning cycles.
Recommendations for Hosts
- Use the overall average lead time (52 days) as a baseline for your pricing and availability strategy in Pearisburg.
- For May stays, consider implementing length-of-stay discounts or slightly higher rates for bookings made less than 98 days out to capitalize on advance planning.
- During February, focus on last-minute booking availability and promotions, as guests book with very short notice (10 days avg.).
- Target marketing efforts for the Fall season well in advance (at least 68 days) to capture early planners.
- Monitor your own booking lead times against these Pearisburg averages to identify opportunities for dynamic pricing adjustments.
Popular & Essential Airbnb Amenities in Pearisburg (2026)
Amenity Prevalence
Amenity Insights for Pearisburg
- Essential amenities in Pearisburg that guests expect include: Coffee maker, Free parking on premises, Wifi, Air conditioning, Refrigerator. Lacking these (any) could significantly impact bookings.
- Popular amenities like Smoke alarm, Hot water, Bed linens are common but not universal. Offering these can provide a competitive edge.
Recommendations for Hosts
- Ensure your listing includes all essential amenities for Pearisburg: Coffee maker, Free parking on premises, Wifi, Air conditioning, Refrigerator.
- Prioritize adding missing essentials: Coffee maker, Free parking on premises, Wifi, Air conditioning, Refrigerator.
- Consider adding popular differentiators like Smoke alarm or Hot water to increase appeal.
- Highlight unique or less common amenities you offer (e.g., hot tub, dedicated workspace, EV charger) in your listing description and photos.
- Regularly check competitor amenities in Pearisburg to stay competitive.
Pearisburg Airbnb Guest Demographics & Profile Analysis (2026)
Guest Profile Summary for Pearisburg
- The typical guest profile for Airbnb in Pearisburg consists of primarily domestic travelers (94%), often arriving from nearby Virginia Beach, typically belonging to the Post-2000s (Gen Z/Alpha) group (50%), primarily speaking English or Spanish.
- Domestic travelers account for 94.1% of guests.
- Key international markets include United States (94.1%) and Canada (2.4%).
- Top languages spoken are English (77.4%) followed by Spanish (9.7%).
- A significant demographic segment is the Post-2000s (Gen Z/Alpha) group, representing 50% of guests.
Recommendations for Hosts
- Target domestic marketing efforts towards travelers from Virginia Beach and Alexandria.
- Tailor amenities and listing descriptions to appeal to the dominant Post-2000s (Gen Z/Alpha) demographic (e.g., highlight fast WiFi, smart home features, local guides).
- Highlight unique local experiences or amenities relevant to the primary guest profile.
- Consider seasonal promotions aligned with peak travel times for key origin markets.
Nearby Short-Term Rental Market Comparison
How does the Pearisburg Airbnb market stack up against its neighbors? Compare key performance metrics like average monthly revenue, ADR, and occupancy rates in surrounding areas to understand the broader regional STR landscape.
| Market | Active Properties | Monthly Revenue | Daily Rate | Avg. Occupancy |
|---|---|---|---|---|
| Penhook | 18 | $5,675 | $678.75 | 37% |
| Rockbridge Baths | 12 | $4,144 | $298.35 | 45% |
| Blacksburg | 297 | $4,116 | $509.14 | 40% |
| Goodview | 31 | $3,953 | $401.90 | 44% |
| Victor | 21 | $3,854 | $450.02 | 33% |
| Hot Springs | 27 | $3,785 | $336.52 | 41% |
| Slaty Fork | 48 | $3,687 | $424.67 | 32% |
| Lansing | 16 | $3,587 | $254.18 | 48% |
| Dublin | 30 | $3,580 | $287.49 | 43% |
| Semora | 50 | $3,408 | $377.45 | 38% |