Hansville Airbnb Market Analysis 2026: Short Term Rental Data & Vacation Rental Statistics in Washington, United States
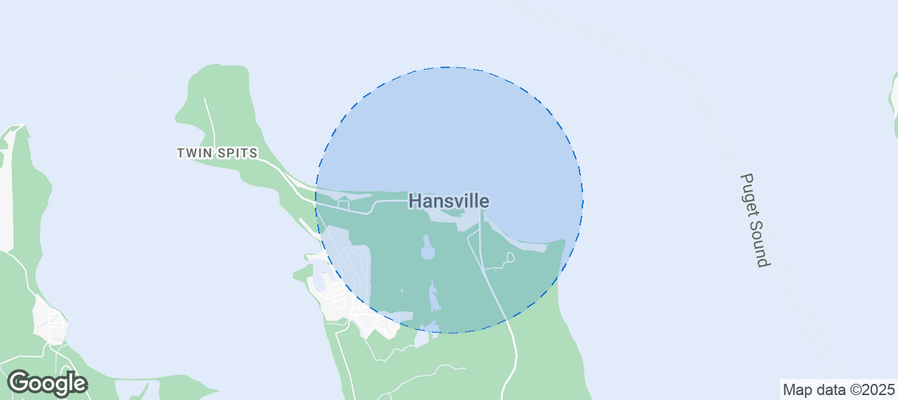
Is Airbnb profitable in Hansville in 2026? Explore comprehensive Airbnb analytics for Hansville, Washington, United States to uncover income potential. This 2026 STR market report for Hansville, based on AirROI data from February 2025 to January 2026, reveals key trends in the niche market of 25 active listings.
Whether you're considering an Airbnb investment in Hansville, optimizing your existing vacation rental, or exploring rental arbitrage opportunities, understanding the Hansville Airbnb data is crucial. Leveraging the low regulation environment is key to maximizing your short term rental income potential. Let's dive into the specifics.
Key Hansville Airbnb Performance Metrics Overview
Monthly Airbnb Revenue Variations & Income Potential in Hansville (2026)
Understanding the monthly revenue variations for Airbnb listings in Hansville is key to maximizing your short term rental income potential. Seasonality significantly impacts earnings. Our analysis, based on data from the past 12 months, shows that the peak revenue month for STRs in Hansville is typically August, while January often presents the lowest earnings, highlighting opportunities for strategic pricing adjustments during shoulder and low seasons. Explore the typical Airbnb income in Hansville across different performance tiers:
- Best-in-class properties (Top 10%) achieve $8,081+ monthly, often utilizing dynamic pricing and superior guest experiences.
- Strong performing properties (Top 25%) earn $5,822 or more, indicating effective management and desirable locations/amenities.
- Typical properties (Median) generate around $4,182 per month, representing the average market performance.
- Entry-level properties (Bottom 25%) see earnings around $2,195, often with potential for optimization.
Average Monthly Airbnb Earnings Trend in Hansville
Hansville Airbnb Occupancy Rate Trends (2026)
Maximize your bookings by understanding the Hansville STR occupancy trends. Seasonal demand shifts significantly influence how often properties are booked. Typically, Julysees the highest demand (peak season occupancy), while April experiences the lowest (low season). Effective strategies, like adjusting minimum stays or offering promotions, can boost occupancy during slower periods. Here's how different property tiers perform in Hansville:
- Best-in-class properties (Top 10%) achieve 82%+ occupancy, indicating high desirability and potentially optimized availability.
- Strong performing properties (Top 25%) maintain 72% or higher occupancy, suggesting good market fit and guest satisfaction.
- Typical properties (Median) have an occupancy rate around 43%.
- Entry-level properties (Bottom 25%) average 21% occupancy, potentially facing higher vacancy.
Average Monthly Occupancy Rate Trend in Hansville
Average Daily Rate (ADR) Airbnb Trends in Hansville (2026)
Effective short term rental pricing strategy in Hansville involves understanding monthly ADR fluctuations. The Average Daily Rate (ADR) for Airbnb in Hansville typically peaks in August and dips lowest during February. Leveraging Airbnb dynamic pricing tools or strategies based on this seasonality can significantly boost revenue. Here's a look at the typical nightly rates achieved:
- Best-in-class properties (Top 10%) command rates of $610+ per night, often due to premium features or locations.
- Strong performing properties (Top 25%) achieve nightly rates of $419 or more.
- Typical properties (Median) charge around $296 per night.
- Entry-level properties (Bottom 25%) earn around $214 per night.
Average Daily Rate (ADR) Trend by Month in Hansville
Get Live Hansville Market Intelligence 👇
Explore Real-time Analytics
Airbnb Seasonality Analysis & Trends in Hansville (2026)
Peak Season (August, July, June)
- Revenue averages $6,738 per month
- Occupancy rates average 58.6%
- Daily rates average $375
Shoulder Season
- Revenue averages $4,256 per month
- Occupancy maintains around 47.0%
- Daily rates hold near $356
Low Season (January, February, April)
- Revenue drops to average $2,748 per month
- Occupancy decreases to average 36.4%
- Daily rates adjust to average $336
Seasonality Insights for Hansville
- The Airbnb seasonality in Hansville shows highly seasonal trends requiring careful strategy. While the sections above show seasonal averages, it's also insightful to look at the extremes:
- During the high season, the absolute peak month showcases Hansville's highest earning potential, with monthly revenues capable of climbing to $7,414, occupancy reaching a high of 62.7%, and ADRs peaking at $381.
- Conversely, the slowest single month of the year, typically falling within the low season, marks the market's lowest point. In this month, revenue might dip to $2,362, occupancy could drop to 33.1%, and ADRs may adjust down to $321.
- Understanding both the seasonal averages and these monthly peaks and troughs in revenue, occupancy, and ADR is crucial for maximizing your Airbnb profit potential in Hansville.
Seasonal Strategies for Maximizing Profit
- Peak Season: Maximize revenue through premium pricing and potentially longer minimum stays. Ensure high availability.
- Low Season: Offer competitive pricing, special promotions (e.g., extended stay discounts), and flexible cancellation policies. Target off-season travelers like remote workers or budget-conscious guests.
- Shoulder Seasons: Implement dynamic pricing that balances peak and low rates. Target weekend travelers or specific events. Offer slightly more flexible terms than peak season.
- Regularly analyze your own performance against these Hansville seasonality benchmarks and adjust your pricing and availability strategy accordingly.
Best Areas for Airbnb Investment in Hansville (2026)
Exploring the top neighborhoods for short-term rentals in Hansville? This section highlights key areas, outlining why they are attractive for hosts and guests, along with notable local attractions. Consider these locations based on your target guest profile and investment strategy.
| Neighborhood / Area | Why Host Here? (Target Guests & Appeal) | Key Attractions & Landmarks |
|---|---|---|
| Point No Point | A picturesque waterfront area known for its lighthouse and stunning views of Puget Sound. It's perfect for travelers who enjoy nature and quiet retreats. | Point No Point Lighthouse, Kitsap County Park, Walking trails, Beach access, Birdwatching opportunities |
| Hansville Greenway | A beautiful natural green space that offers hiking trails and the tranquility of wooded areas. Ideal for eco-tourism and outdoor enthusiasts. | Hansville Greenway trails, Nature observation, Wildlife viewing, Picnic areas, Community events |
| Dollyesque Beach | A serene beach community known for its sandy shores and relaxed atmosphere. Attracts families and couples looking for a peaceful getaway. | Dollyesque Beach, Kayaking, Swimming, Beachcombing, Fishing |
| Yellows Lake | A charming lakefront area perfect for water activities and family-friendly vacations. Lake surrounded by scenic landscapes. | Yellows Lake, Boating, Fishing, Picnicking, Swimming |
| Kitsap Forest Theater | A unique outdoor theater nestled within a forest setting, popular for those looking to enjoy performances in nature. | Kitsap Forest Theater, Live performances, Nature trails, Cultural events, Family-friendly activities |
| Hansville Marina | A local marina that offers access to water sports and fishing, making it a great spot for travelers who enjoy maritime activities. | Hansville Marina, Boat rentals, Fishing opportunities, Scenic views, Marina dining options |
| Port Gamble | A historic town nearby known for its quaint shops and rich history. Perfect for visitors wanting a glimpse into local heritage and culture. | Port Gamble Historic District, Shops and cafes, Waterfront views, Community events, Kayaking |
| Kitsap County Parks | Numerous parks throughout the Kitsap County area that provide various recreational activities and beautiful natural settings for families. | Kitsap County Parks, Hiking, Camping, Wildlife excursions, Family-friendly picnic spots |
Understanding Airbnb License Requirements & STR Laws in Hansville (2026)
While Hansville, Washington, United States currently shows low STR regulations, specific Airbnb license requirements might still exist or change. Always verify the latest short term rental regulations and Airbnb license requirements directly with local government authorities for Hansville to ensure full compliance before hosting.
(Source: AirROI data, 2026, finding no licensed listings among those analyzed)
Top Performing Airbnb Properties in Hansville (2026)
Benchmark your potential! Explore examples of top-performing Airbnb properties in Hansvillebased on Trailing Twelve Month (TTM) revenue. Analyze their characteristics, revenue, occupancy rate, and ADR to understand what drives success in this market.
Mid-Century Cabin w/ Deck & Puget Sound Vistas!
Entire Place • 4 bedrooms

Log cabin w/ private beach, Sound views
Entire Place • 3 bedrooms

Sauna + Cold Plunge + Hot Tub & Red-light therapy
Entire Place • 2 bedrooms

Water View, Near Lighthouse, Beaches & Hiking
Entire Place • 2 bedrooms

Cozy waterfront cabin with panoramic view
Entire Place • 4 bedrooms

Cozy waterfront Guest House with spa in Hansville
Entire Place • 2 bedrooms
Note: Performance varies based on location, size, amenities, seasonality, and management quality. Data reflects the past 12 months.
Top Performing Airbnb Hosts in Hansville (2026)
Learn from the best! This table showcases top-performing Airbnb hosts in Hansville based on the number of properties managed and estimated total revenue over the past year. Analyze their scale and performance metrics.
| Host Name | Properties | Grossing Revenue | Stay Reviews | Avg Rating |
|---|---|---|---|---|
| Evolve | 1 | $84,664 | 81 | 4.93/5.0 |
| Crystal And Jason | 1 | $84,261 | 25 | 4.88/5.0 |
| Vicki | 1 | $68,437 | 125 | 4.98/5.0 |
| Joanna | 1 | $66,388 | 173 | 4.99/5.0 |
| Alejandro & Ana | 1 | $63,567 | 451 | 4.93/5.0 |
| Artur | 1 | $60,209 | 24 | 5.00/5.0 |
| Steven | 1 | $59,232 | 27 | 4.93/5.0 |
| Kay | 1 | $55,703 | 100 | 4.98/5.0 |
| John Michael | 1 | $54,191 | 93 | 4.90/5.0 |
| Amy | 1 | $50,023 | 123 | 5.00/5.0 |
Analyzing the strategies of top hosts, such as their property selection, pricing, and guest communication, can offer valuable lessons for optimizing your own Airbnb operations in Hansville.
Dive Deeper: Advanced Hansville STR Market Data (2026)
Ready to unlock more insights? AirROI provides access to advanced metrics and comprehensive Airbnb data for Hansville. Explore detailed analytics beyond this report to refine your investment strategy, optimize pricing, and maximize your vacation rental profits.
Explore Advanced MetricsHansville Short-Term Rental Market Composition (2026): Property & Room Types
Room Type Distribution
Property Type Distribution
Market Composition Insights for Hansville
- The Hansville Airbnb market composition is heavily skewed towards Entire Home/Apt listings, which make up 88% of the 25 active rentals. This indicates strong guest preference for privacy and space.
- Looking at the property type distribution in Hansville, House properties are the most common (56%), reflecting the local real estate landscape.
- Houses represent a significant 56% portion, catering likely to families or larger groups.
- The presence of 8% Hotel/Boutique listings indicates integration with traditional hospitality.
- Smaller segments like apartment/condo (combined 4.0%) offer potential for unique stay experiences.
Hansville Airbnb Room Capacity Analysis (2026): Bedroom Distribution
Distribution of Listings by Number of Bedrooms
Room Capacity Insights for Hansville
- The dominant room capacity in Hansville is 3 bedrooms listings, making up 32% of the market. This suggests a strong demand for properties suitable for families or small groups.
- Together, 3 bedrooms and 2 bedrooms properties represent 56.0% of the active Airbnb listings in Hansville, indicating a high concentration in these sizes.
- A significant 56.0% of listings offer 3+ bedrooms, catering to larger groups and families seeking more space in Hansville.
Hansville Vacation Rental Guest Capacity Trends (2026)
Distribution of Listings by Guest Capacity
Guest Capacity Insights for Hansville
- The most common guest capacity trend in Hansville vacation rentals is listings accommodating 6 guests (36%). This suggests the primary traveler segment is likely larger groups.
- Properties designed for 6 guests and 8+ guests dominate the Hansville STR market, accounting for 64.0% of listings.
- 64.0% of properties accommodate 6+ guests, serving the market segment for larger families or group travel in Hansville.
- On average, properties in Hansville are equipped to host 5.5 guests.
Hansville Airbnb Booking Patterns (2026): Available vs. Booked Days
Available Days Distribution
Booked Days Distribution
Booking Pattern Insights for Hansville
- The most common availability pattern in Hansville falls within the 271-366 days range, representing 52% of listings. This suggests many properties have significant open periods on their calendars.
- Approximately 76.0% of listings show high availability (181+ days open annually), indicating potential for increased bookings or specific owner usage patterns.
- For booked days, the 31-90 days range is most frequent in Hansville (28%), reflecting common guest stay durations or potential owner blocking patterns.
- A notable 24.0% of properties secure long booking periods (181+ days booked per year), highlighting successful long-term rental strategies or significant owner usage.
Hansville Airbnb Minimum Stay Requirements Analysis
Distribution of Listings by Minimum Night Requirement
1 Night
2 listings
8% of total
2 Nights
12 listings
48% of total
3 Nights
3 listings
12% of total
4-6 Nights
1 listings
4% of total
7-29 Nights
1 listings
4% of total
30+ Nights
6 listings
24% of total
Key Insights
- The most prevalent minimum stay requirement in Hansville is 2 Nights, adopted by 48% of listings. This highlights the market's preference for shorter, flexible bookings.
- A significant segment (24%) caters to monthly stays (30+ nights) in Hansville, pointing to opportunities in the extended-stay market.
Recommendations
- Align with the market by considering a 2 Nights minimum stay, as 48% of Hansville hosts use this setting.
- If feasible, allowing 1-night stays, especially midweek or during low season, could capture last-minute bookings, as only 8% currently do.
- A 2-night minimum appears standard (48%). Consider this for weekends or peak periods.
- Explore offering discounts for stays of 30+ nights to attract the 24% of the market seeking extended stays.
- Adjust minimum nights based on seasonality – potentially shorter during low season and longer during peak demand periods in Hansville.
Hansville Airbnb Cancellation Policy Trends Analysis (2026)
Super Strict 30 Days
2 listings
8% of total
Flexible
1 listings
4% of total
Moderate
11 listings
44% of total
Firm
7 listings
28% of total
Strict
4 listings
16% of total
Cancellation Policy Insights for Hansville
- The prevailing Airbnb cancellation policy trend in Hansville is Moderate, used by 44% of listings.
- There's a relatively balanced mix between guest-friendly (48.0%) and stricter (44.0%) policies, offering choices for different guest needs.
Recommendations for Hosts
- Consider adopting a Moderate policy to align with the 44% market standard in Hansville.
- Regularly review your cancellation policy against competitors and market demand shifts in Hansville.
Hansville STR Booking Lead Time Analysis (2026)
Average Booking Lead Time by Month
Booking Lead Time Insights for Hansville
- The overall average booking lead time for vacation rentals in Hansville is 42 days.
- Guests book furthest in advance for stays during July (average 82 days), likely coinciding with peak travel demand or local events.
- The shortest booking windows occur for stays in March (average 17 days), indicating more last-minute travel plans during this time.
- Seasonally, Summer (68 days avg.) sees the longest lead times, while Winter (29 days avg.) has the shortest, reflecting typical travel planning cycles.
Recommendations for Hosts
- Use the overall average lead time (42 days) as a baseline for your pricing and availability strategy in Hansville.
- For July stays, consider implementing length-of-stay discounts or slightly higher rates for bookings made less than 82 days out to capitalize on advance planning.
- Target marketing efforts for the Summer season well in advance (at least 68 days) to capture early planners.
- Monitor your own booking lead times against these Hansville averages to identify opportunities for dynamic pricing adjustments.
Popular & Essential Airbnb Amenities in Hansville (2026)
Amenity Prevalence
No amenities with partial availability (less than 100%) were found to display in the chart. All essential amenities might be present in all listings. Check insights below.
Amenity Insights for Hansville
- Essential amenities in Hansville that guests expect include: Wifi, Dishes and silverware, Coffee maker, Free parking on premises, Smoke alarm, Hangers, Hair dryer, Hot water, Carbon monoxide alarm, Bed linens. Lacking these (any) could significantly impact bookings.
Recommendations for Hosts
- Ensure your listing includes all essential amenities for Hansville: Wifi, Dishes and silverware, Coffee maker, Free parking on premises, Smoke alarm, Hangers, Hair dryer, Hot water, Carbon monoxide alarm, Bed linens.
- Highlight unique or less common amenities you offer (e.g., hot tub, dedicated workspace, EV charger) in your listing description and photos.
- Regularly check competitor amenities in Hansville to stay competitive.
Hansville Airbnb Guest Demographics & Profile Analysis (2026)
Guest Profile Summary for Hansville
- The typical guest profile for Airbnb in Hansville consists of primarily domestic travelers (97%), often arriving from nearby Seattle, typically belonging to the Post-2000s (Gen Z/Alpha) group (50%), primarily speaking English or French.
- Domestic travelers account for 97.0% of guests.
- Key international markets include United States (97%) and Germany (0.9%).
- Top languages spoken are English (72.2%) followed by French (8.3%).
- A significant demographic segment is the Post-2000s (Gen Z/Alpha) group, representing 50% of guests.
Recommendations for Hosts
- Target domestic marketing efforts towards travelers from Seattle and Portland.
- Tailor amenities and listing descriptions to appeal to the dominant Post-2000s (Gen Z/Alpha) demographic (e.g., highlight fast WiFi, smart home features, local guides).
- Highlight unique local experiences or amenities relevant to the primary guest profile.
- Consider seasonal promotions aligned with peak travel times for key origin markets.
Nearby Short-Term Rental Market Comparison
How does the Hansville Airbnb market stack up against its neighbors? Compare key performance metrics like average monthly revenue, ADR, and occupancy rates in surrounding areas to understand the broader regional STR landscape.
| Market | Active Properties | Monthly Revenue | Daily Rate | Avg. Occupancy |
|---|---|---|---|---|
| Erlands Point-Kitsap Lake | 12 | $5,285 | $366.41 | 47% |
| North Bend | 51 | $5,073 | $352.89 | 57% |
| Olalla | 13 | $4,868 | $334.79 | 49% |
| Sudden Valley | 63 | $4,821 | $324.44 | 51% |
| Warm Beach | 10 | $4,811 | $319.50 | 43% |
| Verlot | 11 | $4,608 | $314.03 | 49% |
| Canyon Creek | 13 | $4,568 | $301.22 | 51% |
| Ronald | 153 | $4,567 | $456.22 | 35% |
| Sultan | 17 | $4,436 | $300.44 | 51% |
| Woodinville | 35 | $4,409 | $340.44 | 51% |