Manchester Airbnb Market Analysis 2025: Short Term Rental Data & Vacation Rental Statistics in Washington, United States
Is Airbnb profitable in Manchester in 2025? Explore comprehensive Airbnb analytics for Manchester, Washington, United States to uncover income potential. This 2025 STR market report for Manchester, based on AirROI data from August 2024 to July 2025, reveals key trends in the niche market of 19 active listings.
Whether you're considering an Airbnb investment in Manchester, optimizing your existing vacation rental, or exploring rental arbitrage opportunities, understanding the Manchester Airbnb data is crucial. Leveraging the low regulation environment is key to maximizing your short term rental income potential. Let's dive into the specifics.
Key Manchester Airbnb Performance Metrics Overview
Monthly Airbnb Revenue Variations & Income Potential in Manchester (2025)
Understanding the monthly revenue variations for Airbnb listings in Manchester is key to maximizing your short term rental income potential. Seasonality significantly impacts earnings. Our analysis, based on data from the past 12 months, shows that the peak revenue month for STRs in Manchester is typically August, while January often presents the lowest earnings, highlighting opportunities for strategic pricing adjustments during shoulder and low seasons. Explore the typical Airbnb income in Manchester across different performance tiers:
- Best-in-class properties (Top 10%) achieve $7,274+ monthly, often utilizing dynamic pricing and superior guest experiences.
- Strong performing properties (Top 25%) earn $5,598 or more, indicating effective management and desirable locations/amenities.
- Typical properties (Median) generate around $2,805 per month, representing the average market performance.
- Entry-level properties (Bottom 25%) see earnings around $1,799, often with potential for optimization.
Average Monthly Airbnb Earnings Trend in Manchester
Manchester Airbnb Occupancy Rate Trends (2025)
Maximize your bookings by understanding the Manchester STR occupancy trends. Seasonal demand shifts significantly influence how often properties are booked. Typically, Augustsees the highest demand (peak season occupancy), while January experiences the lowest (low season). Effective strategies, like adjusting minimum stays or offering promotions, can boost occupancy during slower periods. Here's how different property tiers perform in Manchester:
- Best-in-class properties (Top 10%) achieve 78%+ occupancy, indicating high desirability and potentially optimized availability.
- Strong performing properties (Top 25%) maintain 69% or higher occupancy, suggesting good market fit and guest satisfaction.
- Typical properties (Median) have an occupancy rate around 52%.
- Entry-level properties (Bottom 25%) average 32% occupancy, potentially facing higher vacancy.
Average Monthly Occupancy Rate Trend in Manchester
Average Daily Rate (ADR) Airbnb Trends in Manchester (2025)
Effective short term rental pricing strategy in Manchester involves understanding monthly ADR fluctuations. The Average Daily Rate (ADR) for Airbnb in Manchester typically peaks in August and dips lowest during March. Leveraging Airbnb dynamic pricing tools or strategies based on this seasonality can significantly boost revenue. Here's a look at the typical nightly rates achieved:
- Best-in-class properties (Top 10%) command rates of $452+ per night, often due to premium features or locations.
- Strong performing properties (Top 25%) achieve nightly rates of $315 or more.
- Typical properties (Median) charge around $210 per night.
- Entry-level properties (Bottom 25%) earn around $132 per night.
Average Daily Rate (ADR) Trend by Month in Manchester
Get Live Manchester Market Intelligence 👇

Explore Real-time Analytics
Airbnb Seasonality Analysis & Trends in Manchester (2025)
Peak Season (August, June, July)
- Revenue averages $6,079 per month
- Occupancy rates average 61.7%
- Daily rates average $277
Shoulder Season
- Revenue averages $3,722 per month
- Occupancy maintains around 52.8%
- Daily rates hold near $241
Low Season (January, February, December)
- Revenue drops to average $2,308 per month
- Occupancy decreases to average 37.8%
- Daily rates adjust to average $245
Seasonality Insights for Manchester
- The Airbnb seasonality in Manchester shows highly seasonal trends requiring careful strategy. While the sections above show seasonal averages, it's also insightful to look at the extremes:
- During the high season, the absolute peak month showcases Manchester's highest earning potential, with monthly revenues capable of climbing to $6,176, occupancy reaching a high of 73.3%, and ADRs peaking at $287.
- Conversely, the slowest single month of the year, typically falling within the low season, marks the market's lowest point. In this month, revenue might dip to $1,822, occupancy could drop to 29.8%, and ADRs may adjust down to $214.
- Understanding both the seasonal averages and these monthly peaks and troughs in revenue, occupancy, and ADR is crucial for maximizing your Airbnb profit potential in Manchester.
Seasonal Strategies for Maximizing Profit
- Peak Season: Maximize revenue through premium pricing and potentially longer minimum stays. Ensure high availability.
- Low Season: Offer competitive pricing, special promotions (e.g., extended stay discounts), and flexible cancellation policies. Target off-season travelers like remote workers or budget-conscious guests.
- Shoulder Seasons: Implement dynamic pricing that balances peak and low rates. Target weekend travelers or specific events. Offer slightly more flexible terms than peak season.
- Regularly analyze your own performance against these Manchester seasonality benchmarks and adjust your pricing and availability strategy accordingly.
Best Areas for Airbnb Investment in Manchester (2025)
Exploring the top neighborhoods for short-term rentals in Manchester? This section highlights key areas, outlining why they are attractive for hosts and guests, along with notable local attractions. Consider these locations based on your target guest profile and investment strategy.
| Neighborhood / Area | Why Host Here? (Target Guests & Appeal) | Key Attractions & Landmarks |
|---|---|---|
| Downtown Manchester | The heart of the city, featuring a mix of culture, shopping, and dining options. Ideal for tourists wanting to explore historic sites and vibrant nightlife. | Manchester Art Gallery, Northern Quarter, The Bridgewater Hall, Manchester Cathedral, Market Street |
| Northern Quarter | A trendy, bohemian area with independent shops, bars, and restaurants. Popular with younger travelers and creatives looking for a unique, vibrant atmosphere. | Afflecks Palace, Craft Beer Bars, Street Art, Live Music Venues, Vintage Shops |
| Salford Quays | A waterfront area with cultural attractions, restaurants, and modern apartments. Attracts visitors to the nearby MediaCityUK and the Lowry arts centre. | The Lowry, Salford Museum and Art Gallery, MediaCityUK, Imperial War Museum North, Restaurants along The Quays |
| Chorlton | A vibrant suburb known for its independent cafes, shops, and a strong community feel. Attracts families and young professionals seeking a laid-back lifestyle. | Chorlton Green, Beaches Road, The Horse and Jockey Pub, Independent Shops, Chorlton Bookshop |
| Didsbury | A picturesque suburb with a charming village atmosphere, known for its parks and excellent restaurants. Popular with families and those seeking a quieter neighborhood. | Didsbury Park, Parsonage Gardens, Tea Rooms, Local Pubs, Didsbury Village |
| Etihad Campus | Home to Manchester City Football Club, this area attracts sports enthusiasts and families visiting during match days or events. | Etihad Stadium, City Football Academy, National Cycling Centre, Velopark, Etihad Campus |
| Castlefield | A historic area featuring picturesque canals and stunning urban architecture. Great for weekend breaks with lots of outdoor activities and restaurants. | Castlefield Bowl, Roman Fort, Canal Walks, Museum of Science and Industry, Bars and Restaurants by the canal |
| Fallowfield | A diverse, student-populated area with affordable housing and a lively social scene. Ideal for short-term rentals targeting students and young travelers. | Fallowfield Loop, Parks, Local Cafes and Bars, Student Events, Fallowfield Market |
Understanding Airbnb License Requirements & STR Laws in Manchester (2025)
While Manchester, Washington, United States currently shows low STR regulations, specific Airbnb license requirements might still exist or change. Always verify the latest short term rental regulations and Airbnb license requirements directly with local government authorities for Manchester to ensure full compliance before hosting.
(Source: AirROI data, 2025, finding no licensed listings among those analyzed)
Top Performing Airbnb Properties in Manchester (2025)
Benchmark your potential! Explore examples of top-performing Airbnb properties in Manchesterbased on Trailing Twelve Month (TTM) revenue. Analyze their characteristics, revenue, occupancy rate, and ADR to understand what drives success in this market.

Stunning beachfront getaway!
Entire Place • 5 bedrooms
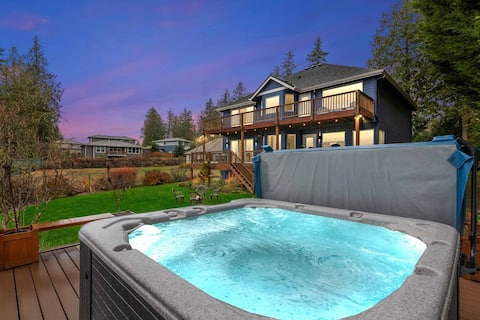
Puget Sound Retreat - 4 Bedroom Home w/ Hot Tub
Entire Place • 4 bedrooms

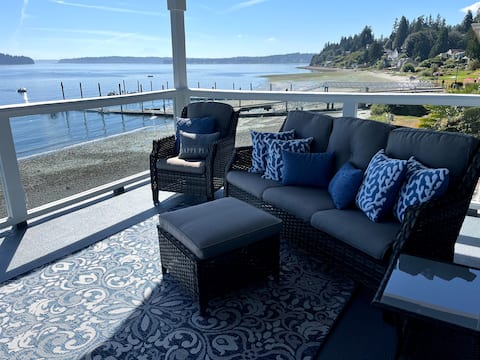
The Landing - Waterviews, Beach Access, & Hot Tub
Entire Place • 4 bedrooms
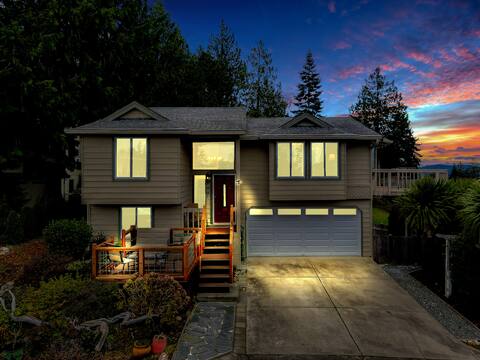
Manchester House-Cottage on the Puget Sound
Entire Place • 3 bedrooms
SOUND VIEWS
Entire Place • 3 bedrooms
Waterfront! VIEWS! 1360 sq ft 2 bed, 2 bath.
Entire Place • 2 bedrooms
Note: Performance varies based on location, size, amenities, seasonality, and management quality. Data reflects the past 12 months.
Top Performing Airbnb Hosts in Manchester (2025)
Learn from the best! This table showcases top-performing Airbnb hosts in Manchester based on the number of properties managed and estimated total revenue over the past year. Analyze their scale and performance metrics.
| Host Name | Properties | Grossing Revenue | Stay Reviews | Avg Rating |
|---|---|---|---|---|
| Melissa | 2 | $158,678 | 235 | 4.96/5.0 |
| William | 1 | $126,482 | 161 | 4.96/5.0 |
| Julie | 1 | $70,086 | 43 | 5.00/5.0 |
| Beverly | 1 | $43,048 | 92 | 5.00/5.0 |
| Luke And Tiffany | 1 | $40,859 | 48 | 4.96/5.0 |
| Don | 1 | $22,918 | 32 | 4.94/5.0 |
| Brian | 1 | $22,700 | 81 | 4.98/5.0 |
| Mike & Joyce | 2 | $21,217 | 308 | 4.72/5.0 |
| Evolve | 1 | $20,810 | 23 | 4.78/5.0 |
| Aaron | 2 | $20,369 | 44 | 5.00/5.0 |
Analyzing the strategies of top hosts, such as their property selection, pricing, and guest communication, can offer valuable lessons for optimizing your own Airbnb operations in Manchester.
Dive Deeper: Advanced Manchester STR Market Data (2025)
Ready to unlock more insights? AirROI provides access to advanced metrics and comprehensive Airbnb data for Manchester. Explore detailed analytics beyond this report to refine your investment strategy, optimize pricing, and maximize your vacation rental profits.
Explore Advanced MetricsManchester Short-Term Rental Market Composition (2025): Property & Room Types
Room Type Distribution
Property Type Distribution
Market Composition Insights for Manchester
- The Manchester Airbnb market composition is heavily skewed towards Entire Home/Apt listings, which make up 100% of the 19 active rentals. This indicates strong guest preference for privacy and space.
- Looking at the property type distribution in Manchester, House properties are the most common (57.9%), reflecting the local real estate landscape.
- Houses represent a significant 57.9% portion, catering likely to families or larger groups.
- The presence of 26.3% Hotel/Boutique listings indicates integration with traditional hospitality.
Manchester Airbnb Room Capacity Analysis (2025): Bedroom Distribution
Distribution of Listings by Number of Bedrooms
Room Capacity Insights for Manchester
- The dominant room capacity in Manchester is 4 bedrooms listings, making up 21.1% of the market. This suggests a strong demand for properties suitable for families or small groups.
- Together, 4 bedrooms and 1 bedroom properties represent 42.2% of the active Airbnb listings in Manchester, indicating a high concentration in these sizes.
- A significant 42.2% of listings offer 3+ bedrooms, catering to larger groups and families seeking more space in Manchester.
Manchester Vacation Rental Guest Capacity Trends (2025)
Distribution of Listings by Guest Capacity
Guest Capacity Insights for Manchester
- The most common guest capacity trend in Manchester vacation rentals is listings accommodating 8+ guests (31.6%). This suggests the primary traveler segment is likely larger groups.
- Properties designed for 8+ guests and 4 guests dominate the Manchester STR market, accounting for 57.9% of listings.
- 47.4% of properties accommodate 6+ guests, serving the market segment for larger families or group travel in Manchester.
- On average, properties in Manchester are equipped to host 5.1 guests.
Manchester Airbnb Booking Patterns (2025): Available vs. Booked Days
Available Days Distribution
Booked Days Distribution
Booking Pattern Insights for Manchester
- The most common availability pattern in Manchester falls within the 271-366 days range, representing 42.1% of listings. This suggests many properties have significant open periods on their calendars.
- Approximately 68.4% of listings show high availability (181+ days open annually), indicating potential for increased bookings or specific owner usage patterns.
- For booked days, the 31-90 days range is most frequent in Manchester (26.3%), reflecting common guest stay durations or potential owner blocking patterns.
- A notable 31.6% of properties secure long booking periods (181+ days booked per year), highlighting successful long-term rental strategies or significant owner usage.
Manchester Airbnb Minimum Stay Requirements Analysis
Distribution of Listings by Minimum Night Requirement
1 Night
3 listings
16.7% of total
2 Nights
7 listings
38.9% of total
3 Nights
1 listings
5.6% of total
4-6 Nights
1 listings
5.6% of total
30+ Nights
6 listings
33.3% of total
Key Insights
- The most prevalent minimum stay requirement in Manchester is 2 Nights, adopted by 38.9% of listings. This highlights the market's preference for shorter, flexible bookings.
- A significant segment (33.3%) caters to monthly stays (30+ nights) in Manchester, pointing to opportunities in the extended-stay market.
Recommendations
- Align with the market by considering a 2 Nights minimum stay, as 38.9% of Manchester hosts use this setting.
- If feasible, allowing 1-night stays, especially midweek or during low season, could capture last-minute bookings, as only 16.7% currently do.
- A 2-night minimum appears standard (38.9%). Consider this for weekends or peak periods.
- Explore offering discounts for stays of 30+ nights to attract the 33.3% of the market seeking extended stays.
- Adjust minimum nights based on seasonality – potentially shorter during low season and longer during peak demand periods in Manchester.
Manchester Airbnb Cancellation Policy Trends Analysis (2025)
Flexible
6 listings
31.6% of total
Moderate
5 listings
26.3% of total
Firm
4 listings
21.1% of total
Strict
4 listings
21.1% of total
Cancellation Policy Insights for Manchester
- The prevailing Airbnb cancellation policy trend in Manchester is Flexible, used by 31.6% of listings.
- There's a relatively balanced mix between guest-friendly (57.9%) and stricter (42.2%) policies, offering choices for different guest needs.
Recommendations for Hosts
- Consider adopting a Flexible policy to align with the 31.6% market standard in Manchester.
- Regularly review your cancellation policy against competitors and market demand shifts in Manchester.
Manchester STR Booking Lead Time Analysis (2025)
Average Booking Lead Time by Month
Booking Lead Time Insights for Manchester
- The overall average booking lead time for vacation rentals in Manchester is 36 days.
- Guests book furthest in advance for stays during June (average 67 days), likely coinciding with peak travel demand or local events.
- The shortest booking windows occur for stays in April (average 17 days), indicating more last-minute travel plans during this time.
- Seasonally, Summer (61 days avg.) sees the longest lead times, while Spring (23 days avg.) has the shortest, reflecting typical travel planning cycles.
Recommendations for Hosts
- Use the overall average lead time (36 days) as a baseline for your pricing and availability strategy in Manchester.
- For June stays, consider implementing length-of-stay discounts or slightly higher rates for bookings made less than 67 days out to capitalize on advance planning.
- Target marketing efforts for the Summer season well in advance (at least 61 days) to capture early planners.
- Monitor your own booking lead times against these Manchester averages to identify opportunities for dynamic pricing adjustments.
Popular & Essential Airbnb Amenities in Manchester (2025)
Amenity Prevalence
Amenity Insights for Manchester
- Essential amenities in Manchester that guests expect include: Wifi, Smoke alarm, Carbon monoxide alarm, Heating, TV, Free parking on premises. Lacking these (any) could significantly impact bookings.
- Popular amenities like Hangers, Microwave, Patio or balcony are common but not universal. Offering these can provide a competitive edge.
Recommendations for Hosts
- Ensure your listing includes all essential amenities for Manchester: Wifi, Smoke alarm, Carbon monoxide alarm, Heating, TV, Free parking on premises.
- Consider adding popular differentiators like Hangers or Microwave to increase appeal.
- Highlight unique or less common amenities you offer (e.g., hot tub, dedicated workspace, EV charger) in your listing description and photos.
- Regularly check competitor amenities in Manchester to stay competitive.
Manchester Airbnb Guest Demographics & Profile Analysis (2025)
Guest Profile Summary for Manchester
- The typical guest profile for Airbnb in Manchester consists of primarily domestic travelers (96%), often arriving from nearby Seattle, typically belonging to the Post-2000s (Gen Z/Alpha) group (50%), primarily speaking English or Spanish.
- Domestic travelers account for 95.9% of guests.
- Key international markets include United States (95.9%) and Germany (1%).
- Top languages spoken are English (75.6%) followed by Spanish (12.8%).
- A significant demographic segment is the Post-2000s (Gen Z/Alpha) group, representing 50% of guests.
Recommendations for Hosts
- Target domestic marketing efforts towards travelers from Seattle and Port Orchard.
- Tailor amenities and listing descriptions to appeal to the dominant Post-2000s (Gen Z/Alpha) demographic (e.g., highlight fast WiFi, smart home features, local guides).
- Highlight unique local experiences or amenities relevant to the primary guest profile.
- Consider seasonal promotions aligned with peak travel times for key origin markets.
Nearby Short-Term Rental Market Comparison
How does the Manchester Airbnb market stack up against its neighbors? Compare key performance metrics like average monthly revenue, ADR, and occupancy rates in surrounding areas to understand the broader regional STR landscape.
| Market | Active Properties | Monthly Revenue | Daily Rate | Avg. Occupancy |
|---|---|---|---|---|
| Erlands Point-Kitsap Lake | 13 | $5,134 | $339.05 | 48% |
| North Bend | 51 | $4,832 | $332.36 | 60% |
| Canyon Creek | 13 | $4,477 | $275.47 | 52% |
| Olalla | 14 | $4,314 | $303.84 | 54% |
| Index | 19 | $4,299 | $283.31 | 50% |
| Ronald | 158 | $4,295 | $417.05 | 37% |
| Sudden Valley | 65 | $4,253 | $304.52 | 51% |
| Easton | 36 | $4,245 | $415.14 | 36% |
| Allyn | 21 | $4,168 | $403.06 | 35% |
| Woodinville | 34 | $4,001 | $311.78 | 52% |