Montesano Airbnb Market Analysis 2025: Short Term Rental Data & Vacation Rental Statistics in Washington, United States
Is Airbnb profitable in Montesano in 2025? Explore comprehensive Airbnb analytics for Montesano, Washington, United States to uncover income potential. This 2025 STR market report for Montesano, based on AirROI data from June 2024 to May 2025, reveals key trends in the niche market of 19 active listings.
Whether you're considering an Airbnb investment in Montesano, optimizing your existing vacation rental, or exploring rental arbitrage opportunities, understanding the Montesano Airbnb data is crucial. Leveraging the low regulation environment is key to maximizing your short term rental income potential. Let's dive into the specifics.
Key Montesano Airbnb Performance Metrics Overview
Monthly Airbnb Revenue Variations & Income Potential in Montesano (2025)
Understanding the monthly revenue variations for Airbnb listings in Montesano is key to maximizing your short term rental income potential. Seasonality significantly impacts earnings. Our analysis, based on data from the past 12 months, shows that the peak revenue month for STRs in Montesano is typically June, while February often presents the lowest earnings, highlighting opportunities for strategic pricing adjustments during shoulder and low seasons. Explore the typical Airbnb income in Montesano across different performance tiers:
- Best-in-class properties (Top 10%) achieve $3,231+ monthly, often utilizing dynamic pricing and superior guest experiences.
- Strong performing properties (Top 25%) earn $2,223 or more, indicating effective management and desirable locations/amenities.
- Typical properties (Median) generate around $1,152 per month, representing the average market performance.
- Entry-level properties (Bottom 25%) see earnings around $813, often with potential for optimization.
Average Monthly Airbnb Earnings Trend in Montesano
Montesano Airbnb Occupancy Rate Trends (2025)
Maximize your bookings by understanding the Montesano STR occupancy trends. Seasonal demand shifts significantly influence how often properties are booked. Typically, Junesees the highest demand (peak season occupancy), while April experiences the lowest (low season). Effective strategies, like adjusting minimum stays or offering promotions, can boost occupancy during slower periods. Here's how different property tiers perform in Montesano:
- Best-in-class properties (Top 10%) achieve 65%+ occupancy, indicating high desirability and potentially optimized availability.
- Strong performing properties (Top 25%) maintain 49% or higher occupancy, suggesting good market fit and guest satisfaction.
- Typical properties (Median) have an occupancy rate around 27%.
- Entry-level properties (Bottom 25%) average 18% occupancy, potentially facing higher vacancy.
Average Monthly Occupancy Rate Trend in Montesano
Average Daily Rate (ADR) Airbnb Trends in Montesano (2025)
Effective short term rental pricing strategy in Montesano involves understanding monthly ADR fluctuations. The Average Daily Rate (ADR) for Airbnb in Montesano typically peaks in May and dips lowest during January. Leveraging Airbnb dynamic pricing tools or strategies based on this seasonality can significantly boost revenue. Here's a look at the typical nightly rates achieved:
- Best-in-class properties (Top 10%) command rates of $192+ per night, often due to premium features or locations.
- Strong performing properties (Top 25%) achieve nightly rates of $179 or more.
- Typical properties (Median) charge around $163 per night.
- Entry-level properties (Bottom 25%) earn around $137 per night.
Average Daily Rate (ADR) Trend by Month in Montesano
Get Live Montesano Market Intelligence 👇

Explore Real-time Analytics
Airbnb Seasonality Analysis & Trends in Montesano (2025)
Peak Season (June, August, July)
- Revenue averages $2,737 per month
- Occupancy rates average 53.9%
- Daily rates average $164
Shoulder Season
- Revenue averages $1,388 per month
- Occupancy maintains around 33.3%
- Daily rates hold near $168
Low Season (January, February, April)
- Revenue drops to average $884 per month
- Occupancy decreases to average 19.8%
- Daily rates adjust to average $159
Seasonality Insights for Montesano
- The Airbnb seasonality in Montesano shows highly seasonal trends requiring careful strategy. While the sections above show seasonal averages, it's also insightful to look at the extremes:
- During the high season, the absolute peak month showcases Montesano's highest earning potential, with monthly revenues capable of climbing to $3,031, occupancy reaching a high of 55.6%, and ADRs peaking at $190.
- Conversely, the slowest single month of the year, typically falling within the low season, marks the market's lowest point. In this month, revenue might dip to $821, occupancy could drop to 19.6%, and ADRs may adjust down to $149.
- Understanding both the seasonal averages and these monthly peaks and troughs in revenue, occupancy, and ADR is crucial for maximizing your Airbnb profit potential in Montesano.
Seasonal Strategies for Maximizing Profit
- Peak Season: Maximize revenue through premium pricing and potentially longer minimum stays. Ensure high availability.
- Low Season: Offer competitive pricing, special promotions (e.g., extended stay discounts), and flexible cancellation policies. Target off-season travelers like remote workers or budget-conscious guests.
- Shoulder Seasons: Implement dynamic pricing that balances peak and low rates. Target weekend travelers or specific events. Offer slightly more flexible terms than peak season.
- Regularly analyze your own performance against these Montesano seasonality benchmarks and adjust your pricing and availability strategy accordingly.
Best Areas for Airbnb Investment in Montesano (2025)
Exploring the top neighborhoods for short-term rentals in Montesano? This section highlights key areas, outlining why they are attractive for hosts and guests, along with notable local attractions. Consider these locations based on your target guest profile and investment strategy.
| Neighborhood / Area | Why Host Here? (Target Guests & Appeal) | Key Attractions & Landmarks |
|---|---|---|
| Downtown Montesano | The heart of Montesano, featuring restaurants, shops, and community events. Ideal for guests wanting to experience local culture and amenities. | Montesano City Park, Grays Harbor Historical Seaport, local dining options, art galleries, Montesano Historical Museum |
| Lake Sylvia State Park | A beautiful natural area with camping, hiking, and fishing opportunities. Appeals to nature enthusiasts and families looking for outdoor fun. | Lake Sylvia, hiking trails, picnic areas, fishing spots, wildlife viewing |
| Chehalis River | Scenic river region great for fishing and kayaking, attracting outdoor adventurers and those looking for a peaceful getaway. | Chehalis River access, kayaking, fishing, hiking trails, picnic spots |
| Grays Harbor County Fairgrounds | Hosts the annual Grays Harbor County Fair and numerous events throughout the year, making it a lively spot for visitors. | County Fair, local events, swap meets, concerts, exhibitions |
| Montesano Golf Club | A well-maintained golf course offering a relaxing yet enjoyable stay for golf enthusiasts and visitors looking for leisure activities. | golfing, clubhouse, scenic views, community events, food and drinks |
| Satsop Business Park | A unique location offering various attractions and activities, including tours and events related to the former nuclear facility. | tours of the facility, local businesses, community activities, events space, outdoor recreational areas |
| Upper Chehalis River Valley | A stunning valley known for its agriculture and natural beauty, perfect for those who want a rural retreat. | scenic drives, local farms, hiking paths, biking trails, agritourism opportunities |
| Local Wineries and Breweries | A growing area with local wineries and breweries attracting tourists seeking tastings and tours, ideal for wine lovers and beer enthusiasts. | wine tastings, brewery tours, vineyards, craft beer events, scenic views |
Understanding Airbnb License Requirements & STR Laws in Montesano (2025)
While Montesano, Washington, United States currently shows low STR regulations, specific Airbnb license requirements might still exist or change. Always verify the latest short term rental regulations and Airbnb license requirements directly with local government authorities for Montesano to ensure full compliance before hosting.
(Source: AirROI data, 2025, finding no licensed listings among those analyzed)
Top Performing Airbnb Properties in Montesano (2025)
Benchmark your potential! Explore examples of top-performing Airbnb properties in Montesanobased on Trailing Twelve Month (TTM) revenue. Analyze their characteristics, revenue, occupancy rate, and ADR to understand what drives success in this market.
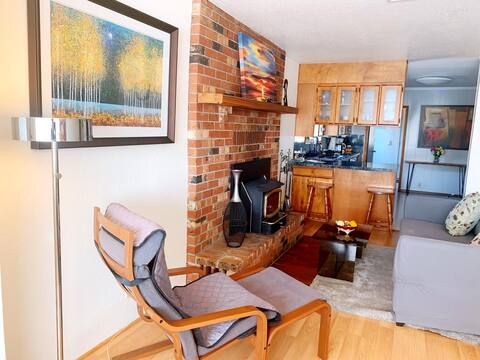
Small town charm on the Olympic Peninsula.
Entire Place • 2 bedrooms
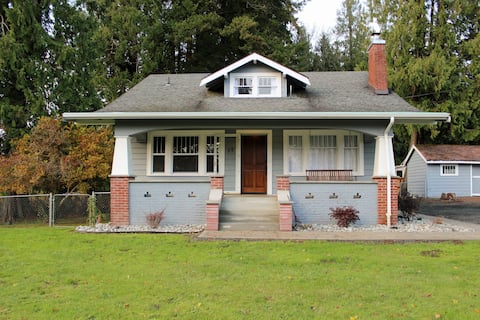
Remodeled 100yr old 3 Bed Craftsman on 1 acre
Entire Place • 3 bedrooms
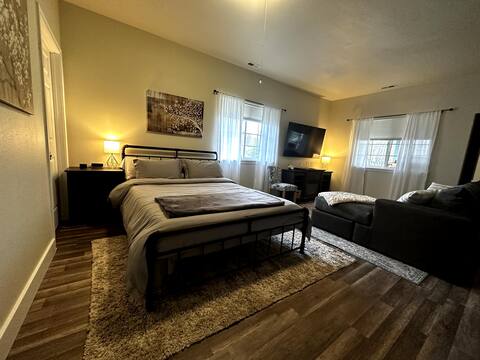
Sonia’s Guest Suite in Montesano
Entire Place • 1 bedroom
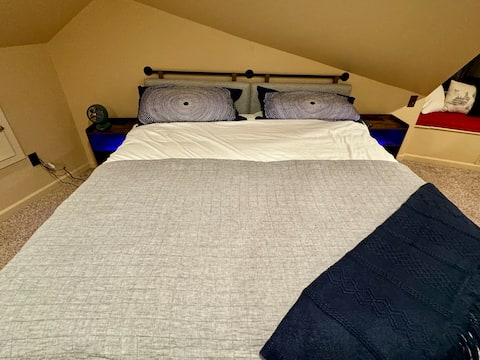
The Attic
Private Room • 1 bedroom
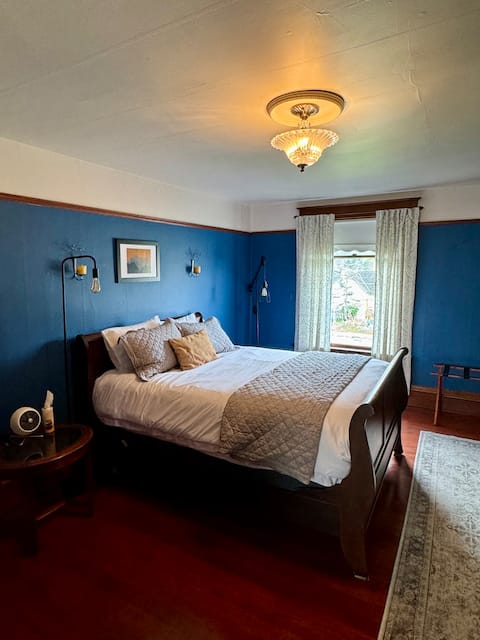
The Blue Birch
Private Room • 1 bedroom
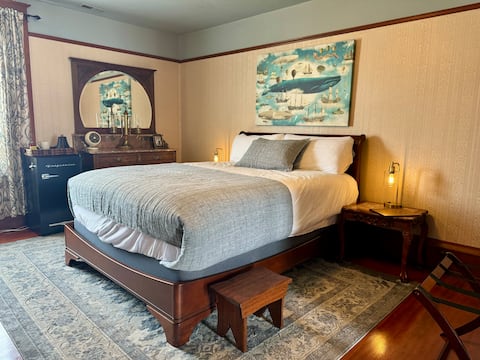
Hubble House Inn - Oceania Queen
Private Room • N/A
Note: Performance varies based on location, size, amenities, seasonality, and management quality. Data reflects the past 12 months.
Top Performing Airbnb Hosts in Montesano (2025)
Learn from the best! This table showcases top-performing Airbnb hosts in Montesano based on the number of properties managed and estimated total revenue over the past year. Analyze their scale and performance metrics.
| Host Name | Properties | Grossing Revenue | Stay Reviews | Avg Rating |
|---|---|---|---|---|
| Host #38701691 | 4 | $50,582 | 0 | N/A/5.0 |
| Skip | 1 | $37,208 | 262 | 4.95/5.0 |
| Jason | 1 | $28,696 | 45 | 4.93/5.0 |
| Sonia | 1 | $28,260 | 179 | 4.96/5.0 |
| Host #502000472 | 11 | $25,099 | 7 | N/A/5.0 |
| Laryssa | 1 | $9,609 | 63 | 4.92/5.0 |
Analyzing the strategies of top hosts, such as their property selection, pricing, and guest communication, can offer valuable lessons for optimizing your own Airbnb operations in Montesano.
Dive Deeper: Advanced Montesano STR Market Data (2025)
Ready to unlock more insights? AirROI provides access to advanced metrics and comprehensive Airbnb data for Montesano. Explore detailed analytics beyond this report to refine your investment strategy, optimize pricing, and maximize your vacation rental profits.
Explore Advanced MetricsMontesano Short-Term Rental Market Composition (2025): Property & Room Types
Room Type Distribution
Property Type Distribution
Market Composition Insights for Montesano
- The Montesano Airbnb market composition is heavily skewed towards Hotel Room listings, which make up 57.9% of the 19 active rentals. This indicates strong guest preference for privacy and space.
- Looking at the property type distribution in Montesano, Hotel/Boutique properties are the most common (78.9%), reflecting the local real estate landscape.
- Houses represent a significant 15.8% portion, catering likely to families or larger groups.
- The presence of 78.9% Hotel/Boutique listings indicates integration with traditional hospitality.
Montesano Airbnb Room Capacity Analysis (2025): Bedroom Distribution
Distribution of Listings by Number of Bedrooms
Room Capacity Insights for Montesano
- The dominant room capacity in Montesano is 1 bedroom listings, making up 84.2% of the market. This suggests a strong demand for properties suitable for couples or solo travelers.
- Together, 1 bedroom and 3 bedrooms properties represent 89.5% of the active Airbnb listings in Montesano, indicating a high concentration in these sizes.
- With over half the market (84.2%) consisting of studios or 1-bedroom units, Montesano is particularly well-suited for individuals or couples.
- Listings with 3+ bedrooms (5.3%) represent a smaller niche, potentially indicating an underserved market for larger group accommodations in Montesano.
Montesano Vacation Rental Guest Capacity Trends (2025)
Distribution of Listings by Guest Capacity
Guest Capacity Insights for Montesano
- The most common guest capacity trend in Montesano vacation rentals is listings accommodating 2 guests (52.6%). This suggests the primary traveler segment is likely couples or solo travelers.
- Properties designed for 2 guests and 4 guests dominate the Montesano STR market, accounting for 68.4% of listings.
- A significant 52.6% of listings cater specifically to 1-2 guests, highlighting strong demand from couples and solo travelers in Montesano.
- 10.5% of properties accommodate 6+ guests, serving the market segment for larger families or group travel in Montesano.
- On average, properties in Montesano are equipped to host 3.0 guests.
Montesano Airbnb Booking Patterns (2025): Available vs. Booked Days
Available Days Distribution
Booked Days Distribution
Booking Pattern Insights for Montesano
- The most common availability pattern in Montesano falls within the 271-366 days range, representing 78.9% of listings. This suggests many properties have significant open periods on their calendars.
- Approximately 84.2% of listings show high availability (181+ days open annually), indicating potential for increased bookings or specific owner usage patterns.
- For booked days, the 1-30 days range is most frequent in Montesano (57.9%), reflecting common guest stay durations or potential owner blocking patterns.
- A notable 15.8% of properties secure long booking periods (181+ days booked per year), highlighting successful long-term rental strategies or significant owner usage.
Montesano Airbnb Minimum Stay Requirements Analysis
Distribution of Listings by Minimum Night Requirement
1 Night
18 listings
94.7% of total
3 Nights
1 listings
5.3% of total
Key Insights
- The most prevalent minimum stay requirement in Montesano is 1 Night, adopted by 94.7% of listings. This highlights the market's preference for shorter, flexible bookings.
- A strong majority (94.7%) of the Montesano Airbnb data shows acceptance of very short stays (1-2 nights), indicating a dynamic, high-turnover market.
Recommendations
- Align with the market by considering a 1 Night minimum stay, as 94.7% of Montesano hosts use this setting.
- Adjust minimum nights based on seasonality – potentially shorter during low season and longer during peak demand periods in Montesano.
Montesano Airbnb Cancellation Policy Trends Analysis (2025)
Flexible
1 listings
6.7% of total
Moderate
14 listings
93.3% of total
Cancellation Policy Insights for Montesano
- The prevailing Airbnb cancellation policy trend in Montesano is Moderate, used by 93.3% of listings.
- The market strongly favors guest-friendly terms, with 100.0% of listings offering Flexible or Moderate policies. This suggests guests in Montesano may expect booking flexibility.
Recommendations for Hosts
- Consider adopting a Moderate policy to align with the 93.3% market standard in Montesano.
- Regularly review your cancellation policy against competitors and market demand shifts in Montesano.
Montesano STR Booking Lead Time Analysis (2025)
Average Booking Lead Time by Month
Booking Lead Time Insights for Montesano
- The overall average booking lead time for vacation rentals in Montesano is 22 days.
- Guests book furthest in advance for stays during May (average 79 days), likely coinciding with peak travel demand or local events.
- The shortest booking windows occur for stays in March (average 12 days), indicating more last-minute travel plans during this time.
- Seasonally, Spring (42 days avg.) sees the longest lead times, while Winter (19 days avg.) has the shortest, reflecting typical travel planning cycles.
Recommendations for Hosts
- Use the overall average lead time (22 days) as a baseline for your pricing and availability strategy in Montesano.
- For May stays, consider implementing length-of-stay discounts or slightly higher rates for bookings made less than 79 days out to capitalize on advance planning.
- During March, focus on last-minute booking availability and promotions, as guests book with very short notice (12 days avg.).
- Target marketing efforts for the Spring season well in advance (at least 42 days) to capture early planners.
- Monitor your own booking lead times against these Montesano averages to identify opportunities for dynamic pricing adjustments.
Popular & Essential Airbnb Amenities in Montesano (2025)
Amenity Prevalence
Amenity Insights for Montesano
- Essential amenities in Montesano that guests expect include: Hot water, Heating, Essentials, Carbon monoxide alarm, Wifi, Smoke alarm, Kitchen, TV. Lacking these (any) could significantly impact bookings.
- Popular amenities like Washer, Dryer are common but not universal. Offering these can provide a competitive edge.
Recommendations for Hosts
- Ensure your listing includes all essential amenities for Montesano: Hot water, Heating, Essentials, Carbon monoxide alarm, Wifi, Smoke alarm, Kitchen, TV.
- Consider adding popular differentiators like Washer or Dryer to increase appeal.
- Highlight unique or less common amenities you offer (e.g., hot tub, dedicated workspace, EV charger) in your listing description and photos.
- Regularly check competitor amenities in Montesano to stay competitive.
Montesano Airbnb Guest Demographics & Profile Analysis (2025)
Guest Profile Summary for Montesano
- The typical guest profile for Airbnb in Montesano consists of primarily domestic travelers (81%), often arriving from nearby Seattle, typically belonging to the Post-2000s (Gen Z/Alpha) group (50%), primarily speaking English or Spanish.
- Domestic travelers account for 81.0% of guests.
- Key international markets include United States (81%) and Canada (8.9%).
- Top languages spoken are English (61.7%) followed by Spanish (11.7%).
- A significant demographic segment is the Post-2000s (Gen Z/Alpha) group, representing 50% of guests.
Recommendations for Hosts
- Target domestic marketing efforts towards travelers from Seattle and Portland.
- Tailor amenities and listing descriptions to appeal to the dominant Post-2000s (Gen Z/Alpha) demographic (e.g., highlight fast WiFi, smart home features, local guides).
- Highlight unique local experiences or amenities relevant to the primary guest profile.
- Consider seasonal promotions aligned with peak travel times for key origin markets.
Nearby Short-Term Rental Market Comparison
How does the Montesano Airbnb market stack up against its neighbors? Compare key performance metrics like average monthly revenue, ADR, and occupancy rates in surrounding areas to understand the broader regional STR landscape.
| Market | Active Properties | Monthly Revenue | Daily Rate | Avg. Occupancy |
|---|---|---|---|---|
| Arch Cape | 74 | $7,311 | $477.62 | 54% |
| Erlands Point-Kitsap Lake | 12 | $5,433 | $345.43 | 52% |
| Cannon Beach | 221 | $4,398 | $395.81 | 43% |
| Dundee | 66 | $4,394 | $407.92 | 36% |
| Amanda Park | 10 | $4,285 | $443.71 | 40% |
| Manzanita | 284 | $4,201 | $348.43 | 41% |
| Allyn | 19 | $4,191 | $422.30 | 35% |
| Olalla | 14 | $4,078 | $292.59 | 52% |
| Moclips | 110 | $4,002 | $374.05 | 39% |
| Longbranch | 11 | $3,860 | $279.01 | 50% |