Port Townsend Airbnb Market Analysis 2026: Short Term Rental Data & Vacation Rental Statistics in Washington, United States
Is Airbnb profitable in Port Townsend in 2026? Explore comprehensive Airbnb analytics for Port Townsend, Washington, United States to uncover income potential. This 2026 STR market report for Port Townsend, based on AirROI data from February 2025 to January 2026, reveals key trends in the niche market of 134 active listings.
Whether you're considering an Airbnb investment in Port Townsend, optimizing your existing vacation rental, or exploring rental arbitrage opportunities, understanding the Port Townsend Airbnb data is crucial. Leveraging the low regulation environment is key to maximizing your short term rental income potential. Let's dive into the specifics.
Key Port Townsend Airbnb Performance Metrics Overview
Monthly Airbnb Revenue Variations & Income Potential in Port Townsend (2026)
Understanding the monthly revenue variations for Airbnb listings in Port Townsend is key to maximizing your short term rental income potential. Seasonality significantly impacts earnings. Our analysis, based on data from the past 12 months, shows that the peak revenue month for STRs in Port Townsend is typically August, while February often presents the lowest earnings, highlighting opportunities for strategic pricing adjustments during shoulder and low seasons. Explore the typical Airbnb income in Port Townsend across different performance tiers:
- Best-in-class properties (Top 10%) achieve $5,778+ monthly, often utilizing dynamic pricing and superior guest experiences.
- Strong performing properties (Top 25%) earn $4,064 or more, indicating effective management and desirable locations/amenities.
- Typical properties (Median) generate around $2,647 per month, representing the average market performance.
- Entry-level properties (Bottom 25%) see earnings around $1,427, often with potential for optimization.
Average Monthly Airbnb Earnings Trend in Port Townsend
Port Townsend Airbnb Occupancy Rate Trends (2026)
Maximize your bookings by understanding the Port Townsend STR occupancy trends. Seasonal demand shifts significantly influence how often properties are booked. Typically, Augustsees the highest demand (peak season occupancy), while January experiences the lowest (low season). Effective strategies, like adjusting minimum stays or offering promotions, can boost occupancy during slower periods. Here's how different property tiers perform in Port Townsend:
- Best-in-class properties (Top 10%) achieve 85%+ occupancy, indicating high desirability and potentially optimized availability.
- Strong performing properties (Top 25%) maintain 71% or higher occupancy, suggesting good market fit and guest satisfaction.
- Typical properties (Median) have an occupancy rate around 49%.
- Entry-level properties (Bottom 25%) average 25% occupancy, potentially facing higher vacancy.
Average Monthly Occupancy Rate Trend in Port Townsend
Average Daily Rate (ADR) Airbnb Trends in Port Townsend (2026)
Effective short term rental pricing strategy in Port Townsend involves understanding monthly ADR fluctuations. The Average Daily Rate (ADR) for Airbnb in Port Townsend typically peaks in August and dips lowest during January. Leveraging Airbnb dynamic pricing tools or strategies based on this seasonality can significantly boost revenue. Here's a look at the typical nightly rates achieved:
- Best-in-class properties (Top 10%) command rates of $343+ per night, often due to premium features or locations.
- Strong performing properties (Top 25%) achieve nightly rates of $263 or more.
- Typical properties (Median) charge around $179 per night.
- Entry-level properties (Bottom 25%) earn around $134 per night.
Average Daily Rate (ADR) Trend by Month in Port Townsend
Get Live Port Townsend Market Intelligence 👇

Explore Real-time Analytics
Airbnb Seasonality Analysis & Trends in Port Townsend (2026)
Peak Season (August, July, June)
- Revenue averages $4,370 per month
- Occupancy rates average 62.3%
- Daily rates average $233
Shoulder Season
- Revenue averages $3,013 per month
- Occupancy maintains around 47.0%
- Daily rates hold near $212
Low Season (January, February, April)
- Revenue drops to average $2,226 per month
- Occupancy decreases to average 38.2%
- Daily rates adjust to average $208
Seasonality Insights for Port Townsend
- The Airbnb seasonality in Port Townsend shows highly seasonal trends requiring careful strategy. While the sections above show seasonal averages, it's also insightful to look at the extremes:
- During the high season, the absolute peak month showcases Port Townsend's highest earning potential, with monthly revenues capable of climbing to $4,722, occupancy reaching a high of 65.7%, and ADRs peaking at $235.
- Conversely, the slowest single month of the year, typically falling within the low season, marks the market's lowest point. In this month, revenue might dip to $2,043, occupancy could drop to 35.4%, and ADRs may adjust down to $202.
- Understanding both the seasonal averages and these monthly peaks and troughs in revenue, occupancy, and ADR is crucial for maximizing your Airbnb profit potential in Port Townsend.
Seasonal Strategies for Maximizing Profit
- Peak Season: Maximize revenue through premium pricing and potentially longer minimum stays. Ensure high availability.
- Low Season: Offer competitive pricing, special promotions (e.g., extended stay discounts), and flexible cancellation policies. Target off-season travelers like remote workers or budget-conscious guests.
- Shoulder Seasons: Implement dynamic pricing that balances peak and low rates. Target weekend travelers or specific events. Offer slightly more flexible terms than peak season.
- Regularly analyze your own performance against these Port Townsend seasonality benchmarks and adjust your pricing and availability strategy accordingly.
Best Areas for Airbnb Investment in Port Townsend (2026)
Exploring the top neighborhoods for short-term rentals in Port Townsend? This section highlights key areas, outlining why they are attractive for hosts and guests, along with notable local attractions. Consider these locations based on your target guest profile and investment strategy.
| Neighborhood / Area | Why Host Here? (Target Guests & Appeal) | Key Attractions & Landmarks |
|---|---|---|
| Downtown Port Townsend | Historic waterfront district with beautiful Victorian architecture, boutiques, and restaurants. Popular for tourists exploring the maritime history and arts scene. | Port Townsend Marine Science Center, Jefferson County Historical Society, Fort Worden State Park, Port Townsend Farmers Market, The Rose Theatre |
| North Beach | Secluded beach area known for its stunning views and peaceful environment. Ideal for guests looking to relax and enjoy nature, with easy access to beaches and hiking trails. | North Beach Park, Cape George Colony, Hiking trails along the Olympic Peninsula, Driftwood Beach, Scenic views of the Strait of Juan de Fuca |
| Fort Worden State Park | Historic military fort turned state park. Offers a mix of outdoor activities and historical exploration, appealing to families and nature lovers. | Historic Fort Worden, Beaches and waterfront access, Camping and hiking trails, Visitor Center, Beautiful landscape gardens |
| Discovery Bay | Beautiful bay area offering stunning water views and recreational activities. Great for guests interested in kayaking, fishing, and nature. | Discovery Bay State Park, Outdoor activities like kayaking, Scenic boat tours, Fishing spots, Close to natural wildlife reserves |
| Uptown | Quieter residential neighborhood with local charm, local eateries, and small shops. Great for guests wanting a more community-oriented experience away from the tourist hustle. | Local cafés and bakeries, Uptown Theater, Historical buildings, Community parks, Unique local shops |
| Point Hudson | Charming waterfront area with marinas and beaches. Good for guests looking for a nautical experience and water-based activities. | Point Hudson Marina, Beaches, Boating and sailing activities, Scenic waterfront views, Nearby dining options |
| Port Townsend Historic District | The heart of the town known for its well-preserved buildings and rich history. Attracts history enthusiasts and those looking to explore the local culture. | Main Street shops and galleries, Historical walking tours, Local restaurants, Artisan studios, Museums |
| Oak Bay | A tranquil area featuring natural beauty, beaches, and outdoor activities. Popular for guests wanting to escape and enjoy relaxation in nature. | Oak Bay beaches, Nature trails, Wildlife viewing, Scenic viewpoints, Close proximity to fishing spots |
Understanding Airbnb License Requirements & STR Laws in Port Townsend (2026)
While Port Townsend, Washington, United States currently shows low STR regulations, specific Airbnb license requirements might still exist or change. Always verify the latest short term rental regulations and Airbnb license requirements directly with local government authorities for Port Townsend to ensure full compliance before hosting.
(Source: AirROI data, 2026, finding no licensed listings among those analyzed)
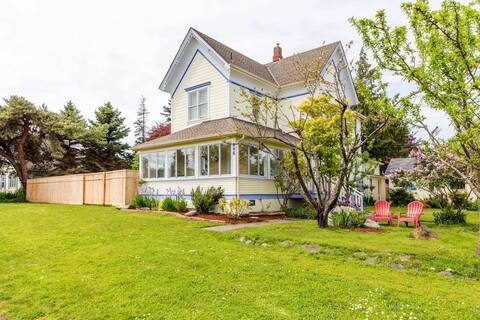
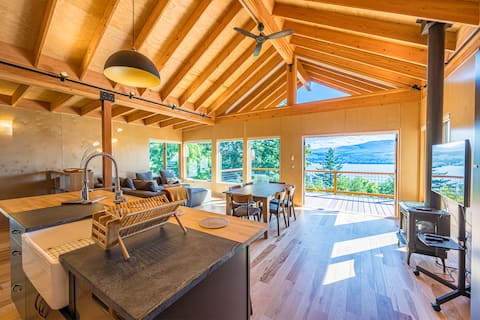
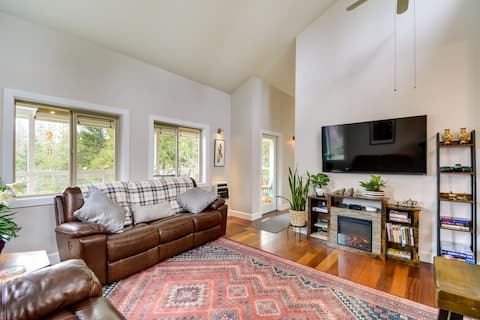
Top Performing Airbnb Properties in Port Townsend (2026)
Benchmark your potential! Explore examples of top-performing Airbnb properties in Port Townsendbased on Trailing Twelve Month (TTM) revenue. Analyze their characteristics, revenue, occupancy rate, and ADR to understand what drives success in this market.

Private Waterfront Spa Retreat + Movie Theater
Entire Place • 3 bedrooms
Uptown Victorian 5 bedroom, 4 bath. Sleeps 12!
Entire Place • 5 bedrooms

Port Townsend waterfront new sauna!
Entire Place • 3 bedrooms
Amazing Views and Peaceful Privacy, Unique House
Entire Place • 2 bedrooms
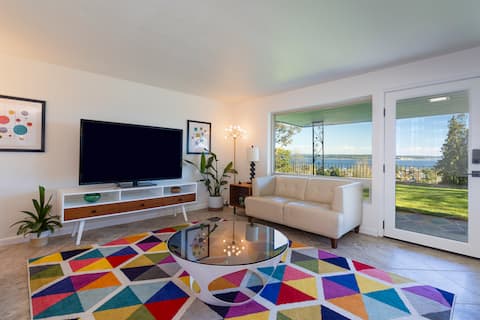
Stunning views + ideal location
Entire Place • 2 bedrooms
Port Townsend Home: Spacious Yard & Mountain Views
Entire Place • 4 bedrooms
Note: Performance varies based on location, size, amenities, seasonality, and management quality. Data reflects the past 12 months.
Top Performing Airbnb Hosts in Port Townsend (2026)
Learn from the best! This table showcases top-performing Airbnb hosts in Port Townsend based on the number of properties managed and estimated total revenue over the past year. Analyze their scale and performance metrics.
| Host Name | Properties | Grossing Revenue | Stay Reviews | Avg Rating |
|---|---|---|---|---|
| Kelly | 4 | $348,308 | 1278 | 4.94/5.0 |
| Virginia | 1 | $176,206 | 173 | 4.99/5.0 |
| Jessica | 9 | $164,860 | 69 | 4.83/5.0 |
| Evolve | 3 | $136,731 | 165 | 4.69/5.0 |
| Darrell And Carlene | 2 | $127,753 | 704 | 4.97/5.0 |
| Ann | 3 | $104,417 | 1343 | 4.82/5.0 |
| Kelly | 1 | $104,229 | 105 | 4.94/5.0 |
| Olia | 1 | $98,332 | 93 | 5.00/5.0 |
| Ariel | 2 | $94,943 | 482 | 4.92/5.0 |
| Lana | 3 | $92,646 | 3539 | 4.91/5.0 |
Analyzing the strategies of top hosts, such as their property selection, pricing, and guest communication, can offer valuable lessons for optimizing your own Airbnb operations in Port Townsend.
Dive Deeper: Advanced Port Townsend STR Market Data (2026)
Ready to unlock more insights? AirROI provides access to advanced metrics and comprehensive Airbnb data for Port Townsend. Explore detailed analytics beyond this report to refine your investment strategy, optimize pricing, and maximize your vacation rental profits.
Explore Advanced MetricsPort Townsend Short-Term Rental Market Composition (2026): Property & Room Types
Room Type Distribution
Property Type Distribution
Market Composition Insights for Port Townsend
- The Port Townsend Airbnb market composition is heavily skewed towards Entire Home/Apt listings, which make up 66.4% of the 134 active rentals. This indicates strong guest preference for privacy and space.
- However, a notable 32.8% share for Private Rooms suggests opportunities for budget-conscious travelers or hosts renting out spare rooms.
- Looking at the property type distribution in Port Townsend, House properties are the most common (36.6%), reflecting the local real estate landscape.
- Houses represent a significant 36.6% portion, catering likely to families or larger groups.
- The presence of 29.1% Hotel/Boutique listings indicates integration with traditional hospitality.
- Smaller segments like unique stays (combined 0.7%) offer potential for unique stay experiences.
Port Townsend Airbnb Room Capacity Analysis (2026): Bedroom Distribution
Distribution of Listings by Number of Bedrooms
Room Capacity Insights for Port Townsend
- The dominant room capacity in Port Townsend is 1 bedroom listings, making up 44% of the market. This suggests a strong demand for properties suitable for couples or solo travelers.
- Together, 1 bedroom and 2 bedrooms properties represent 67.9% of the active Airbnb listings in Port Townsend, indicating a high concentration in these sizes.
- Listings with 3+ bedrooms (8.9%) represent a smaller niche, potentially indicating an underserved market for larger group accommodations in Port Townsend.
Port Townsend Vacation Rental Guest Capacity Trends (2026)
Distribution of Listings by Guest Capacity
Guest Capacity Insights for Port Townsend
- The most common guest capacity trend in Port Townsend vacation rentals is listings accommodating 2 guests (30.6%). This suggests the primary traveler segment is likely couples or solo travelers.
- Properties designed for 2 guests and 4 guests dominate the Port Townsend STR market, accounting for 58.2% of listings.
- 17.2% of properties accommodate 6+ guests, serving the market segment for larger families or group travel in Port Townsend.
- On average, properties in Port Townsend are equipped to host 3.2 guests.
Port Townsend Airbnb Booking Patterns (2026): Available vs. Booked Days
Available Days Distribution
Booked Days Distribution
Booking Pattern Insights for Port Townsend
- The most common availability pattern in Port Townsend falls within the 271-366 days range, representing 35.8% of listings. This suggests many properties have significant open periods on their calendars.
- Approximately 65.7% of listings show high availability (181+ days open annually), indicating potential for increased bookings or specific owner usage patterns.
- For booked days, the 91-180 days range is most frequent in Port Townsend (30.6%), reflecting common guest stay durations or potential owner blocking patterns.
- A notable 35.1% of properties secure long booking periods (181+ days booked per year), highlighting successful long-term rental strategies or significant owner usage.
Port Townsend Airbnb Minimum Stay Requirements Analysis
Distribution of Listings by Minimum Night Requirement
1 Night
40 listings
29.9% of total
2 Nights
34 listings
25.4% of total
3 Nights
2 listings
1.5% of total
4-6 Nights
2 listings
1.5% of total
7-29 Nights
4 listings
3% of total
30+ Nights
52 listings
38.8% of total
Key Insights
- The most prevalent minimum stay requirement in Port Townsend is 30+ Nights, adopted by 38.8% of listings. This highlights the market's preference for longer commitments.
- A significant segment (38.8%) caters to monthly stays (30+ nights) in Port Townsend, pointing to opportunities in the extended-stay market.
Recommendations
- Align with the market by considering a 30+ Nights minimum stay, as 38.8% of Port Townsend hosts use this setting.
- If feasible, allowing 1-night stays, especially midweek or during low season, could capture last-minute bookings, as only 29.9% currently do.
- Explore offering discounts for stays of 30+ nights to attract the 38.8% of the market seeking extended stays.
- Adjust minimum nights based on seasonality – potentially shorter during low season and longer during peak demand periods in Port Townsend.
Port Townsend Airbnb Cancellation Policy Trends Analysis (2026)
Super Strict 30 Days
5 listings
3.7% of total
Flexible
23 listings
17.2% of total
Moderate
61 listings
45.5% of total
Firm
36 listings
26.9% of total
Strict
9 listings
6.7% of total
Cancellation Policy Insights for Port Townsend
- The prevailing Airbnb cancellation policy trend in Port Townsend is Moderate, used by 45.5% of listings.
- There's a relatively balanced mix between guest-friendly (62.7%) and stricter (33.6%) policies, offering choices for different guest needs.
- Strict cancellation policies are quite rare (6.7%), potentially making listings with this policy less competitive unless justified by high demand or property type.
Recommendations for Hosts
- Consider adopting a Moderate policy to align with the 45.5% market standard in Port Townsend.
- Using a Strict policy might deter some guests, as only 6.7% of listings use it. Evaluate if potential revenue protection outweighs possible lower booking rates.
- Regularly review your cancellation policy against competitors and market demand shifts in Port Townsend.
Port Townsend STR Booking Lead Time Analysis (2026)
Average Booking Lead Time by Month
Booking Lead Time Insights for Port Townsend
- The overall average booking lead time for vacation rentals in Port Townsend is 67 days.
- Guests book furthest in advance for stays during August (average 92 days), likely coinciding with peak travel demand or local events.
- The shortest booking windows occur for stays in March (average 45 days), indicating more last-minute travel plans during this time.
- Seasonally, Summer (83 days avg.) sees the longest lead times, while Winter (51 days avg.) has the shortest, reflecting typical travel planning cycles.
Recommendations for Hosts
- Use the overall average lead time (67 days) as a baseline for your pricing and availability strategy in Port Townsend.
- For August stays, consider implementing length-of-stay discounts or slightly higher rates for bookings made less than 92 days out to capitalize on advance planning.
- Target marketing efforts for the Summer season well in advance (at least 83 days) to capture early planners.
- Monitor your own booking lead times against these Port Townsend averages to identify opportunities for dynamic pricing adjustments.
Popular & Essential Airbnb Amenities in Port Townsend (2026)
Amenity Prevalence
Amenity Insights for Port Townsend
- Essential amenities in Port Townsend that guests expect include: Wifi, Smoke alarm. Lacking these (any) could significantly impact bookings.
- Popular amenities like Heating, Fire extinguisher, Essentials are common but not universal. Offering these can provide a competitive edge.
Recommendations for Hosts
- Ensure your listing includes all essential amenities for Port Townsend: Wifi, Smoke alarm.
- Prioritize adding missing essentials: Wifi, Smoke alarm.
- Consider adding popular differentiators like Heating or Fire extinguisher to increase appeal.
- Highlight unique or less common amenities you offer (e.g., hot tub, dedicated workspace, EV charger) in your listing description and photos.
- Regularly check competitor amenities in Port Townsend to stay competitive.
Port Townsend Airbnb Guest Demographics & Profile Analysis (2026)
Guest Profile Summary for Port Townsend
- The typical guest profile for Airbnb in Port Townsend consists of primarily domestic travelers (96%), often arriving from nearby Seattle, typically belonging to the Post-2000s (Gen Z/Alpha) group (50%), primarily speaking English or Spanish.
- Domestic travelers account for 95.7% of guests.
- Key international markets include United States (95.7%) and Canada (1.9%).
- Top languages spoken are English (67.6%) followed by Spanish (12.4%).
- A significant demographic segment is the Post-2000s (Gen Z/Alpha) group, representing 50% of guests.
Recommendations for Hosts
- Target domestic marketing efforts towards travelers from Seattle and Portland.
- Tailor amenities and listing descriptions to appeal to the dominant Post-2000s (Gen Z/Alpha) demographic (e.g., highlight fast WiFi, smart home features, local guides).
- Highlight unique local experiences or amenities relevant to the primary guest profile.
- Consider seasonal promotions aligned with peak travel times for key origin markets.
Nearby Short-Term Rental Market Comparison
How does the Port Townsend Airbnb market stack up against its neighbors? Compare key performance metrics like average monthly revenue, ADR, and occupancy rates in surrounding areas to understand the broader regional STR landscape.
| Market | Active Properties | Monthly Revenue | Daily Rate | Avg. Occupancy |
|---|---|---|---|---|
| Erlands Point-Kitsap Lake | 12 | $5,285 | $366.41 | 47% |
| North Bend | 51 | $5,073 | $352.89 | 57% |
| Olalla | 13 | $4,868 | $334.79 | 49% |
| Sudden Valley | 63 | $4,821 | $324.44 | 51% |
| Warm Beach | 10 | $4,811 | $319.50 | 43% |
| Verlot | 11 | $4,608 | $314.03 | 49% |
| Canyon Creek | 13 | $4,568 | $301.22 | 51% |
| Ronald | 153 | $4,567 | $456.22 | 35% |
| Sultan | 17 | $4,436 | $300.44 | 51% |
| Woodinville | 35 | $4,409 | $340.44 | 51% |