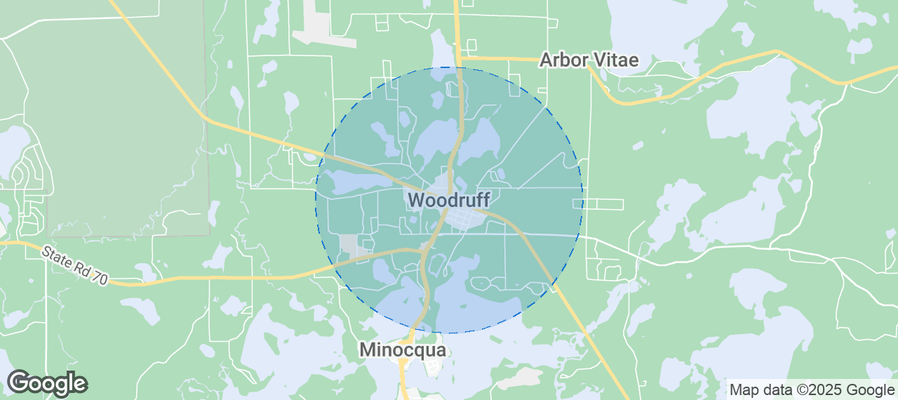
Town of Woodruff Airbnb Market Analysis 2026: Short Term Rental Data & Vacation Rental Statistics in Wisconsin, United States
Is Airbnb profitable in Town of Woodruff in 2026? Explore comprehensive Airbnb analytics for Town of Woodruff, Wisconsin, United States to uncover income potential. This 2026 STR market report for Town of Woodruff, based on AirROI data from November 2024 to October 2025, reveals key trends in the niche market of 18 active listings.
Whether you're considering an Airbnb investment in Town of Woodruff, optimizing your existing vacation rental, or exploring rental arbitrage opportunities, understanding the Town of Woodruff Airbnb data is crucial. Leveraging the low regulation environment is key to maximizing your short term rental income potential. Let's dive into the specifics.
Key Town of Woodruff Airbnb Performance Metrics Overview
Monthly Airbnb Revenue Variations & Income Potential in Town of Woodruff (2026)
Understanding the monthly revenue variations for Airbnb listings in Town of Woodruff is key to maximizing your short term rental income potential. Seasonality significantly impacts earnings. Our analysis, based on data from the past 12 months, shows that the peak revenue month for STRs in Town of Woodruff is typically July, while March often presents the lowest earnings, highlighting opportunities for strategic pricing adjustments during shoulder and low seasons. Explore the typical Airbnb income in Town of Woodruff across different performance tiers:
- Best-in-class properties (Top 10%) achieve $6,875+ monthly, often utilizing dynamic pricing and superior guest experiences.
- Strong performing properties (Top 25%) earn $4,672 or more, indicating effective management and desirable locations/amenities.
- Typical properties (Median) generate around $2,157 per month, representing the average market performance.
- Entry-level properties (Bottom 25%) see earnings around $1,115, often with potential for optimization.
Average Monthly Airbnb Earnings Trend in Town of Woodruff
Town of Woodruff Airbnb Occupancy Rate Trends (2026)
Maximize your bookings by understanding the Town of Woodruff STR occupancy trends. Seasonal demand shifts significantly influence how often properties are booked. Typically, Julysees the highest demand (peak season occupancy), while March experiences the lowest (low season). Effective strategies, like adjusting minimum stays or offering promotions, can boost occupancy during slower periods. Here's how different property tiers perform in Town of Woodruff:
- Best-in-class properties (Top 10%) achieve 59%+ occupancy, indicating high desirability and potentially optimized availability.
- Strong performing properties (Top 25%) maintain 40% or higher occupancy, suggesting good market fit and guest satisfaction.
- Typical properties (Median) have an occupancy rate around 27%.
- Entry-level properties (Bottom 25%) average 13% occupancy, potentially facing higher vacancy.
Average Monthly Occupancy Rate Trend in Town of Woodruff
Average Daily Rate (ADR) Airbnb Trends in Town of Woodruff (2026)
Effective short term rental pricing strategy in Town of Woodruff involves understanding monthly ADR fluctuations. The Average Daily Rate (ADR) for Airbnb in Town of Woodruff typically peaks in May and dips lowest during October. Leveraging Airbnb dynamic pricing tools or strategies based on this seasonality can significantly boost revenue. Here's a look at the typical nightly rates achieved:
- Best-in-class properties (Top 10%) command rates of $520+ per night, often due to premium features or locations.
- Strong performing properties (Top 25%) achieve nightly rates of $454 or more.
- Typical properties (Median) charge around $248 per night.
- Entry-level properties (Bottom 25%) earn around $197 per night.
Average Daily Rate (ADR) Trend by Month in Town of Woodruff
Get Live Town of Woodruff Market Intelligence 👇
Explore Real-time Analytics
Airbnb Seasonality Analysis & Trends in Town of Woodruff (2025)
Peak Season (July, August, June)
- Revenue averages $6,062 per month
- Occupancy rates average 51.0%
- Daily rates average $323
Shoulder Season
- Revenue averages $2,732 per month
- Occupancy maintains around 27.4%
- Daily rates hold near $313
Low Season (February, March, December)
- Revenue drops to average $1,296 per month
- Occupancy decreases to average 15.7%
- Daily rates adjust to average $318
Seasonality Insights for Town of Woodruff
- The Airbnb seasonality in Town of Woodruff shows highly seasonal trends requiring careful strategy. While the sections above show seasonal averages, it's also insightful to look at the extremes:
- During the high season, the absolute peak month showcases Town of Woodruff's highest earning potential, with monthly revenues capable of climbing to $8,901, occupancy reaching a high of 70.5%, and ADRs peaking at $330.
- Conversely, the slowest single month of the year, typically falling within the low season, marks the market's lowest point. In this month, revenue might dip to $983, occupancy could drop to 8.1%, and ADRs may adjust down to $284.
- Understanding both the seasonal averages and these monthly peaks and troughs in revenue, occupancy, and ADR is crucial for maximizing your Airbnb profit potential in Town of Woodruff.
Seasonal Strategies for Maximizing Profit
- Peak Season: Maximize revenue through premium pricing and potentially longer minimum stays. Ensure high availability.
- Low Season: Offer competitive pricing, special promotions (e.g., extended stay discounts), and flexible cancellation policies. Target off-season travelers like remote workers or budget-conscious guests.
- Shoulder Seasons: Implement dynamic pricing that balances peak and low rates. Target weekend travelers or specific events. Offer slightly more flexible terms than peak season.
- Regularly analyze your own performance against these Town of Woodruff seasonality benchmarks and adjust your pricing and availability strategy accordingly.
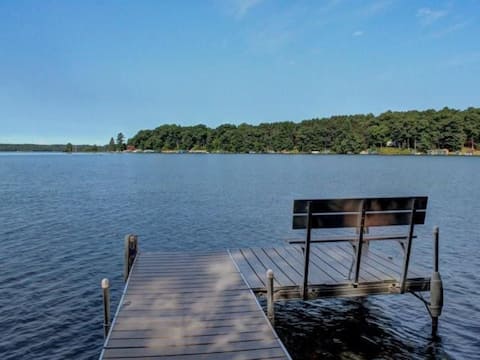
Best Areas for Airbnb Investment in Town of Woodruff (2026)
Exploring the top neighborhoods for short-term rentals in Town of Woodruff? This section highlights key areas, outlining why they are attractive for hosts and guests, along with notable local attractions. Consider these locations based on your target guest profile and investment strategy.
| Neighborhood / Area | Why Host Here? (Target Guests & Appeal) | Key Attractions & Landmarks |
|---|---|---|
| Lake Indian | A serene lakefront area perfect for nature lovers and families looking for a peaceful getaway. The area is ideal for outdoor activities like fishing, swimming, and hiking. | Lake Indian, Woodruff Town Park, Chain O'Lakes, Hiking Trails, Fishing Spots |
| Downtown Woodruff | The heart of Woodruff, offering easy access to local shops and restaurants. It is an attractive destination for visitors looking for a small-town experience. | Local Shops, Restaurants, Woodruff Area Historical Society, Community Events |
| Minocqua Winter Park | A popular area for outdoor winter activities such as skiing and snowboarding, attracting tourists year-round with its recreational opportunities. | Ski Trails, Snowboarding, Tubing, Hiking Trails, Scenic Views |
| Long Lake | A family-friendly destination with numerous cabins and vacation homes, ideal for those looking to spend time by the water. | Long Lake, Fishing, Swimming, Picnic Areas, Boating |
| Wildwood Wildlife Park | A unique wildlife park that draws families and nature enthusiasts, with potential for lodging near a fun, educational experience. | Wildwood Wildlife Park, Animal Encounters, Nature Trails, Educational Programs |
| Bearskin State Trail | A scenic trail for biking and walking, attracting outdoor enthusiasts who prefer an active lifestyle and beautiful landscapes. | Bearskin State Trail, Biking, Walking, Wildlife Viewing, Nature Photography |
| Minoqua Chain of Lakes | An interconnected series of lakes that offers boating, fishing, and other water sports, making it a prime location for water enthusiasts. | Lake Tomahawk, Boating, Fishing, Swimming, Water Sports |
| Northern Highlands-American Legion State Forest | A vast state forest that attracts visitors for camping and exploring nature, ideal for those seeking tranquility and adventure. | Camping, Hiking Trails, Wildlife Viewing, Picnic Areas, Scenic Forests |
Understanding Airbnb License Requirements & STR Laws in Town of Woodruff (2026)
While Town of Woodruff, Wisconsin, United States currently shows low STR regulations, specific Airbnb license requirements might still exist or change. Always verify the latest short term rental regulations and Airbnb license requirements directly with local government authorities for Town of Woodruff to ensure full compliance before hosting.
(Source: AirROI data, 2026, finding no licensed listings among those analyzed)
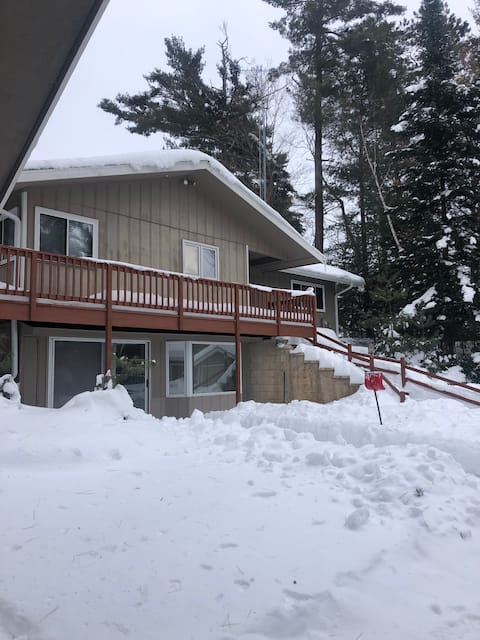
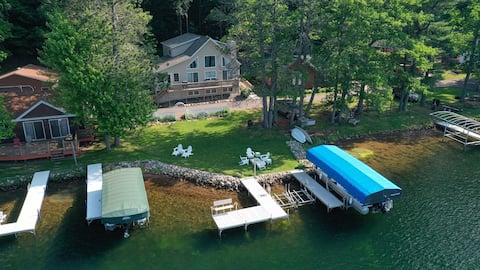
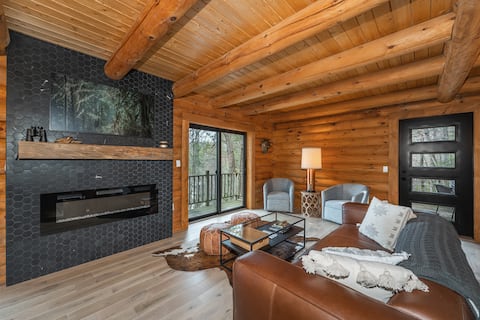
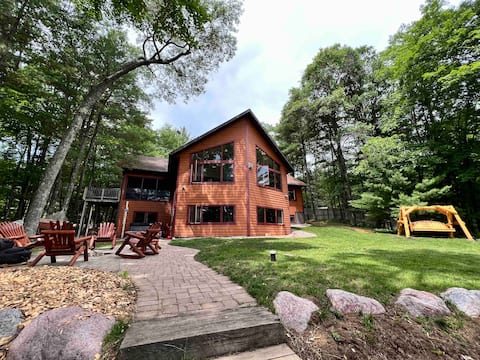
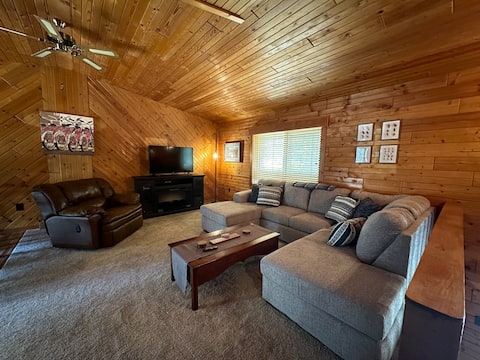
Top Performing Airbnb Properties in Town of Woodruff (2026)
Benchmark your potential! Explore examples of top-performing Airbnb properties in Town of Woodruffbased on Trailing Twelve Month (TTM) revenue. Analyze their characteristics, revenue, occupancy rate, and ADR to understand what drives success in this market.
Large home on Mid Lake
Entire Place • 4 bedrooms
Chalet Minocqua on Lake Tomahawk with Game Room
Entire Place • 4 bedrooms
NEW- Hasbrook Hideaway Modern Lakeside Cabin
Entire Place • 3 bedrooms
Spacious Lakefront Home Full of Amenities & Fun!
Entire Place • 4 bedrooms
Gorgeous Home on Lake Tomahawk!
Entire Place • 5 bedrooms
The Forest Loon at Indian Mounds
Entire Place • 3 bedrooms
Note: Performance varies based on location, size, amenities, seasonality, and management quality. Data reflects the past 12 months.
Top Performing Airbnb Hosts in Town of Woodruff (2026)
Learn from the best! This table showcases top-performing Airbnb hosts in Town of Woodruff based on the number of properties managed and estimated total revenue over the past year. Analyze their scale and performance metrics.
| Host Name | Properties | Grossing Revenue | Stay Reviews | Avg Rating |
|---|---|---|---|---|
| Kelly | 3 | $92,453 | 175 | 4.99/5.0 |
| Cristina | 1 | $71,614 | 30 | 4.80/5.0 |
| Nikki | 1 | $57,245 | 7 | 5.00/5.0 |
| Jeremiah | 1 | $45,840 | 32 | 4.97/5.0 |
| Kelley | 1 | $44,828 | 6 | 4.83/5.0 |
| Elijah | 1 | $33,636 | 26 | 5.00/5.0 |
| Indian Shores | 7 | $28,116 | 34 | 4.33/5.0 |
| Melody | 1 | $25,034 | 44 | 4.89/5.0 |
| Jeff | 1 | $8,869 | 58 | 4.84/5.0 |
| Rick | 1 | $2,054 | 85 | 4.75/5.0 |
Analyzing the strategies of top hosts, such as their property selection, pricing, and guest communication, can offer valuable lessons for optimizing your own Airbnb operations in Town of Woodruff.
Dive Deeper: Advanced Town of Woodruff STR Market Data (2026)
Ready to unlock more insights? AirROI provides access to advanced metrics and comprehensive Airbnb data for Town of Woodruff. Explore detailed analytics beyond this report to refine your investment strategy, optimize pricing, and maximize your vacation rental profits.
Explore Advanced MetricsTown of Woodruff Short-Term Rental Market Composition (2026): Property & Room Types
Room Type Distribution
Property Type Distribution
Market Composition Insights for Town of Woodruff
- The Town of Woodruff Airbnb market composition is heavily skewed towards Entire Home/Apt listings, which make up 94.4% of the 18 active rentals. This indicates strong guest preference for privacy and space.
- Looking at the property type distribution in Town of Woodruff, House properties are the most common (83.3%), reflecting the local real estate landscape.
- Houses represent a significant 83.3% portion, catering likely to families or larger groups.
Town of Woodruff Airbnb Room Capacity Analysis (2026): Bedroom Distribution
Distribution of Listings by Number of Bedrooms
Room Capacity Insights for Town of Woodruff
- The dominant room capacity in Town of Woodruff is 3 bedrooms listings, making up 27.8% of the market. This suggests a strong demand for properties suitable for families or small groups.
- Together, 3 bedrooms and 2 bedrooms properties represent 55.6% of the active Airbnb listings in Town of Woodruff, indicating a high concentration in these sizes.
- A significant 50.1% of listings offer 3+ bedrooms, catering to larger groups and families seeking more space in Town of Woodruff.
Town of Woodruff Vacation Rental Guest Capacity Trends (2026)
Distribution of Listings by Guest Capacity
Guest Capacity Insights for Town of Woodruff
- The most common guest capacity trend in Town of Woodruff vacation rentals is listings accommodating 6 guests (33.3%). This suggests the primary traveler segment is likely larger groups.
- Properties designed for 6 guests and 4 guests dominate the Town of Woodruff STR market, accounting for 61.1% of listings.
- 61.1% of properties accommodate 6+ guests, serving the market segment for larger families or group travel in Town of Woodruff.
- On average, properties in Town of Woodruff are equipped to host 5.4 guests.
Town of Woodruff Airbnb Booking Patterns (2026): Available vs. Booked Days
Available Days Distribution
Booked Days Distribution
Booking Pattern Insights for Town of Woodruff
- The most common availability pattern in Town of Woodruff falls within the 271-366 days range, representing 66.7% of listings. This suggests many properties have significant open periods on their calendars.
- Approximately 100.0% of listings show high availability (181+ days open annually), indicating potential for increased bookings or specific owner usage patterns.
- For booked days, the 91-180 days range is most frequent in Town of Woodruff (44.4%), reflecting common guest stay durations or potential owner blocking patterns.
Town of Woodruff Airbnb Minimum Stay Requirements Analysis
Distribution of Listings by Minimum Night Requirement
2 Nights
8 listings
44.4% of total
4-6 Nights
5 listings
27.8% of total
30+ Nights
5 listings
27.8% of total
Key Insights
- The most prevalent minimum stay requirement in Town of Woodruff is 2 Nights, adopted by 44.4% of listings. This highlights the market's preference for shorter, flexible bookings.
- A significant segment (27.8%) caters to monthly stays (30+ nights) in Town of Woodruff, pointing to opportunities in the extended-stay market.
Recommendations
- Align with the market by considering a 2 Nights minimum stay, as 44.4% of Town of Woodruff hosts use this setting.
- A 2-night minimum appears standard (44.4%). Consider this for weekends or peak periods.
- Explore offering discounts for stays of 30+ nights to attract the 27.8% of the market seeking extended stays.
- Adjust minimum nights based on seasonality – potentially shorter during low season and longer during peak demand periods in Town of Woodruff.
Town of Woodruff Airbnb Cancellation Policy Trends Analysis (2026)
Flexible
1 listings
5.6% of total
Moderate
2 listings
11.1% of total
Firm
14 listings
77.8% of total
Strict
1 listings
5.6% of total
Cancellation Policy Insights for Town of Woodruff
- The prevailing Airbnb cancellation policy trend in Town of Woodruff is Firm, used by 77.8% of listings.
- A majority (83.4%) of hosts in Town of Woodruff utilize Firm or Strict policies, indicating a market where hosts prioritize booking security.
- Strict cancellation policies are quite rare (5.6%), potentially making listings with this policy less competitive unless justified by high demand or property type.
Recommendations for Hosts
- Consider adopting a Firm policy to align with the 77.8% market standard in Town of Woodruff.
- Using a Strict policy might deter some guests, as only 5.6% of listings use it. Evaluate if potential revenue protection outweighs possible lower booking rates.
- Regularly review your cancellation policy against competitors and market demand shifts in Town of Woodruff.
Town of Woodruff STR Booking Lead Time Analysis (2026)
Average Booking Lead Time by Month
Booking Lead Time Insights for Town of Woodruff
- The overall average booking lead time for vacation rentals in Town of Woodruff is 109 days.
- Guests book furthest in advance for stays during July (average 193 days), likely coinciding with peak travel demand or local events.
- The shortest booking windows occur for stays in March (average 11 days), indicating more last-minute travel plans during this time.
- Seasonally, Summer (153 days avg.) sees the longest lead times, while Fall (50 days avg.) has the shortest, reflecting typical travel planning cycles.
Recommendations for Hosts
- Use the overall average lead time (109 days) as a baseline for your pricing and availability strategy in Town of Woodruff.
- For July stays, consider implementing length-of-stay discounts or slightly higher rates for bookings made less than 193 days out to capitalize on advance planning.
- During March, focus on last-minute booking availability and promotions, as guests book with very short notice (11 days avg.).
- Target marketing efforts for the Summer season well in advance (at least 153 days) to capture early planners.
- Monitor your own booking lead times against these Town of Woodruff averages to identify opportunities for dynamic pricing adjustments.
Popular & Essential Airbnb Amenities in Town of Woodruff (2026)
Amenity Prevalence
Amenity Insights for Town of Woodruff
- Essential amenities in Town of Woodruff that guests expect include: Free parking on premises, Wifi, Heating, Smoke alarm, Dishes and silverware, TV, Kitchen, Microwave. Lacking these (any) could significantly impact bookings.
- Popular amenities like Air conditioning, Private entrance are common but not universal. Offering these can provide a competitive edge.
Recommendations for Hosts
- Ensure your listing includes all essential amenities for Town of Woodruff: Free parking on premises, Wifi, Heating, Smoke alarm, Dishes and silverware, TV, Kitchen, Microwave.
- Consider adding popular differentiators like Air conditioning or Private entrance to increase appeal.
- Highlight unique or less common amenities you offer (e.g., hot tub, dedicated workspace, EV charger) in your listing description and photos.
- Regularly check competitor amenities in Town of Woodruff to stay competitive.
Town of Woodruff Airbnb Guest Demographics & Profile Analysis (2026)
Guest Profile Summary for Town of Woodruff
- The typical guest profile for Airbnb in Town of Woodruff consists of primarily domestic travelers (97%), often arriving from nearby Green Bay, typically belonging to the Post-2000s (Gen Z/Alpha) group (50%), primarily speaking English.
- Domestic travelers account for 97.2% of guests.
- Key international markets include United States (97.2%) and Switzerland (2.8%).
- A significant demographic segment is the Post-2000s (Gen Z/Alpha) group, representing 50% of guests.
Recommendations for Hosts
- Target domestic marketing efforts towards travelers from Green Bay and Madison.
- Tailor amenities and listing descriptions to appeal to the dominant Post-2000s (Gen Z/Alpha) demographic (e.g., highlight fast WiFi, smart home features, local guides).
- Highlight unique local experiences or amenities relevant to the primary guest profile.
- Consider seasonal promotions aligned with peak travel times for key origin markets.
Nearby Short-Term Rental Market Comparison
How does the Town of Woodruff Airbnb market stack up against its neighbors? Compare key performance metrics like average monthly revenue, ADR, and occupancy rates in surrounding areas to understand the broader regional STR landscape.
| Market | Active Properties | Monthly Revenue | Daily Rate | Avg. Occupancy |
|---|---|---|---|---|
| Town of Wilson | 16 | $5,789 | $603.24 | 41% |
| Suamico | 10 | $5,164 | $479.04 | 42% |
| Town of Newton | 10 | $5,145 | $458.27 | 42% |
| Town of Osceola | 10 | $4,874 | $416.87 | 37% |
| Town of Armenia | 11 | $3,983 | $516.64 | 33% |
| Allouez | 20 | $3,924 | $467.50 | 35% |
| Republic Township | 15 | $3,833 | $338.70 | 43% |
| Green Bay | 402 | $3,581 | $441.32 | 36% |
| Town of Necedah | 24 | $3,536 | $315.41 | 35% |
| Village of Rib Mountain | 14 | $3,524 | $414.62 | 37% |