Wisconsin Dells Airbnb Market Analysis 2026: Short Term Rental Data & Vacation Rental Statistics in Wisconsin, United States
Is Airbnb profitable in Wisconsin Dells in 2026? Explore comprehensive Airbnb analytics for Wisconsin Dells, Wisconsin, United States to uncover income potential. This 2026 STR market report for Wisconsin Dells, based on AirROI data from February 2025 to January 2026, reveals key trends in the market of 229 active listings.
Whether you're considering an Airbnb investment in Wisconsin Dells, optimizing your existing vacation rental, or exploring rental arbitrage opportunities, understanding the Wisconsin Dells Airbnb data is crucial. Leveraging the low regulation environment is key to maximizing your short term rental income potential. Let's dive into the specifics.
Key Wisconsin Dells Airbnb Performance Metrics Overview
Monthly Airbnb Revenue Variations & Income Potential in Wisconsin Dells (2026)
Understanding the monthly revenue variations for Airbnb listings in Wisconsin Dells is key to maximizing your short term rental income potential. Seasonality significantly impacts earnings. Our analysis, based on data from the past 12 months, shows that the peak revenue month for STRs in Wisconsin Dells is typically July, while February often presents the lowest earnings, highlighting opportunities for strategic pricing adjustments during shoulder and low seasons. Explore the typical Airbnb income in Wisconsin Dells across different performance tiers:
- Best-in-class properties (Top 10%) achieve $7,592+ monthly, often utilizing dynamic pricing and superior guest experiences.
- Strong performing properties (Top 25%) earn $4,826 or more, indicating effective management and desirable locations/amenities.
- Typical properties (Median) generate around $2,629 per month, representing the average market performance.
- Entry-level properties (Bottom 25%) see earnings around $1,144, often with potential for optimization.
Average Monthly Airbnb Earnings Trend in Wisconsin Dells
Wisconsin Dells Airbnb Occupancy Rate Trends (2026)
Maximize your bookings by understanding the Wisconsin Dells STR occupancy trends. Seasonal demand shifts significantly influence how often properties are booked. Typically, Julysees the highest demand (peak season occupancy), while April experiences the lowest (low season). Effective strategies, like adjusting minimum stays or offering promotions, can boost occupancy during slower periods. Here's how different property tiers perform in Wisconsin Dells:
- Best-in-class properties (Top 10%) achieve 63%+ occupancy, indicating high desirability and potentially optimized availability.
- Strong performing properties (Top 25%) maintain 48% or higher occupancy, suggesting good market fit and guest satisfaction.
- Typical properties (Median) have an occupancy rate around 28%.
- Entry-level properties (Bottom 25%) average 14% occupancy, potentially facing higher vacancy.
Average Monthly Occupancy Rate Trend in Wisconsin Dells
Average Daily Rate (ADR) Airbnb Trends in Wisconsin Dells (2026)
Effective short term rental pricing strategy in Wisconsin Dells involves understanding monthly ADR fluctuations. The Average Daily Rate (ADR) for Airbnb in Wisconsin Dells typically peaks in July and dips lowest during February. Leveraging Airbnb dynamic pricing tools or strategies based on this seasonality can significantly boost revenue. Here's a look at the typical nightly rates achieved:
- Best-in-class properties (Top 10%) command rates of $518+ per night, often due to premium features or locations.
- Strong performing properties (Top 25%) achieve nightly rates of $376 or more.
- Typical properties (Median) charge around $264 per night.
- Entry-level properties (Bottom 25%) earn around $181 per night.
Average Daily Rate (ADR) Trend by Month in Wisconsin Dells
Get Live Wisconsin Dells Market Intelligence 👇

Explore Real-time Analytics
Airbnb Seasonality Analysis & Trends in Wisconsin Dells (2026)
Peak Season (July, August, June)
- Revenue averages $5,810 per month
- Occupancy rates average 44.8%
- Daily rates average $366
Shoulder Season
- Revenue averages $2,957 per month
- Occupancy maintains around 29.8%
- Daily rates hold near $296
Low Season (February, April, November)
- Revenue drops to average $2,245 per month
- Occupancy decreases to average 25.5%
- Daily rates adjust to average $281
Seasonality Insights for Wisconsin Dells
- The Airbnb seasonality in Wisconsin Dells shows highly seasonal trends requiring careful strategy. While the sections above show seasonal averages, it's also insightful to look at the extremes:
- During the high season, the absolute peak month showcases Wisconsin Dells's highest earning potential, with monthly revenues capable of climbing to $6,696, occupancy reaching a high of 49.0%, and ADRs peaking at $382.
- Conversely, the slowest single month of the year, typically falling within the low season, marks the market's lowest point. In this month, revenue might dip to $1,975, occupancy could drop to 24.4%, and ADRs may adjust down to $270.
- Understanding both the seasonal averages and these monthly peaks and troughs in revenue, occupancy, and ADR is crucial for maximizing your Airbnb profit potential in Wisconsin Dells.
Seasonal Strategies for Maximizing Profit
- Peak Season: Maximize revenue through premium pricing and potentially longer minimum stays. Ensure high availability.
- Low Season: Offer competitive pricing, special promotions (e.g., extended stay discounts), and flexible cancellation policies. Target off-season travelers like remote workers or budget-conscious guests.
- Shoulder Seasons: Implement dynamic pricing that balances peak and low rates. Target weekend travelers or specific events. Offer slightly more flexible terms than peak season.
- Regularly analyze your own performance against these Wisconsin Dells seasonality benchmarks and adjust your pricing and availability strategy accordingly.
Best Areas for Airbnb Investment in Wisconsin Dells (2026)
Exploring the top neighborhoods for short-term rentals in Wisconsin Dells? This section highlights key areas, outlining why they are attractive for hosts and guests, along with notable local attractions. Consider these locations based on your target guest profile and investment strategy.
| Neighborhood / Area | Why Host Here? (Target Guests & Appeal) | Key Attractions & Landmarks |
|---|---|---|
| Downtown Wisconsin Dells | The heart of the city, filled with shops, restaurants, and attractions. Ideal for visitors looking to explore the local culture and entertainment options within walking distance. | Wisconsin Dells Riverwalk, Kalahari Waterparks, Del-Bar Restaurant, Ripley's Believe It or Not!, Knuckleheads Trampoline Park, The Dells Boat Tours |
| Lake Delton | A serene and scenic area known for its beautiful lake and water activities. Perfect for families and couples looking to relax by the water. | Lake Delton, Resort Water Parks, Glacial River Trail, Canyon Creek Riding Stables, Wisconsin Dells Scenic Lagoon Tours, Mini Golf Courses |
| Theme Park Area | Home to some of the biggest water parks and amusement parks, this area attracts thrill-seekers and families looking for fun activities. | Noah's Ark Waterpark, Mt. Olympus Water & Theme Park, Wizard Quest, Pirates Cove Adventure Golf, Ho-Chunk Gaming, Ghost Outpost |
| The Narrows | A quieter residential area with easy access to outdoor activities. Great for guests looking for nature and tranquility. | Dells of the Wisconsin River, State Park canoeing, Hiking trails, Wildlife watching, Fishing spots, Picnic areas |
| North Wisconsin Dells | An area known for more secluded stays and nature. Great for those wanting to escape the hustle and bustle while still being close to attractions. | Rocky Arbor State Park, Riverwalk trails, Fishing on the Wisconsin River, Aerial Adventures, Nature Tours, Local wineries |
| East Wisconsin Dells | Close to the main attractions but offers a more residential feel, appealing to families looking for spacious accommodations. | Chula Vista Resort, Dells Ducks Tours, Splash Universe Waterpark, Shopping Outlets, Riverside Park, Plenty of dining options |
| South Shore Drive | A picturesque area along the river, ideal for visitors seeking beautiful views and a relaxing atmosphere, popular for romantic getaways. | Riverfront parks, Boat rentals, Walking trails, Scenic viewpoint, Cafes with outdoor seating, Nearby vineyards |
| Western Wisconsin Dells | Less touristy, this area offers unique local experiences and a chance to interact with the local community, good for longer stays. | Local farmers markets, Artisan shops, Community parks, Bicycle touring routes, Culinary workshops, Nature immersion experiences |
Understanding Airbnb License Requirements & STR Laws in Wisconsin Dells (2026)
While Wisconsin Dells, Wisconsin, United States currently shows low STR regulations, specific Airbnb license requirements might still exist or change. Always verify the latest short term rental regulations and Airbnb license requirements directly with local government authorities for Wisconsin Dells to ensure full compliance before hosting.
(Source: AirROI data, 2026, finding no licensed listings among those analyzed)
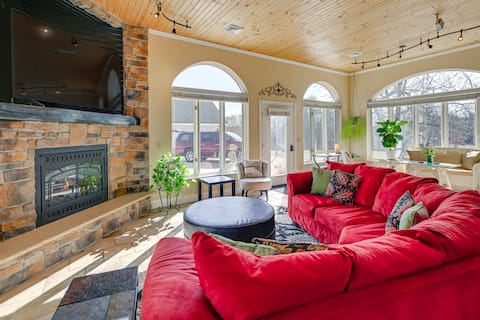
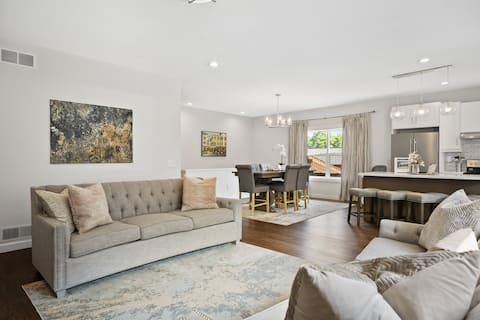
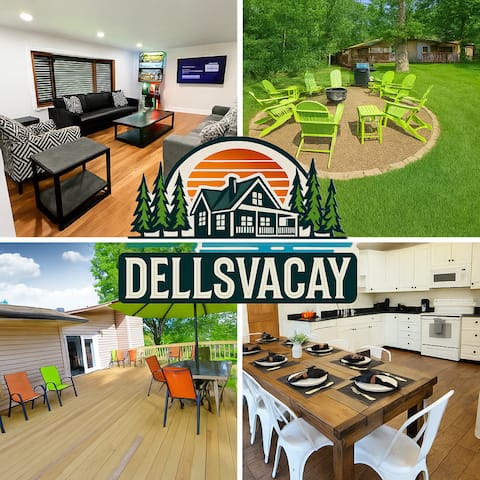
Top Performing Airbnb Properties in Wisconsin Dells (2026)
Benchmark your potential! Explore examples of top-performing Airbnb properties in Wisconsin Dellsbased on Trailing Twelve Month (TTM) revenue. Analyze their characteristics, revenue, occupancy rate, and ADR to understand what drives success in this market.
Large Home w/ Indoor Basketball Court + Game Room!
Entire Place • 8 bedrooms

Giant Dells Vacation House - sleeps 20 - ~4k sqft
Entire Place • 8 bedrooms
Spacious 6BR less than 10 min walk to DT WI Dells!
Entire Place • 6 bedrooms

Log Gables, Deer Run Estate, 5 Bdrm
Entire Place • 5 bedrooms
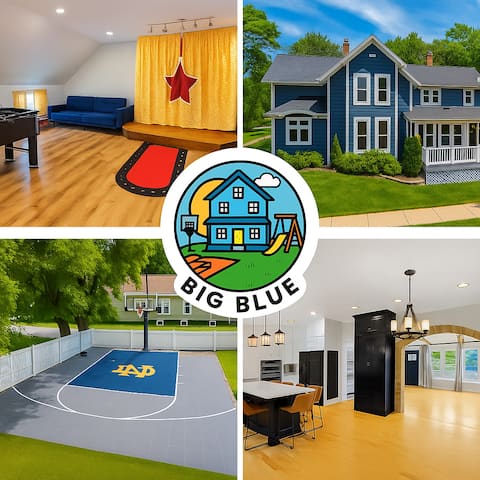
BigBlue | Downtown | Arcade | Basktball | Playgrnd
Entire Place • 5 bedrooms
All Decked Out | Arcade Games | 5 BR | FirePit
Entire Place • 5 bedrooms
Note: Performance varies based on location, size, amenities, seasonality, and management quality. Data reflects the past 12 months.
Top Performing Airbnb Hosts in Wisconsin Dells (2026)
Learn from the best! This table showcases top-performing Airbnb hosts in Wisconsin Dells based on the number of properties managed and estimated total revenue over the past year. Analyze their scale and performance metrics.
| Host Name | Properties | Grossing Revenue | Stay Reviews | Avg Rating |
|---|---|---|---|---|
| Destination Dells | 18 | $668,586 | 633 | 4.86/5.0 |
| Rich | 19 | $501,382 | 2431 | 4.66/5.0 |
| CVR Management | 19 | $440,859 | 280 | 4.16/5.0 |
| Ashley | 4 | $397,148 | 795 | 4.92/5.0 |
| Joseph | 3 | $262,649 | 114 | 4.91/5.0 |
| PMI Northwoods | 7 | $202,868 | 47 | 4.98/5.0 |
| Melissa | 4 | $197,818 | 199 | 4.82/5.0 |
| Jeremy | 3 | $196,326 | 168 | 4.98/5.0 |
| Evolve | 1 | $193,887 | 83 | 4.96/5.0 |
| Kristina | 10 | $170,347 | 419 | 4.45/5.0 |
Analyzing the strategies of top hosts, such as their property selection, pricing, and guest communication, can offer valuable lessons for optimizing your own Airbnb operations in Wisconsin Dells.
Dive Deeper: Advanced Wisconsin Dells STR Market Data (2026)
Ready to unlock more insights? AirROI provides access to advanced metrics and comprehensive Airbnb data for Wisconsin Dells. Explore detailed analytics beyond this report to refine your investment strategy, optimize pricing, and maximize your vacation rental profits.
Explore Advanced MetricsWisconsin Dells Short-Term Rental Market Composition (2026): Property & Room Types
Room Type Distribution
Property Type Distribution
Market Composition Insights for Wisconsin Dells
- The Wisconsin Dells Airbnb market composition is heavily skewed towards Entire Home/Apt listings, which make up 85.2% of the 229 active rentals. This indicates strong guest preference for privacy and space.
- Looking at the property type distribution in Wisconsin Dells, Apartment/Condo properties are the most common (62%), reflecting the local real estate landscape.
- Houses represent a significant 21% portion, catering likely to families or larger groups.
- The presence of 12.2% Hotel/Boutique listings indicates integration with traditional hospitality.
- Smaller segments like outdoor/unique, others, unique stays (combined 4.8%) offer potential for unique stay experiences.
Wisconsin Dells Airbnb Room Capacity Analysis (2026): Bedroom Distribution
Distribution of Listings by Number of Bedrooms
Room Capacity Insights for Wisconsin Dells
- The dominant room capacity in Wisconsin Dells is 2 bedrooms listings, making up 29.3% of the market. This suggests a strong demand for properties suitable for couples or solo travelers.
- Together, 2 bedrooms and 1 bedroom properties represent 52.9% of the active Airbnb listings in Wisconsin Dells, indicating a high concentration in these sizes.
- A significant 30.6% of listings offer 3+ bedrooms, catering to larger groups and families seeking more space in Wisconsin Dells.
Wisconsin Dells Vacation Rental Guest Capacity Trends (2026)
Distribution of Listings by Guest Capacity
Guest Capacity Insights for Wisconsin Dells
- The most common guest capacity trend in Wisconsin Dells vacation rentals is listings accommodating 8+ guests (48%). This suggests the primary traveler segment is likely larger groups.
- Properties designed for 8+ guests and 6 guests dominate the Wisconsin Dells STR market, accounting for 77.3% of listings.
- 79.0% of properties accommodate 6+ guests, serving the market segment for larger families or group travel in Wisconsin Dells.
- On average, properties in Wisconsin Dells are equipped to host 6.4 guests.
Wisconsin Dells Airbnb Booking Patterns (2026): Available vs. Booked Days
Available Days Distribution
Booked Days Distribution
Booking Pattern Insights for Wisconsin Dells
- The most common availability pattern in Wisconsin Dells falls within the 271-366 days range, representing 62.9% of listings. This suggests many properties have significant open periods on their calendars.
- Approximately 90.0% of listings show high availability (181+ days open annually), indicating potential for increased bookings or specific owner usage patterns.
- For booked days, the 31-90 days range is most frequent in Wisconsin Dells (37.1%), reflecting common guest stay durations or potential owner blocking patterns.
- A notable 10.9% of properties secure long booking periods (181+ days booked per year), highlighting successful long-term rental strategies or significant owner usage.
Wisconsin Dells Airbnb Minimum Stay Requirements Analysis
Distribution of Listings by Minimum Night Requirement
1 Night
120 listings
52.4% of total
2 Nights
65 listings
28.4% of total
3 Nights
1 listings
0.4% of total
4-6 Nights
1 listings
0.4% of total
30+ Nights
42 listings
18.3% of total
Key Insights
- The most prevalent minimum stay requirement in Wisconsin Dells is 1 Night, adopted by 52.4% of listings. This highlights the market's preference for shorter, flexible bookings.
- A strong majority (80.8%) of the Wisconsin Dells Airbnb data shows acceptance of very short stays (1-2 nights), indicating a dynamic, high-turnover market.
- A significant segment (18.3%) caters to monthly stays (30+ nights) in Wisconsin Dells, pointing to opportunities in the extended-stay market.
Recommendations
- Align with the market by considering a 1 Night minimum stay, as 52.4% of Wisconsin Dells hosts use this setting.
- Explore offering discounts for stays of 30+ nights to attract the 18.3% of the market seeking extended stays.
- Adjust minimum nights based on seasonality – potentially shorter during low season and longer during peak demand periods in Wisconsin Dells.
Wisconsin Dells Airbnb Cancellation Policy Trends Analysis (2026)
Super Strict 30 Days
6 listings
2.6% of total
Limited
18 listings
7.9% of total
Flexible
20 listings
8.7% of total
Moderate
99 listings
43.2% of total
Firm
66 listings
28.8% of total
Strict
20 listings
8.7% of total
Cancellation Policy Insights for Wisconsin Dells
- The prevailing Airbnb cancellation policy trend in Wisconsin Dells is Moderate, used by 43.2% of listings.
- There's a relatively balanced mix between guest-friendly (51.9%) and stricter (37.5%) policies, offering choices for different guest needs.
- Strict cancellation policies are quite rare (8.7%), potentially making listings with this policy less competitive unless justified by high demand or property type.
Recommendations for Hosts
- Consider adopting a Moderate policy to align with the 43.2% market standard in Wisconsin Dells.
- Using a Strict policy might deter some guests, as only 8.7% of listings use it. Evaluate if potential revenue protection outweighs possible lower booking rates.
- Regularly review your cancellation policy against competitors and market demand shifts in Wisconsin Dells.
Wisconsin Dells STR Booking Lead Time Analysis (2026)
Average Booking Lead Time by Month
Booking Lead Time Insights for Wisconsin Dells
- The overall average booking lead time for vacation rentals in Wisconsin Dells is 44 days.
- Guests book furthest in advance for stays during July (average 60 days), likely coinciding with peak travel demand or local events.
- The shortest booking windows occur for stays in January (average 27 days), indicating more last-minute travel plans during this time.
- Seasonally, Summer (57 days avg.) sees the longest lead times, while Winter (32 days avg.) has the shortest, reflecting typical travel planning cycles.
Recommendations for Hosts
- Use the overall average lead time (44 days) as a baseline for your pricing and availability strategy in Wisconsin Dells.
- For July stays, consider implementing length-of-stay discounts or slightly higher rates for bookings made less than 60 days out to capitalize on advance planning.
- Target marketing efforts for the Summer season well in advance (at least 57 days) to capture early planners.
- Monitor your own booking lead times against these Wisconsin Dells averages to identify opportunities for dynamic pricing adjustments.
Popular & Essential Airbnb Amenities in Wisconsin Dells (2026)
Amenity Prevalence
Amenity Insights for Wisconsin Dells
- Essential amenities in Wisconsin Dells that guests expect include: Wifi, TV, Air conditioning, Smoke alarm, Heating. Lacking these (any) could significantly impact bookings.
- Popular amenities like Free parking on premises, Microwave, Coffee maker are common but not universal. Offering these can provide a competitive edge.
Recommendations for Hosts
- Ensure your listing includes all essential amenities for Wisconsin Dells: Wifi, TV, Air conditioning, Smoke alarm, Heating.
- Prioritize adding missing essentials: Wifi, TV, Air conditioning, Smoke alarm, Heating.
- Consider adding popular differentiators like Free parking on premises or Microwave to increase appeal.
- Highlight unique or less common amenities you offer (e.g., hot tub, dedicated workspace, EV charger) in your listing description and photos.
- Regularly check competitor amenities in Wisconsin Dells to stay competitive.
Wisconsin Dells Airbnb Guest Demographics & Profile Analysis (2026)
Guest Profile Summary for Wisconsin Dells
- The typical guest profile for Airbnb in Wisconsin Dells consists of primarily domestic travelers (99%), often arriving from nearby Chicago, typically belonging to the Post-2000s (Gen Z/Alpha) group (50%), primarily speaking English or Spanish.
- Domestic travelers account for 99.2% of guests.
- Key international markets include United States (99.2%) and Canada (0.2%).
- Top languages spoken are English (73%) followed by Spanish (15.3%).
- A significant demographic segment is the Post-2000s (Gen Z/Alpha) group, representing 50% of guests.
Recommendations for Hosts
- Target domestic marketing efforts towards travelers from Chicago and Milwaukee.
- Tailor amenities and listing descriptions to appeal to the dominant Post-2000s (Gen Z/Alpha) demographic (e.g., highlight fast WiFi, smart home features, local guides).
- Highlight unique local experiences or amenities relevant to the primary guest profile.
- Consider seasonal promotions aligned with peak travel times for key origin markets.
Nearby Short-Term Rental Market Comparison
How does the Wisconsin Dells Airbnb market stack up against its neighbors? Compare key performance metrics like average monthly revenue, ADR, and occupancy rates in surrounding areas to understand the broader regional STR landscape.
| Market | Active Properties | Monthly Revenue | Daily Rate | Avg. Occupancy |
|---|---|---|---|---|
| Town of Sugar Creek | 18 | $9,830 | $662.90 | 53% |
| Monona | 29 | $6,957 | $648.65 | 49% |
| Town of Newton | 11 | $6,557 | $770.72 | 42% |
| Town of Wilson | 16 | $6,450 | $620.70 | 43% |
| Twin Lakes | 35 | $6,152 | $547.54 | 43% |
| Town of Germantown | 66 | $5,208 | $527.82 | 37% |
| Lake Geneva | 209 | $5,014 | $473.36 | 41% |
| Town of Geneva | 63 | $5,012 | $448.89 | 43% |
| McHenry | 32 | $4,982 | $463.12 | 44% |
| Suamico | 13 | $4,905 | $473.88 | 44% |