Phan Thiet Airbnb Market Analysis 2026: Short Term Rental Data & Vacation Rental Statistics in Bình Thuận, Vietnam
Is Airbnb profitable in Phan Thiet in 2026? Explore comprehensive Airbnb analytics for Phan Thiet, Bình Thuận, Vietnam to uncover income potential. This 2026 STR market report for Phan Thiet, based on AirROI data from February 2025 to January 2026, reveals key trends in the niche market of 51 active listings.
Whether you're considering an Airbnb investment in Phan Thiet, optimizing your existing vacation rental, or exploring rental arbitrage opportunities, understanding the Phan Thiet Airbnb data is crucial. Leveraging the low regulation environment is key to maximizing your short term rental income potential. Let's dive into the specifics.
Key Phan Thiet Airbnb Performance Metrics Overview
Monthly Airbnb Revenue Variations & Income Potential in Phan Thiet (2026)
Understanding the monthly revenue variations for Airbnb listings in Phan Thiet is key to maximizing your short term rental income potential. Seasonality significantly impacts earnings. Our analysis, based on data from the past 12 months, shows that the peak revenue month for STRs in Phan Thiet is typically December, while May often presents the lowest earnings, highlighting opportunities for strategic pricing adjustments during shoulder and low seasons. Explore the typical Airbnb income in Phan Thiet across different performance tiers:
- Best-in-class properties (Top 10%) achieve $1,164+ monthly, often utilizing dynamic pricing and superior guest experiences.
- Strong performing properties (Top 25%) earn $533 or more, indicating effective management and desirable locations/amenities.
- Typical properties (Median) generate around $197 per month, representing the average market performance.
- Entry-level properties (Bottom 25%) see earnings around $97, often with potential for optimization.
Average Monthly Airbnb Earnings Trend in Phan Thiet
Phan Thiet Airbnb Occupancy Rate Trends (2026)
Maximize your bookings by understanding the Phan Thiet STR occupancy trends. Seasonal demand shifts significantly influence how often properties are booked. Typically, Decembersees the highest demand (peak season occupancy), while May experiences the lowest (low season). Effective strategies, like adjusting minimum stays or offering promotions, can boost occupancy during slower periods. Here's how different property tiers perform in Phan Thiet:
- Best-in-class properties (Top 10%) achieve 38%+ occupancy, indicating high desirability and potentially optimized availability.
- Strong performing properties (Top 25%) maintain 25% or higher occupancy, suggesting good market fit and guest satisfaction.
- Typical properties (Median) have an occupancy rate around 13%.
- Entry-level properties (Bottom 25%) average 8% occupancy, potentially facing higher vacancy.
Average Monthly Occupancy Rate Trend in Phan Thiet
Average Daily Rate (ADR) Airbnb Trends in Phan Thiet (2026)
Effective short term rental pricing strategy in Phan Thiet involves understanding monthly ADR fluctuations. The Average Daily Rate (ADR) for Airbnb in Phan Thiet typically peaks in October and dips lowest during July. Leveraging Airbnb dynamic pricing tools or strategies based on this seasonality can significantly boost revenue. Here's a look at the typical nightly rates achieved:
- Best-in-class properties (Top 10%) command rates of $149+ per night, often due to premium features or locations.
- Strong performing properties (Top 25%) achieve nightly rates of $114 or more.
- Typical properties (Median) charge around $36 per night.
- Entry-level properties (Bottom 25%) earn around $24 per night.
Average Daily Rate (ADR) Trend by Month in Phan Thiet
Get Live Phan Thiet Market Intelligence 👇
Explore Real-time Analytics
Airbnb Seasonality Analysis & Trends in Phan Thiet (2026)
Peak Season (December, January, June)
- Revenue averages $662 per month
- Occupancy rates average 26.4%
- Daily rates average $78
Shoulder Season
- Revenue averages $283 per month
- Occupancy maintains around 13.7%
- Daily rates hold near $73
Low Season (February, March, April)
- Revenue drops to average $0 per month
- Occupancy decreases to average 0.0%
- Daily rates adjust to average $71
Seasonality Insights for Phan Thiet
- The Airbnb seasonality in Phan Thiet shows highly seasonal trends requiring careful strategy. While the sections above show seasonal averages, it's also insightful to look at the extremes:
- During the high season, the absolute peak month showcases Phan Thiet's highest earning potential, with monthly revenues capable of climbing to $771, occupancy reaching a high of 26.8%, and ADRs peaking at $84.
- Conversely, the slowest single month of the year, typically falling within the low season, marks the market's lowest point. In this month, revenue might dip to $0, occupancy could drop to 0.0%, and ADRs may adjust down to $64.
- Understanding both the seasonal averages and these monthly peaks and troughs in revenue, occupancy, and ADR is crucial for maximizing your Airbnb profit potential in Phan Thiet.
Seasonal Strategies for Maximizing Profit
- Peak Season: Maximize revenue through premium pricing and potentially longer minimum stays. Ensure high availability.
- Low Season: Offer competitive pricing, special promotions (e.g., extended stay discounts), and flexible cancellation policies. Target off-season travelers like remote workers or budget-conscious guests.
- Shoulder Seasons: Implement dynamic pricing that balances peak and low rates. Target weekend travelers or specific events. Offer slightly more flexible terms than peak season.
- Regularly analyze your own performance against these Phan Thiet seasonality benchmarks and adjust your pricing and availability strategy accordingly.
Best Areas for Airbnb Investment in Phan Thiet (2026)
Exploring the top neighborhoods for short-term rentals in Phan Thiet? This section highlights key areas, outlining why they are attractive for hosts and guests, along with notable local attractions. Consider these locations based on your target guest profile and investment strategy.
| Neighborhood / Area | Why Host Here? (Target Guests & Appeal) | Key Attractions & Landmarks |
|---|---|---|
| Mui Ne | Famous for its beautiful beaches, water sports, and scenic sand dunes. A top destination for tourists looking for relaxation and adventure. | Mui Ne Sand Dunes, Red Sand Dunes, Mui Ne Beach, Fairy Stream, Hon Rom Beach, Water Sports Center |
| Phan Thiet City Center | Cultural and economic hub of Phan Thiet with local markets, eateries, and historical sites. Great for travelers interested in local culture and cuisine. | Duc Thanh School, Phan Thiet Market, Van Thuy Tu Temple, Cham Towers, Local seafood restaurants, Grocery stores |
| Tropical Beach | A perfect spot for a quiet getaway with fewer crowds, beautiful scenery, and excellent beach access. Ideal for nature lovers and families. | Tropical Beach, Beachfront resorts, Coastal hiking trails, Snorkeling spots, Secluded coves, Local cafes |
| Ke Ga | Known for its scenic lighthouse and beautiful coastline. Attracts tourists for its natural beauty and calm atmosphere. | Ke Ga Lighthouse, Mint Island, Clear water beaches, Fishing villages, Lighthouse scenery, Beachfront resorts |
| Poshanu Cham Towers | A historical site that showcases the Cham culture with ancient ruins and stunning views. Attracts tourists interested in history and culture. | Poshanu Cham Towers, Cultural exhibitions, Photography spots, Heritage trails, Local artisan markets, Scenic viewpoints |
| Coco Beach | A serene beach area popular with families and couples seeking a peaceful retreat with excellent amenities. | Coco Beach, Beachfront dining, Water activities, Family-friendly attractions, Relaxing atmosphere, Cozy beach bars |
| Hon Rom | Famous for its striking beach views and traditional fishing culture. Offers a unique experience for travelers seeking tranquility and local life. | Hon Rom Beach, Fishing experiences, Local seafood markets, Water sports, Beautiful sunrise views, Relaxation spots |
| Bai Da Ong Dia | A beautiful beach area with crystal clear waters and vibrant marine life, perfect for snorkeling and relaxation. | Bai Da Ong Dia Beach, Snorkeling spots, Beachside restaurants, Quiet beaches, Water sports, Local nature attractions |
Understanding Airbnb License Requirements & STR Laws in Phan Thiet (2026)
While Phan Thiet, Bình Thuận, Vietnam currently shows low STR regulations, specific Airbnb license requirements might still exist or change. Always verify the latest short term rental regulations and Airbnb license requirements directly with local government authorities for Phan Thiet to ensure full compliance before hosting.
(Source: AirROI data, 2026, finding no licensed listings among those analyzed)
Top Performing Airbnb Properties in Phan Thiet (2026)
Benchmark your potential! Explore examples of top-performing Airbnb properties in Phan Thietbased on Trailing Twelve Month (TTM) revenue. Analyze their characteristics, revenue, occupancy rate, and ADR to understand what drives success in this market.

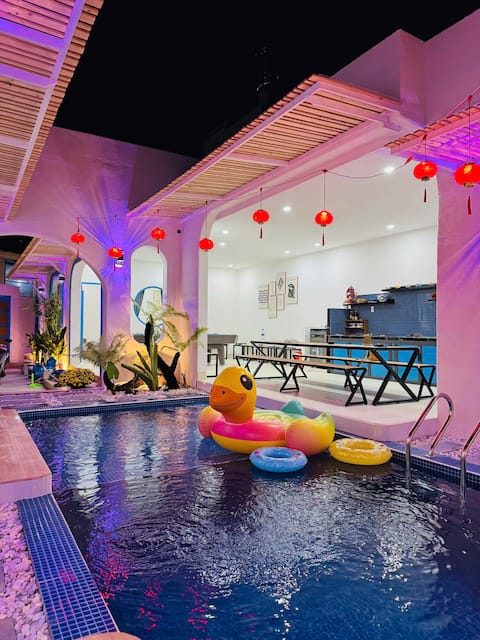
Holiday 4-bedroom Coastal Gem: 300sqm Villa
Entire Place • 4 bedrooms
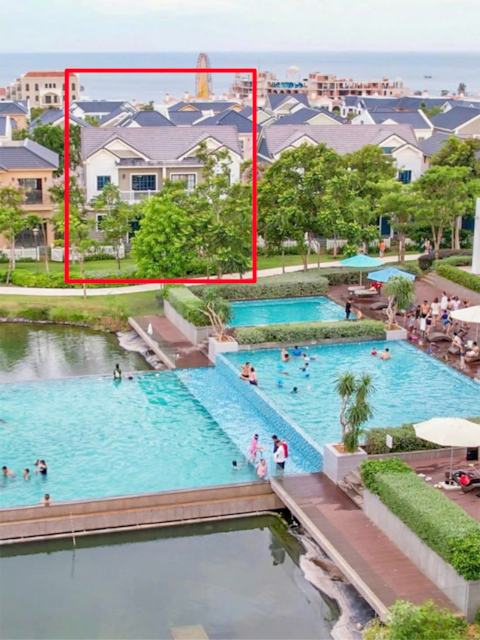
Mon House 2 with Pool Phan Thiet
Entire Place • 4 bedrooms

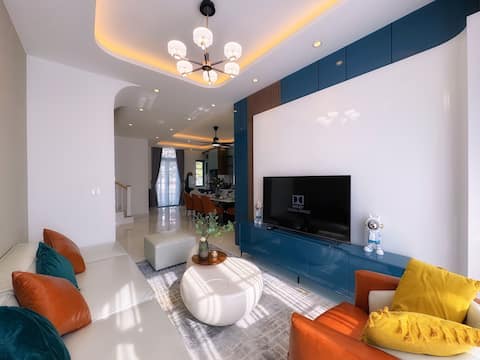
Holiday 3-Bedroom Delightful Villa @ Phan Thiet
Entire Place • 3 bedrooms
D.CAO Villas Classia 4 Bedrooms next to the pool
Entire Place • 4 bedrooms
D.CAO Villas 4 Bedrooms Santorini sea view
Entire Place • 4 bedrooms

D.CAO Villas 4 Bedrooms Santorini sea view
Entire Place • 4 bedrooms
Note: Performance varies based on location, size, amenities, seasonality, and management quality. Data reflects the past 12 months.
Top Performing Airbnb Hosts in Phan Thiet (2026)
Learn from the best! This table showcases top-performing Airbnb hosts in Phan Thiet based on the number of properties managed and estimated total revenue over the past year. Analyze their scale and performance metrics.
| Host Name | Properties | Grossing Revenue | Stay Reviews | Avg Rating |
|---|---|---|---|---|
| Thanh | 3 | $22,717 | 31 | 5.00/5.0 |
| Junie Cao | 5 | $21,015 | 22 | 4.84/5.0 |
| Bryan | 1 | $7,787 | 6 | 4.83/5.0 |
| Phan | 13 | $7,136 | 71 | 4.80/5.0 |
| Hoang Thi Thu | 2 | $6,403 | 20 | 5.00/5.0 |
| BB Happy Home | 4 | $5,376 | 40 | 4.91/5.0 |
| Alala Stay | 1 | $3,920 | 3 | 5.00/5.0 |
| Anh | 2 | $3,703 | 2 | Not Rated |
| Dung | 5 | $3,645 | 64 | 4.96/5.0 |
| Thuy | 1 | $2,376 | 2 | Not Rated |
Analyzing the strategies of top hosts, such as their property selection, pricing, and guest communication, can offer valuable lessons for optimizing your own Airbnb operations in Phan Thiet.
Dive Deeper: Advanced Phan Thiet STR Market Data (2026)
Ready to unlock more insights? AirROI provides access to advanced metrics and comprehensive Airbnb data for Phan Thiet. Explore detailed analytics beyond this report to refine your investment strategy, optimize pricing, and maximize your vacation rental profits.
Explore Advanced MetricsPhan Thiet Short-Term Rental Market Composition (2026): Property & Room Types
Room Type Distribution
Property Type Distribution
Market Composition Insights for Phan Thiet
- The Phan Thiet Airbnb market composition is heavily skewed towards Entire Home/Apt listings, which make up 70.6% of the 51 active rentals. This indicates strong guest preference for privacy and space.
- Looking at the property type distribution in Phan Thiet, House properties are the most common (47.1%), reflecting the local real estate landscape.
- Houses represent a significant 47.1% portion, catering likely to families or larger groups.
- The presence of 19.6% Hotel/Boutique listings indicates integration with traditional hospitality.
Phan Thiet Airbnb Room Capacity Analysis (2026): Bedroom Distribution
Distribution of Listings by Number of Bedrooms
Room Capacity Insights for Phan Thiet
- The dominant room capacity in Phan Thiet is 1 bedroom listings, making up 51% of the market. This suggests a strong demand for properties suitable for couples or solo travelers.
- Together, 1 bedroom and 4 bedrooms properties represent 66.7% of the active Airbnb listings in Phan Thiet, indicating a high concentration in these sizes.
- With over half the market (51%) consisting of studios or 1-bedroom units, Phan Thiet is particularly well-suited for individuals or couples.
- A significant 29.4% of listings offer 3+ bedrooms, catering to larger groups and families seeking more space in Phan Thiet.
Phan Thiet Vacation Rental Guest Capacity Trends (2026)
Distribution of Listings by Guest Capacity
Guest Capacity Insights for Phan Thiet
- The most common guest capacity trend in Phan Thiet vacation rentals is listings accommodating 2 guests (33.3%). This suggests the primary traveler segment is likely couples or solo travelers.
- Properties designed for 2 guests and 8+ guests dominate the Phan Thiet STR market, accounting for 62.7% of listings.
- 31.4% of properties accommodate 6+ guests, serving the market segment for larger families or group travel in Phan Thiet.
- On average, properties in Phan Thiet are equipped to host 4.1 guests.
Phan Thiet Airbnb Booking Patterns (2026): Available vs. Booked Days
Available Days Distribution
Booked Days Distribution
Booking Pattern Insights for Phan Thiet
- The most common availability pattern in Phan Thiet falls within the 271-366 days range, representing 100% of listings. This suggests many properties have significant open periods on their calendars.
- Approximately 100.0% of listings show high availability (181+ days open annually), indicating potential for increased bookings or specific owner usage patterns.
- For booked days, the 1-30 days range is most frequent in Phan Thiet (72.5%), reflecting common guest stay durations or potential owner blocking patterns.
Phan Thiet Airbnb Minimum Stay Requirements Analysis
Distribution of Listings by Minimum Night Requirement
1 Night
48 listings
94.1% of total
30+ Nights
3 listings
5.9% of total
Key Insights
- The most prevalent minimum stay requirement in Phan Thiet is 1 Night, adopted by 94.1% of listings. This highlights the market's preference for shorter, flexible bookings.
- A strong majority (94.1%) of the Phan Thiet Airbnb data shows acceptance of very short stays (1-2 nights), indicating a dynamic, high-turnover market.
Recommendations
- Align with the market by considering a 1 Night minimum stay, as 94.1% of Phan Thiet hosts use this setting.
- Explore offering discounts for stays of 30+ nights to attract the 5.9% of the market seeking extended stays.
- Adjust minimum nights based on seasonality – potentially shorter during low season and longer during peak demand periods in Phan Thiet.
Phan Thiet Airbnb Cancellation Policy Trends Analysis (2026)
Flexible
40 listings
78.4% of total
Moderate
8 listings
15.7% of total
Strict
3 listings
5.9% of total
Cancellation Policy Insights for Phan Thiet
- The prevailing Airbnb cancellation policy trend in Phan Thiet is Flexible, used by 78.4% of listings.
- The market strongly favors guest-friendly terms, with 94.1% of listings offering Flexible or Moderate policies. This suggests guests in Phan Thiet may expect booking flexibility.
- Strict cancellation policies are quite rare (5.9%), potentially making listings with this policy less competitive unless justified by high demand or property type.
Recommendations for Hosts
- Consider adopting a Flexible policy to align with the 78.4% market standard in Phan Thiet.
- Given the high prevalence of Flexible policies (78.4%), offering this can enhance booking appeal, especially during shoulder seasons.
- Using a Strict policy might deter some guests, as only 5.9% of listings use it. Evaluate if potential revenue protection outweighs possible lower booking rates.
- Regularly review your cancellation policy against competitors and market demand shifts in Phan Thiet.
Phan Thiet STR Booking Lead Time Analysis (2026)
Average Booking Lead Time by Month
Booking Lead Time Insights for Phan Thiet
- The overall average booking lead time for vacation rentals in Phan Thiet is 17 days.
- Guests book furthest in advance for stays during November (average 24 days), likely coinciding with peak travel demand or local events.
- The shortest booking windows occur for stays in April (average 0 days), indicating more last-minute travel plans during this time.
- Seasonally, Fall (18 days avg.) sees the longest lead times, while Spring (1 days avg.) has the shortest, reflecting typical travel planning cycles.
Recommendations for Hosts
- Use the overall average lead time (17 days) as a baseline for your pricing and availability strategy in Phan Thiet.
- During April, focus on last-minute booking availability and promotions, as guests book with very short notice (0 days avg.).
- Target marketing efforts for the Fall season well in advance (at least 18 days) to capture early planners.
- Monitor your own booking lead times against these Phan Thiet averages to identify opportunities for dynamic pricing adjustments.
Popular & Essential Airbnb Amenities in Phan Thiet (2026)
Amenity Prevalence
Amenity Insights for Phan Thiet
- Essential amenities in Phan Thiet that guests expect include: Wifi, Air conditioning, TV. Lacking these (any) could significantly impact bookings.
- Popular amenities like Free parking on premises, Hair dryer, Fire extinguisher are common but not universal. Offering these can provide a competitive edge.
- A pool is a highly desired but not standard amenity, making it a key feature for attracting guests seeking leisure in Phan Thiet.
Recommendations for Hosts
- Ensure your listing includes all essential amenities for Phan Thiet: Wifi, Air conditioning, TV.
- Prioritize adding missing essentials: Air conditioning, TV.
- Consider adding popular differentiators like Free parking on premises or Hair dryer to increase appeal.
- Highlight unique or less common amenities you offer (e.g., hot tub, dedicated workspace, EV charger) in your listing description and photos.
- Regularly check competitor amenities in Phan Thiet to stay competitive.
Phan Thiet Airbnb Guest Demographics & Profile Analysis (2026)
Guest Profile Summary for Phan Thiet
- The typical guest profile for Airbnb in Phan Thiet consists of predominantly international visitors (84%), with top international origins including Vietnam, typically belonging to the Post-2000s (Gen Z/Alpha) group (50%), primarily speaking English or German.
- Domestic travelers account for 15.8% of guests.
- Key international markets include United States (17.8%) and Vietnam (15.8%).
- Top languages spoken are English (44.9%) followed by German (10.3%).
- A significant demographic segment is the Post-2000s (Gen Z/Alpha) group, representing 50% of guests.
Recommendations for Hosts
- Focus marketing internationally, particularly towards travelers from Vietnam.
- Tailor amenities and listing descriptions to appeal to the dominant Post-2000s (Gen Z/Alpha) demographic (e.g., highlight fast WiFi, smart home features, local guides).
- Highlight unique local experiences or amenities relevant to the primary guest profile.
- Consider seasonal promotions aligned with peak travel times for key origin markets.
Nearby Short-Term Rental Market Comparison
How does the Phan Thiet Airbnb market stack up against its neighbors? Compare key performance metrics like average monthly revenue, ADR, and occupancy rates in surrounding areas to understand the broader regional STR landscape.
| Market | Active Properties | Monthly Revenue | Daily Rate | Avg. Occupancy |
|---|---|---|---|---|
| Phuoc Thuan Commune | 12 | $1,629 | $360.68 | 17% |
| Vũng Tàu | 637 | $332 | $91.10 | 23% |
| Dalat | 93 | $326 | $66.30 | 28% |
| Phuoc Hai Township | 21 | $325 | $189.99 | 12% |
| Phan Thiết | 311 | $281 | $80.75 | 20% |
| Đà Lạt | 932 | $274 | $56.93 | 24% |
| Bảo Lộc | 27 | $155 | $46.64 | 17% |
| Phan Rang–Tháp Chàm | 29 | $117 | $29.17 | 23% |
| Phan Rang – Tháp Chàm | 10 | $97 | $34.90 | 18% |