Bình Thạnh Airbnb Market Analysis 2026: Short Term Rental Data & Vacation Rental Statistics in Hồ Chí Minh, Vietnam
Is Airbnb profitable in Bình Thạnh in 2026? Explore comprehensive Airbnb analytics for Bình Thạnh, Hồ Chí Minh, Vietnam to uncover income potential. This 2026 STR market report for Bình Thạnh, based on AirROI data from February 2025 to January 2026, reveals key trends in the niche market of 149 active listings.
Whether you're considering an Airbnb investment in Bình Thạnh, optimizing your existing vacation rental, or exploring rental arbitrage opportunities, understanding the Bình Thạnh Airbnb data is crucial. Leveraging the low regulation environment is key to maximizing your short term rental income potential. Let's dive into the specifics.
Key Bình Thạnh Airbnb Performance Metrics Overview
Monthly Airbnb Revenue Variations & Income Potential in Bình Thạnh (2026)
Understanding the monthly revenue variations for Airbnb listings in Bình Thạnh is key to maximizing your short term rental income potential. Seasonality significantly impacts earnings. Our analysis, based on data from the past 12 months, shows that the peak revenue month for STRs in Bình Thạnh is typically December, while May often presents the lowest earnings, highlighting opportunities for strategic pricing adjustments during shoulder and low seasons. Explore the typical Airbnb income in Bình Thạnh across different performance tiers:
- Best-in-class properties (Top 10%) achieve $1,194+ monthly, often utilizing dynamic pricing and superior guest experiences.
- Strong performing properties (Top 25%) earn $816 or more, indicating effective management and desirable locations/amenities.
- Typical properties (Median) generate around $411 per month, representing the average market performance.
- Entry-level properties (Bottom 25%) see earnings around $173, often with potential for optimization.
Average Monthly Airbnb Earnings Trend in Bình Thạnh
Bình Thạnh Airbnb Occupancy Rate Trends (2026)
Maximize your bookings by understanding the Bình Thạnh STR occupancy trends. Seasonal demand shifts significantly influence how often properties are booked. Typically, Decembersees the highest demand (peak season occupancy), while May experiences the lowest (low season). Effective strategies, like adjusting minimum stays or offering promotions, can boost occupancy during slower periods. Here's how different property tiers perform in Bình Thạnh:
- Best-in-class properties (Top 10%) achieve 74%+ occupancy, indicating high desirability and potentially optimized availability.
- Strong performing properties (Top 25%) maintain 58% or higher occupancy, suggesting good market fit and guest satisfaction.
- Typical properties (Median) have an occupancy rate around 31%.
- Entry-level properties (Bottom 25%) average 14% occupancy, potentially facing higher vacancy.
Average Monthly Occupancy Rate Trend in Bình Thạnh
Average Daily Rate (ADR) Airbnb Trends in Bình Thạnh (2026)
Effective short term rental pricing strategy in Bình Thạnh involves understanding monthly ADR fluctuations. The Average Daily Rate (ADR) for Airbnb in Bình Thạnh typically peaks in December and dips lowest during July. Leveraging Airbnb dynamic pricing tools or strategies based on this seasonality can significantly boost revenue. Here's a look at the typical nightly rates achieved:
- Best-in-class properties (Top 10%) command rates of $101+ per night, often due to premium features or locations.
- Strong performing properties (Top 25%) achieve nightly rates of $69 or more.
- Typical properties (Median) charge around $47 per night.
- Entry-level properties (Bottom 25%) earn around $26 per night.
Average Daily Rate (ADR) Trend by Month in Bình Thạnh
Get Live Bình Thạnh Market Intelligence 👇

Explore Real-time Analytics
Airbnb Seasonality Analysis & Trends in Bình Thạnh (2026)
Peak Season (December, June, November)
- Revenue averages $742 per month
- Occupancy rates average 44.1%
- Daily rates average $57
Shoulder Season
- Revenue averages $538 per month
- Occupancy maintains around 32.8%
- Daily rates hold near $56
Low Season (February, March, April)
- Revenue drops to average $0 per month
- Occupancy decreases to average 0.0%
- Daily rates adjust to average $55
Seasonality Insights for Bình Thạnh
- The Airbnb seasonality in Bình Thạnh shows highly seasonal trends requiring careful strategy. While the sections above show seasonal averages, it's also insightful to look at the extremes:
- During the high season, the absolute peak month showcases Bình Thạnh's highest earning potential, with monthly revenues capable of climbing to $814, occupancy reaching a high of 47.4%, and ADRs peaking at $60.
- Conversely, the slowest single month of the year, typically falling within the low season, marks the market's lowest point. In this month, revenue might dip to $0, occupancy could drop to 0.0%, and ADRs may adjust down to $53.
- Understanding both the seasonal averages and these monthly peaks and troughs in revenue, occupancy, and ADR is crucial for maximizing your Airbnb profit potential in Bình Thạnh.
Seasonal Strategies for Maximizing Profit
- Peak Season: Maximize revenue through premium pricing and potentially longer minimum stays. Ensure high availability.
- Low Season: Offer competitive pricing, special promotions (e.g., extended stay discounts), and flexible cancellation policies. Target off-season travelers like remote workers or budget-conscious guests.
- Shoulder Seasons: Implement dynamic pricing that balances peak and low rates. Target weekend travelers or specific events. Offer slightly more flexible terms than peak season.
- Regularly analyze your own performance against these Bình Thạnh seasonality benchmarks and adjust your pricing and availability strategy accordingly.
Best Areas for Airbnb Investment in Bình Thạnh (2026)
Exploring the top neighborhoods for short-term rentals in Bình Thạnh? This section highlights key areas, outlining why they are attractive for hosts and guests, along with notable local attractions. Consider these locations based on your target guest profile and investment strategy.
| Neighborhood / Area | Why Host Here? (Target Guests & Appeal) | Key Attractions & Landmarks |
|---|---|---|
| Vang Xanh | A burgeoning area in Bình Thạnh known for its modern apartments and proximity to the Saigon River. Ideal for tourists wanting a quieter experience while still close to the action. | Saigon River, Trường Sa Park, Nguyễn Huệ Walking Street, Bitexco Financial Tower, Bình Quới Tourist Village |
| Thao Dien | An expat-friendly neighborhood with a range of international restaurants and cafes. Popular among families and long-term visitors looking for a vibrant community atmosphere. | Thao Dien Village, Saigon Outcast, An Phu Market, Artinus 3D Art Museum, The Factory Contemporary Arts Centre |
| Chan Phuoc Loc | A scenic and residential part of Bình Thạnh, great for families and business travelers who prefer a more local experience while being close to the city center. | Binh Quoi Tourist Village, Vinhomes Central Park, Landmark 81, Saigon Zoo and Botanical Gardens, Pho Binh |
| Phu Nhuan | A lively area that mixes traditional Vietnamese culture with modern conveniences, attracting both tourists and locals. | Nguyễn Văn Trỗi Market, Tan Son Nhat Airport, Cong Hoa Flower Market, Chau Doc Market, Pagoda of the Celestial Lady |
| HM City Tower | A rising business area with excellent transport links, perfect for business travelers and those looking for an urban lifestyle near amenities. | Binh Thanh Market, Diamond Plaza, Ho Chi Minh City Museum, Jade Emperor Pagoda, Museum of Vietnamese History |
| Tan Cang | Centrally located near the river, this area offers stunning views and is ideal for those interested in water activities and local dining. | Tan Cang Boat Station, Yachting Club, Sai Gon Pearl, Keangnam Landmark 72, Riverside Park |
| Saigon Pearl | Known for its luxurious high-rise developments and riverside views, this area attracts affluent visitors looking for a high-end experience. | Saigon Pearl Plaza, Van Thanh Tourist Area, Riverside Walk, Indochina Plaza, The Morning Star |
| An Phu | A growing neighborhood that offers both local charm and modern conveniences, sought after by expats and tourists wanting a more laid-back experience. | An Phu Market, Crescent Mall, Saigon River Park, Green Square Park, Vincom Mega Mall |
Understanding Airbnb License Requirements & STR Laws in Bình Thạnh (2026)
While Bình Thạnh, Hồ Chí Minh, Vietnam currently shows low STR regulations, specific Airbnb license requirements might still exist or change. Always verify the latest short term rental regulations and Airbnb license requirements directly with local government authorities for Bình Thạnh to ensure full compliance before hosting.
(Source: AirROI data, 2026, finding no licensed listings among those analyzed)
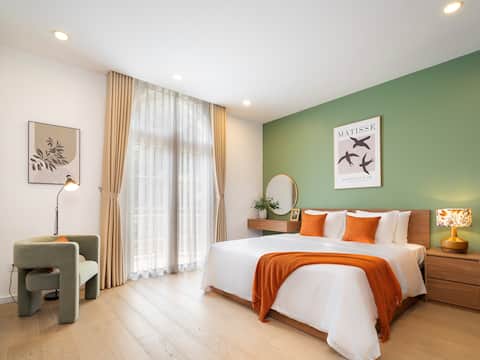
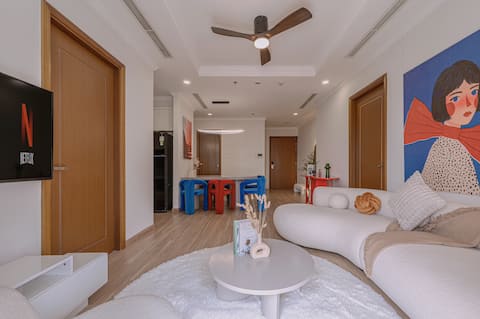
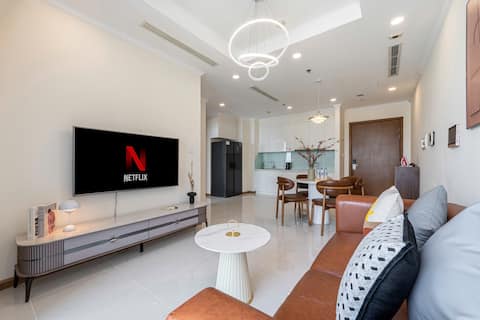
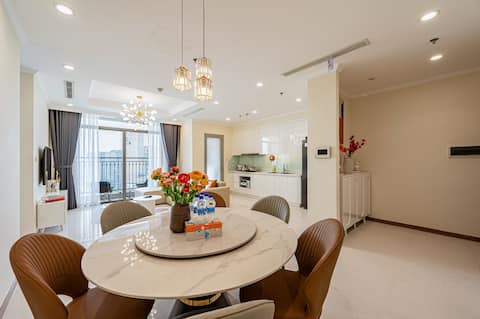
Top Performing Airbnb Properties in Bình Thạnh (2026)
Benchmark your potential! Explore examples of top-performing Airbnb properties in Bình Thạnhbased on Trailing Twelve Month (TTM) revenue. Analyze their characteristics, revenue, occupancy rate, and ADR to understand what drives success in this market.

6BR Luxury Villa • Free Pickup ¤ BBQ + City Center
Entire Place • 6 bedrooms
Luxury Villa Stay by the Saigon River in Central
Entire Place • 6 bedrooms

Landmark 5| 3Brs next Landmark 81| City View
Entire Place • 3 bedrooms
3Brs Sunset view Vinhomes Central Park
Entire Place • 3 bedrooms
2 bedrooms city view Landmark 6 Vinhome Central SG
Entire Place • 2 bedrooms
3Br condo city view landmark 5 VinhomeCentral Park
Entire Place • 3 bedrooms
Note: Performance varies based on location, size, amenities, seasonality, and management quality. Data reflects the past 12 months.
Top Performing Airbnb Hosts in Bình Thạnh (2026)
Learn from the best! This table showcases top-performing Airbnb hosts in Bình Thạnh based on the number of properties managed and estimated total revenue over the past year. Analyze their scale and performance metrics.
| Host Name | Properties | Grossing Revenue | Stay Reviews | Avg Rating |
|---|---|---|---|---|
| Rosy | 9 | $63,136 | 179 | 4.95/5.0 |
| David And Manh | 1 | $45,306 | 37 | 4.92/5.0 |
| Brian | 6 | $36,531 | 56 | 4.86/5.0 |
| CR Concept | 3 | $33,981 | 64 | 4.97/5.0 |
| Trang | 1 | $28,753 | 5 | 5.00/5.0 |
| Michael | 8 | $22,911 | 64 | 4.61/5.0 |
| Elevate | 4 | $22,033 | 55 | 4.81/5.0 |
| Trang | 7 | $20,329 | 90 | 4.87/5.0 |
| S&D | 6 | $16,321 | 110 | 4.99/5.0 |
| Sum | 2 | $15,805 | 29 | 4.78/5.0 |
Analyzing the strategies of top hosts, such as their property selection, pricing, and guest communication, can offer valuable lessons for optimizing your own Airbnb operations in Bình Thạnh.
Dive Deeper: Advanced Bình Thạnh STR Market Data (2026)
Ready to unlock more insights? AirROI provides access to advanced metrics and comprehensive Airbnb data for Bình Thạnh. Explore detailed analytics beyond this report to refine your investment strategy, optimize pricing, and maximize your vacation rental profits.
Explore Advanced MetricsBình Thạnh Short-Term Rental Market Composition (2026): Property & Room Types
Room Type Distribution
Property Type Distribution
Market Composition Insights for Bình Thạnh
- The Bình Thạnh Airbnb market composition is heavily skewed towards Entire Home/Apt listings, which make up 89.9% of the 149 active rentals. This indicates strong guest preference for privacy and space.
- Looking at the property type distribution in Bình Thạnh, Apartment/Condo properties are the most common (96%), reflecting the local real estate landscape.
- Smaller segments like house, hotel/boutique (combined 4.1%) offer potential for unique stay experiences.
Bình Thạnh Airbnb Room Capacity Analysis (2026): Bedroom Distribution
Distribution of Listings by Number of Bedrooms
Room Capacity Insights for Bình Thạnh
- The dominant room capacity in Bình Thạnh is 1 bedroom listings, making up 49% of the market. This suggests a strong demand for properties suitable for couples or solo travelers.
- Together, 1 bedroom and 2 bedrooms properties represent 75.8% of the active Airbnb listings in Bình Thạnh, indicating a high concentration in these sizes.
Bình Thạnh Vacation Rental Guest Capacity Trends (2026)
Distribution of Listings by Guest Capacity
Guest Capacity Insights for Bình Thạnh
- The most common guest capacity trend in Bình Thạnh vacation rentals is listings accommodating 2 guests (39.6%). This suggests the primary traveler segment is likely couples or solo travelers.
- Properties designed for 2 guests and 5 guests dominate the Bình Thạnh STR market, accounting for 51.0% of listings.
- 24.2% of properties accommodate 6+ guests, serving the market segment for larger families or group travel in Bình Thạnh.
- On average, properties in Bình Thạnh are equipped to host 3.6 guests.
Bình Thạnh Airbnb Booking Patterns (2026): Available vs. Booked Days
Available Days Distribution
Booked Days Distribution
Booking Pattern Insights for Bình Thạnh
- The most common availability pattern in Bình Thạnh falls within the 271-366 days range, representing 69.8% of listings. This suggests many properties have significant open periods on their calendars.
- Approximately 96.0% of listings show high availability (181+ days open annually), indicating potential for increased bookings or specific owner usage patterns.
- For booked days, the 1-30 days range is most frequent in Bình Thạnh (34.2%), reflecting common guest stay durations or potential owner blocking patterns.
- A notable 4.0% of properties secure long booking periods (181+ days booked per year), highlighting successful long-term rental strategies or significant owner usage.
Bình Thạnh Airbnb Minimum Stay Requirements Analysis
Distribution of Listings by Minimum Night Requirement
1 Night
118 listings
79.2% of total
2 Nights
8 listings
5.4% of total
3 Nights
3 listings
2% of total
4-6 Nights
3 listings
2% of total
7-29 Nights
1 listings
0.7% of total
30+ Nights
16 listings
10.7% of total
Key Insights
- The most prevalent minimum stay requirement in Bình Thạnh is 1 Night, adopted by 79.2% of listings. This highlights the market's preference for shorter, flexible bookings.
- A strong majority (84.6%) of the Bình Thạnh Airbnb data shows acceptance of very short stays (1-2 nights), indicating a dynamic, high-turnover market.
- A significant segment (10.7%) caters to monthly stays (30+ nights) in Bình Thạnh, pointing to opportunities in the extended-stay market.
Recommendations
- Align with the market by considering a 1 Night minimum stay, as 79.2% of Bình Thạnh hosts use this setting.
- Explore offering discounts for stays of 30+ nights to attract the 10.7% of the market seeking extended stays.
- Adjust minimum nights based on seasonality – potentially shorter during low season and longer during peak demand periods in Bình Thạnh.
Bình Thạnh Airbnb Cancellation Policy Trends Analysis (2026)
Limited
3 listings
2% of total
Flexible
67 listings
45% of total
Moderate
52 listings
34.9% of total
Firm
27 listings
18.1% of total
Cancellation Policy Insights for Bình Thạnh
- The prevailing Airbnb cancellation policy trend in Bình Thạnh is Flexible, used by 45% of listings.
- The market strongly favors guest-friendly terms, with 79.9% of listings offering Flexible or Moderate policies. This suggests guests in Bình Thạnh may expect booking flexibility.
Recommendations for Hosts
- Consider adopting a Flexible policy to align with the 45% market standard in Bình Thạnh.
- Regularly review your cancellation policy against competitors and market demand shifts in Bình Thạnh.
Bình Thạnh STR Booking Lead Time Analysis (2026)
Average Booking Lead Time by Month
Booking Lead Time Insights for Bình Thạnh
- The overall average booking lead time for vacation rentals in Bình Thạnh is 15 days.
- Guests book furthest in advance for stays during December (average 32 days), likely coinciding with peak travel demand or local events.
- The shortest booking windows occur for stays in April (average 0 days), indicating more last-minute travel plans during this time.
- Seasonally, Winter (21 days avg.) sees the longest lead times, while Spring (1 days avg.) has the shortest, reflecting typical travel planning cycles.
Recommendations for Hosts
- Use the overall average lead time (15 days) as a baseline for your pricing and availability strategy in Bình Thạnh.
- For December stays, consider implementing length-of-stay discounts or slightly higher rates for bookings made less than 32 days out to capitalize on advance planning.
- During April, focus on last-minute booking availability and promotions, as guests book with very short notice (0 days avg.).
- Target marketing efforts for the Winter season well in advance (at least 21 days) to capture early planners.
- Monitor your own booking lead times against these Bình Thạnh averages to identify opportunities for dynamic pricing adjustments.
Popular & Essential Airbnb Amenities in Bình Thạnh (2026)
Amenity Prevalence
Amenity Insights for Bình Thạnh
- Essential amenities in Bình Thạnh that guests expect include: Wifi, Air conditioning, TV, Washer. Lacking these (any) could significantly impact bookings.
- Popular amenities like Kitchen, Fire extinguisher, Smoke alarm are common but not universal. Offering these can provide a competitive edge.
Recommendations for Hosts
- Ensure your listing includes all essential amenities for Bình Thạnh: Wifi, Air conditioning, TV, Washer.
- Prioritize adding missing essentials: Air conditioning, TV, Washer.
- Consider adding popular differentiators like Kitchen or Fire extinguisher to increase appeal.
- Highlight unique or less common amenities you offer (e.g., hot tub, dedicated workspace, EV charger) in your listing description and photos.
- Regularly check competitor amenities in Bình Thạnh to stay competitive.
Bình Thạnh Airbnb Guest Demographics & Profile Analysis (2026)
Guest Profile Summary for Bình Thạnh
- The typical guest profile for Airbnb in Bình Thạnh consists of predominantly international visitors (83%), with top international origins including Vietnam, typically belonging to the Post-2000s (Gen Z/Alpha) group (50%), primarily speaking English or Vietnamese.
- Domestic travelers account for 17.4% of guests.
- Key international markets include United States (22.1%) and Vietnam (17.4%).
- Top languages spoken are English (48.1%) followed by Vietnamese (13.6%).
- A significant demographic segment is the Post-2000s (Gen Z/Alpha) group, representing 50% of guests.
Recommendations for Hosts
- Focus marketing internationally, particularly towards travelers from Vietnam.
- Tailor amenities and listing descriptions to appeal to the dominant Post-2000s (Gen Z/Alpha) demographic (e.g., highlight fast WiFi, smart home features, local guides).
- Highlight unique local experiences or amenities relevant to the primary guest profile.
- Consider seasonal promotions aligned with peak travel times for key origin markets.
Nearby Short-Term Rental Market Comparison
How does the Bình Thạnh Airbnb market stack up against its neighbors? Compare key performance metrics like average monthly revenue, ADR, and occupancy rates in surrounding areas to understand the broader regional STR landscape.
| Market | Active Properties | Monthly Revenue | Daily Rate | Avg. Occupancy |
|---|---|---|---|---|
| Phuoc Thuan Commune | 12 | $1,629 | $360.68 | 17% |
| Thủ Thiêm | 27 | $1,112 | $143.93 | 41% |
| An Phú | 10 | $910 | $119.96 | 36% |
| Quận 2 | 40 | $618 | $76.98 | 40% |
| Thủ Đức | 116 | $607 | $81.55 | 38% |
| Quận 1 | 458 | $463 | $64.81 | 39% |
| Da Kao | 18 | $463 | $56.65 | 48% |
| Quận 3 | 88 | $441 | $52.84 | 40% |
| Quận Thủ Đức | 20 | $415 | $88.38 | 41% |
| Ho Chi Minh City | 7,937 | $415 | $60.67 | 35% |