Cam Lâm Airbnb Market Analysis 2026: Short Term Rental Data & Vacation Rental Statistics in Khánh Hòa, Vietnam
Is Airbnb profitable in Cam Lâm in 2026? Explore comprehensive Airbnb analytics for Cam Lâm, Khánh Hòa, Vietnam to uncover income potential. This 2026 STR market report for Cam Lâm, based on AirROI data from February 2025 to January 2026, reveals key trends in the niche market of 23 active listings.
Whether you're considering an Airbnb investment in Cam Lâm, optimizing your existing vacation rental, or exploring rental arbitrage opportunities, understanding the Cam Lâm Airbnb data is crucial. Leveraging the low regulation environment is key to maximizing your short term rental income potential. Let's dive into the specifics.
Key Cam Lâm Airbnb Performance Metrics Overview
Monthly Airbnb Revenue Variations & Income Potential in Cam Lâm (2026)
Understanding the monthly revenue variations for Airbnb listings in Cam Lâm is key to maximizing your short term rental income potential. Seasonality significantly impacts earnings. Our analysis, based on data from the past 12 months, shows that the peak revenue month for STRs in Cam Lâm is typically May, while January often presents the lowest earnings, highlighting opportunities for strategic pricing adjustments during shoulder and low seasons. Explore the typical Airbnb income in Cam Lâm across different performance tiers:
- Best-in-class properties (Top 10%) achieve $1,894+ monthly, often utilizing dynamic pricing and superior guest experiences.
- Strong performing properties (Top 25%) earn $1,031 or more, indicating effective management and desirable locations/amenities.
- Typical properties (Median) generate around $364 per month, representing the average market performance.
- Entry-level properties (Bottom 25%) see earnings around $81, often with potential for optimization.
Average Monthly Airbnb Earnings Trend in Cam Lâm
Cam Lâm Airbnb Occupancy Rate Trends (2026)
Maximize your bookings by understanding the Cam Lâm STR occupancy trends. Seasonal demand shifts significantly influence how often properties are booked. Typically, Decembersees the highest demand (peak season occupancy), while October experiences the lowest (low season). Effective strategies, like adjusting minimum stays or offering promotions, can boost occupancy during slower periods. Here's how different property tiers perform in Cam Lâm:
- Best-in-class properties (Top 10%) achieve 31%+ occupancy, indicating high desirability and potentially optimized availability.
- Strong performing properties (Top 25%) maintain 22% or higher occupancy, suggesting good market fit and guest satisfaction.
- Typical properties (Median) have an occupancy rate around 12%.
- Entry-level properties (Bottom 25%) average 7% occupancy, potentially facing higher vacancy.
Average Monthly Occupancy Rate Trend in Cam Lâm
Average Daily Rate (ADR) Airbnb Trends in Cam Lâm (2026)
Effective short term rental pricing strategy in Cam Lâm involves understanding monthly ADR fluctuations. The Average Daily Rate (ADR) for Airbnb in Cam Lâm typically peaks in November and dips lowest during February. Leveraging Airbnb dynamic pricing tools or strategies based on this seasonality can significantly boost revenue. Here's a look at the typical nightly rates achieved:
- Best-in-class properties (Top 10%) command rates of $280+ per night, often due to premium features or locations.
- Strong performing properties (Top 25%) achieve nightly rates of $184 or more.
- Typical properties (Median) charge around $71 per night.
- Entry-level properties (Bottom 25%) earn around $22 per night.
Average Daily Rate (ADR) Trend by Month in Cam Lâm
Get Live Cam Lâm Market Intelligence 👇

Explore Real-time Analytics
Airbnb Seasonality Analysis & Trends in Cam Lâm (2026)
Peak Season (May, September, October)
- Revenue averages $1,145 per month
- Occupancy rates average 13.0%
- Daily rates average $134
Shoulder Season
- Revenue averages $696 per month
- Occupancy maintains around 18.4%
- Daily rates hold near $120
Low Season (January, February, November)
- Revenue drops to average $222 per month
- Occupancy decreases to average 13.0%
- Daily rates adjust to average $131
Seasonality Insights for Cam Lâm
- The Airbnb seasonality in Cam Lâm shows highly seasonal trends requiring careful strategy. While the sections above show seasonal averages, it's also insightful to look at the extremes:
- During the high season, the absolute peak month showcases Cam Lâm's highest earning potential, with monthly revenues capable of climbing to $1,246, occupancy reaching a high of 26.9%, and ADRs peaking at $147.
- Conversely, the slowest single month of the year, typically falling within the low season, marks the market's lowest point. In this month, revenue might dip to $139, occupancy could drop to 9.2%, and ADRs may adjust down to $106.
- Understanding both the seasonal averages and these monthly peaks and troughs in revenue, occupancy, and ADR is crucial for maximizing your Airbnb profit potential in Cam Lâm.
Seasonal Strategies for Maximizing Profit
- Peak Season: Maximize revenue through premium pricing and potentially longer minimum stays. Ensure high availability.
- Low Season: Offer competitive pricing, special promotions (e.g., extended stay discounts), and flexible cancellation policies. Target off-season travelers like remote workers or budget-conscious guests.
- Shoulder Seasons: Implement dynamic pricing that balances peak and low rates. Target weekend travelers or specific events. Offer slightly more flexible terms than peak season.
- Regularly analyze your own performance against these Cam Lâm seasonality benchmarks and adjust your pricing and availability strategy accordingly.
Best Areas for Airbnb Investment in Cam Lâm (2026)
Exploring the top neighborhoods for short-term rentals in Cam Lâm? This section highlights key areas, outlining why they are attractive for hosts and guests, along with notable local attractions. Consider these locations based on your target guest profile and investment strategy.
| Neighborhood / Area | Why Host Here? (Target Guests & Appeal) | Key Attractions & Landmarks |
|---|---|---|
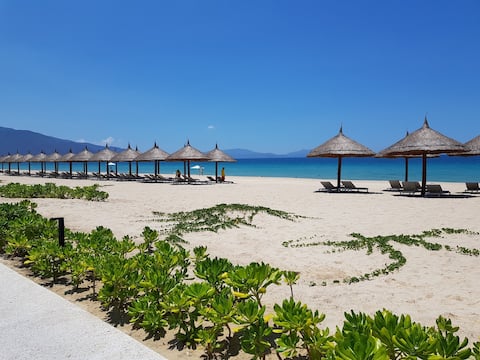
| Nha Trang Beach | Famous for its picturesque coastline and vibrant nightlife. A top destination for tourists looking for beach activities and relaxation with numerous dining options nearby. | Nha Trang Bay, Po Nagar Cham Towers, Vinpearl Land, Long Son Pagoda, Dam Market |
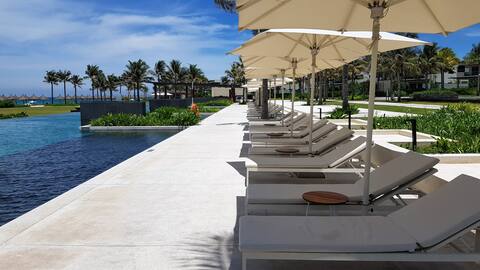
| Bãi Dài | Known for its pristine and quiet beaches, ideal for families and those seeking a more peaceful getaway. Offers beautiful scenery and a more laid-back atmosphere. | Bãi Dài Beach, Cam Ranh Bay, National Park, Water sports activities, Resort options |
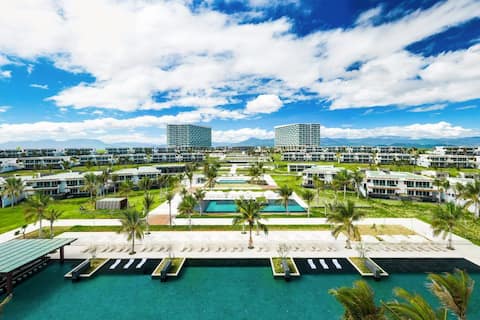
| Cam Ranh | A rapidly developing area with beautiful beaches and a range of luxury resorts. Great potential for investment due to increasing tourist traffic. | Cam Ranh International Airport, Nha Trang Beach, Long Beach, Local seafood markets, Water sports |
| Tran Phu Street | The main street in Nha Trang running along the beach, it's bustling with tourists, restaurants, and entertainment options, making it a prime location for Airbnb. | Central Park, Nha Trang Night Market, Restaurants and bars, Nightlife activities, Beach access |
| Hon Mun Island | Stunning island known for its snorkeling and diving spots. Attracts adventure seekers and nature lovers, providing a unique rental opportunity. | Aquarium, Coral reefs, Diving excursions, Island tours, Natural beauty |
| Vinh Hoa | Local area with a mix of residential and tourist facilities. Offers a more authentic Vietnamese experience, appealing to long-term travelers and expats. | Local markets, Cultural sites, Fairly quieter beaches, Nearby attractions, Genuine local cuisine |
| Tu Binh | A tranquil area away from the hustle, ideal for travelers seeking natural scenery and serenity, with investment potential in eco-friendly stays. | Natural parks, Countryside beauty, Rural experiences, Temples, Cycling paths |
| Cam Lam District | Emerging area with potential development and expansion, ideal for future investments in tourism and hospitality as it becomes more popular. | Local attractions, Cultural experiences, Nature trails, Developing tourist infrastructure, Proximity to Nha Trang |
Understanding Airbnb License Requirements & STR Laws in Cam Lâm (2026)
While Cam Lâm, Khánh Hòa, Vietnam currently shows low STR regulations, specific Airbnb license requirements might still exist or change. Always verify the latest short term rental regulations and Airbnb license requirements directly with local government authorities for Cam Lâm to ensure full compliance before hosting.
(Source: AirROI data, 2026, finding no licensed listings among those analyzed)
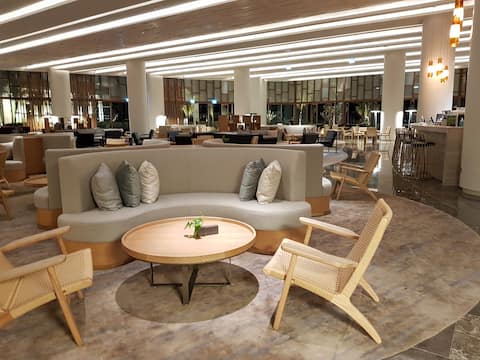
Top Performing Airbnb Properties in Cam Lâm (2026)
Benchmark your potential! Explore examples of top-performing Airbnb properties in Cam Lâmbased on Trailing Twelve Month (TTM) revenue. Analyze their characteristics, revenue, occupancy rate, and ADR to understand what drives success in this market.

Ocean View 3 Br Villa 1st Floor at Almatitle Rs
Entire Place • 3 bedrooms
Ocean View 2 Br Villa 2nd Floor at Almatitle Rs
Entire Place • 2 bedrooms
Ocean View 2 Br Apartment at Almatitle Rs
Entire Place • 2 bedrooms

Cozy Wyndham Garden Cam Ranh Villa
Entire Place • 3 bedrooms
wellcome to my little apartment!
Entire Place • 1 bedroom
Ocean View 1 Br Apartment at Almatitle Rs
Entire Place • 1 bedroom
Note: Performance varies based on location, size, amenities, seasonality, and management quality. Data reflects the past 12 months.
Top Performing Airbnb Hosts in Cam Lâm (2026)
Learn from the best! This table showcases top-performing Airbnb hosts in Cam Lâm based on the number of properties managed and estimated total revenue over the past year. Analyze their scale and performance metrics.
| Host Name | Properties | Grossing Revenue | Stay Reviews | Avg Rating |
|---|---|---|---|---|
| Nam | 4 | $60,773 | 6 | Not Rated |
| Nam | 1 | $8,293 | 5 | 4.20/5.0 |
| Nguyen | 1 | $7,249 | 1 | Not Rated |
| Trần Tuệ Tâm | 5 | $4,737 | 14 | 4.38/5.0 |
| Phan | 1 | $3,897 | 1 | Not Rated |
| Huong | 3 | $3,074 | 43 | 4.98/5.0 |
| Minh | 1 | $2,396 | 2 | Not Rated |
| Hammi | 1 | $1,812 | 5 | 5.00/5.0 |
| Ngọc | 1 | $1,685 | 1 | Not Rated |
| Linh | 2 | $1,110 | 2 | Not Rated |
Analyzing the strategies of top hosts, such as their property selection, pricing, and guest communication, can offer valuable lessons for optimizing your own Airbnb operations in Cam Lâm.
Dive Deeper: Advanced Cam Lâm STR Market Data (2026)
Ready to unlock more insights? AirROI provides access to advanced metrics and comprehensive Airbnb data for Cam Lâm. Explore detailed analytics beyond this report to refine your investment strategy, optimize pricing, and maximize your vacation rental profits.
Explore Advanced MetricsCam Lâm Short-Term Rental Market Composition (2026): Property & Room Types
Room Type Distribution
Property Type Distribution
Market Composition Insights for Cam Lâm
- The Cam Lâm Airbnb market composition is heavily skewed towards Private Room listings, which make up 52.2% of the 23 active rentals. This indicates strong guest preference for privacy and space.
- Looking at the property type distribution in Cam Lâm, House properties are the most common (60.9%), reflecting the local real estate landscape.
- Houses represent a significant 60.9% portion, catering likely to families or larger groups.
- The presence of 21.7% Hotel/Boutique listings indicates integration with traditional hospitality.
Cam Lâm Airbnb Room Capacity Analysis (2026): Bedroom Distribution
Distribution of Listings by Number of Bedrooms
Room Capacity Insights for Cam Lâm
- The dominant room capacity in Cam Lâm is 1 bedroom listings, making up 34.8% of the market. This suggests a strong demand for properties suitable for couples or solo travelers.
- Together, 1 bedroom and 3 bedrooms properties represent 56.5% of the active Airbnb listings in Cam Lâm, indicating a high concentration in these sizes.
- A significant 34.7% of listings offer 3+ bedrooms, catering to larger groups and families seeking more space in Cam Lâm.
Cam Lâm Vacation Rental Guest Capacity Trends (2026)
Distribution of Listings by Guest Capacity
Guest Capacity Insights for Cam Lâm
- The most common guest capacity trend in Cam Lâm vacation rentals is listings accommodating 6 guests (21.7%). This suggests the primary traveler segment is likely larger groups.
- Properties designed for 6 guests and 2 guests dominate the Cam Lâm STR market, accounting for 43.4% of listings.
- 34.7% of properties accommodate 6+ guests, serving the market segment for larger families or group travel in Cam Lâm.
- On average, properties in Cam Lâm are equipped to host 3.3 guests.
Cam Lâm Airbnb Booking Patterns (2026): Available vs. Booked Days
Available Days Distribution
Booked Days Distribution
Booking Pattern Insights for Cam Lâm
- The most common availability pattern in Cam Lâm falls within the 271-366 days range, representing 100% of listings. This suggests many properties have significant open periods on their calendars.
- Approximately 100.0% of listings show high availability (181+ days open annually), indicating potential for increased bookings or specific owner usage patterns.
- For booked days, the 1-30 days range is most frequent in Cam Lâm (69.6%), reflecting common guest stay durations or potential owner blocking patterns.
Cam Lâm Airbnb Minimum Stay Requirements Analysis
Distribution of Listings by Minimum Night Requirement
1 Night
17 listings
73.9% of total
3 Nights
1 listings
4.3% of total
4-6 Nights
4 listings
17.4% of total
30+ Nights
1 listings
4.3% of total
Key Insights
- The most prevalent minimum stay requirement in Cam Lâm is 1 Night, adopted by 73.9% of listings. This highlights the market's preference for shorter, flexible bookings.
- A strong majority (73.9%) of the Cam Lâm Airbnb data shows acceptance of very short stays (1-2 nights), indicating a dynamic, high-turnover market.
Recommendations
- Align with the market by considering a 1 Night minimum stay, as 73.9% of Cam Lâm hosts use this setting.
- Adjust minimum nights based on seasonality – potentially shorter during low season and longer during peak demand periods in Cam Lâm.
Cam Lâm Airbnb Cancellation Policy Trends Analysis (2026)
Flexible
11 listings
47.8% of total
Moderate
5 listings
21.7% of total
Firm
6 listings
26.1% of total
Strict
1 listings
4.3% of total
Cancellation Policy Insights for Cam Lâm
- The prevailing Airbnb cancellation policy trend in Cam Lâm is Flexible, used by 47.8% of listings.
- There's a relatively balanced mix between guest-friendly (69.5%) and stricter (30.4%) policies, offering choices for different guest needs.
- Strict cancellation policies are quite rare (4.3%), potentially making listings with this policy less competitive unless justified by high demand or property type.
Recommendations for Hosts
- Consider adopting a Flexible policy to align with the 47.8% market standard in Cam Lâm.
- Using a Strict policy might deter some guests, as only 4.3% of listings use it. Evaluate if potential revenue protection outweighs possible lower booking rates.
- Regularly review your cancellation policy against competitors and market demand shifts in Cam Lâm.
Cam Lâm STR Booking Lead Time Analysis (2026)
Average Booking Lead Time by Month
Booking Lead Time Insights for Cam Lâm
- The overall average booking lead time for vacation rentals in Cam Lâm is 17 days.
- Guests book furthest in advance for stays during October (average 121 days), likely coinciding with peak travel demand or local events.
- The shortest booking windows occur for stays in November (average 4 days), indicating more last-minute travel plans during this time.
- Seasonally, Fall (50 days avg.) sees the longest lead times, while Summer (11 days avg.) has the shortest, reflecting typical travel planning cycles.
Recommendations for Hosts
- Use the overall average lead time (17 days) as a baseline for your pricing and availability strategy in Cam Lâm.
- For October stays, consider implementing length-of-stay discounts or slightly higher rates for bookings made less than 121 days out to capitalize on advance planning.
- During November, focus on last-minute booking availability and promotions, as guests book with very short notice (4 days avg.).
- Target marketing efforts for the Fall season well in advance (at least 50 days) to capture early planners.
- Monitor your own booking lead times against these Cam Lâm averages to identify opportunities for dynamic pricing adjustments.
Popular & Essential Airbnb Amenities in Cam Lâm (2026)
Amenity Prevalence
Amenity Insights for Cam Lâm
- Essential amenities in Cam Lâm that guests expect include: TV, Wifi, Air conditioning, Beach access, Kitchen, Free parking on premises. Lacking these (any) could significantly impact bookings.
- Popular amenities like Washer, Dishes and silverware, Dedicated workspace are common but not universal. Offering these can provide a competitive edge.
Recommendations for Hosts
- Ensure your listing includes all essential amenities for Cam Lâm: TV, Wifi, Air conditioning, Beach access, Kitchen, Free parking on premises.
- Prioritize adding missing essentials: Beach access, Kitchen, Free parking on premises.
- Consider adding popular differentiators like Washer or Dishes and silverware to increase appeal.
- Highlight unique or less common amenities you offer (e.g., hot tub, dedicated workspace, EV charger) in your listing description and photos.
- Regularly check competitor amenities in Cam Lâm to stay competitive.
Cam Lâm Airbnb Guest Demographics & Profile Analysis (2026)
Guest Profile Summary for Cam Lâm
- The typical guest profile for Airbnb in Cam Lâm consists of predominantly international visitors (85%), with top international origins including Germany, typically belonging to the Post-2000s (Gen Z/Alpha) group (50%), primarily speaking English or Russian.
- Domestic travelers account for 15.4% of guests.
- Key international markets include United States (23.1%) and Germany (23.1%).
- Top languages spoken are English (36.8%) followed by Russian (15.8%).
- A significant demographic segment is the Post-2000s (Gen Z/Alpha) group, representing 50% of guests.
Recommendations for Hosts
- Focus marketing internationally, particularly towards travelers from Germany.
- Tailor amenities and listing descriptions to appeal to the dominant Post-2000s (Gen Z/Alpha) demographic (e.g., highlight fast WiFi, smart home features, local guides).
- Highlight unique local experiences or amenities relevant to the primary guest profile.
- Consider seasonal promotions aligned with peak travel times for key origin markets.
Nearby Short-Term Rental Market Comparison
How does the Cam Lâm Airbnb market stack up against its neighbors? Compare key performance metrics like average monthly revenue, ADR, and occupancy rates in surrounding areas to understand the broader regional STR landscape.
| Market | Active Properties | Monthly Revenue | Daily Rate | Avg. Occupancy |
|---|---|---|---|---|
| Nha Trang | 1,357 | $461 | $72.90 | 33% |
| Cam Ranh | 43 | $414 | $115.75 | 17% |
| Dalat | 93 | $326 | $66.30 | 28% |
| Đà Lạt | 932 | $274 | $56.93 | 24% |
| Quy Nhơn | 199 | $138 | $43.64 | 22% |
| Phan Rang–Tháp Chàm | 29 | $117 | $29.17 | 23% |
| Pleiku | 30 | $106 | $32.09 | 16% |
| Buôn Ma Thuột | 30 | $98 | $37.64 | 18% |
| Phan Rang – Tháp Chàm | 10 | $97 | $34.90 | 18% |
| Tuy Hòa | 63 | $82 | $42.02 | 18% |