Belize City, Belize City Airbnb Market Data 2025: STR Report & Statistics
How much can you earn on Airbnb in Belize City, Belize City? Based on AirROI's 2025 dataset (June 2024 – May 2025), the short answer is $12,187 per year — at a $146 nightly rate, 33.4% occupancy, and a N/A RevPAR.
At 167 active listings, Belize City is a boutique market where selective demand that rewards strong listing quality and pricing strategy. Supply remained flat as revenue grew despite softer nightly rates, meaning occupancy improvements are driving returns. Consistent demand and stable competition create a predictable operating environment.
Regulation is low with minimal registration requirements, pointing to an operator-friendly environment. In a market this size, differentiated listings with strong reviews can capture outsized returns relative to the competition.
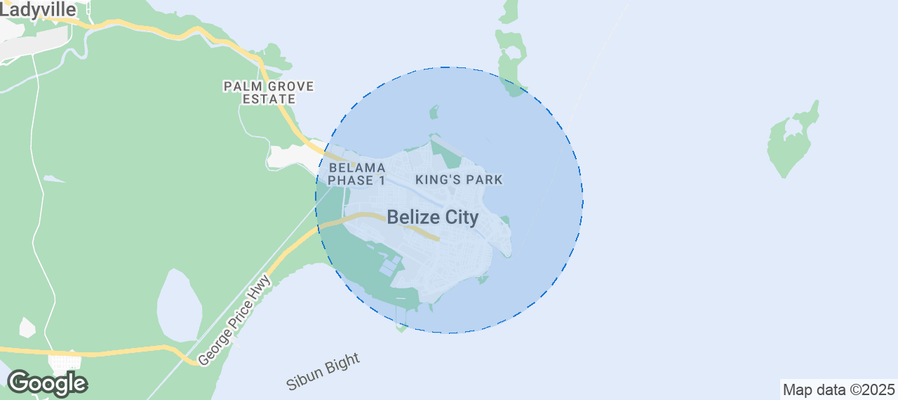
Table of Contents [hide] [show]
What Are the Key Airbnb Metrics in Belize City?
In Belize City, the headline Airbnb metrics are $12,187 in average annual revenue,33.4% occupancy, $146 ADR, and $0 in RevPAR, and guests book about 45 days in advance.
How Much Do Airbnb Hosts Earn Monthly in Belize City?
Understanding the monthly revenue variations for Airbnb listings in Belize City is key to maximizing your short term rental income potential. Seasonality significantly impacts earnings. Our analysis, based on data from the past 12 months, shows that the peak revenue month for STRs in Belize City is typically January, while November often presents the lowest earnings, highlighting opportunities for strategic pricing adjustments during shoulder and low seasons. Explore the typical Airbnb income in Belize City across different performance tiers:
- Best-in-class properties (Top 10%) achieve $2,834+ monthly, often utilizing dynamic pricing and superior guest experiences.
- Strong performing properties (Top 25%) earn $1,811 or more, indicating effective management and desirable locations/amenities.
- Typical properties (Median) generate around $920 per month, representing the average market performance.
- Entry-level properties (Bottom 25%) see earnings around $432, often with potential for optimization.
Average Monthly Airbnb Earnings Trend in Belize City
What Is the Monthly Airbnb Occupancy Rate in Belize City?
Maximize your bookings by understanding the Belize City STR occupancy trends. Seasonal demand shifts significantly influence how often properties are booked. Typically, Januarysees the highest demand (peak season occupancy), while November experiences the lowest (low season). Effective strategies, like adjusting minimum stays or offering promotions, can boost occupancy during slower periods. Here's how different property tiers perform in Belize City:
- Best-in-class properties (Top 10%) achieve 74%+ occupancy, indicating high desirability and potentially optimized availability.
- Strong performing properties (Top 25%) maintain 54% or higher occupancy, suggesting good market fit and guest satisfaction.
- Typical properties (Median) have an occupancy rate around 29%.
- Entry-level properties (Bottom 25%) average 14% occupancy, potentially facing higher vacancy.
Average Monthly Occupancy Rate Trend in Belize City
What Is the Average Airbnb Nightly Rate in Belize City?
Effective short term rental pricing strategy in Belize City involves understanding monthly ADR fluctuations. The Average Daily Rate (ADR) for Airbnb in Belize City typically peaks in December and dips lowest during January. Leveraging Airbnb dynamic pricing tools or strategies based on this seasonality can significantly boost revenue. Here's a look at the typical nightly rates achieved:
- Best-in-class properties (Top 10%) command rates of $238+ per night, often due to premium features or locations.
- Strong performing properties (Top 25%) achieve nightly rates of $140 or more.
- Typical properties (Median) charge around $97 per night.
- Entry-level properties (Bottom 25%) earn around $71 per night.
Average Daily Rate (ADR) Trend by Month in Belize City
What Is the RevPAR for Airbnb in Belize City?
RevPAR in Belize City is currently N/A. Because RevPAR combines nightly rates with realized occupancy, it is one of the cleanest ways to compare how efficiently listings turn demand into revenue across the market.
- Entry-level properties (Bottom 25%) see N/A RevPAR.
- Typical properties (Median) generate N/A RevPAR.
- Strong performers (Top 25%) earn N/A RevPAR.
- Best-in-class (Top 10%) achieve N/A RevPAR.
Average Monthly RevPAR Trend in Belize City
RevPAR Insights for Belize City
- RevPAR peaks in Jan and bottoms out in Jan, mirroring the broader seasonal demand pattern and suggesting opportunities for dynamic pricing.
Recommendations for Hosts
- Track your own RevPAR monthly against these Belize City benchmarks. If your RevPAR falls below the median of N/A, examine whether low occupancy or low ADR is the primary drag.
- Use RevPAR rather than revenue alone when comparing properties of different sizes — it normalizes for available nights and gives a more accurate picture of performance.
Get Live Belize City Market Intelligence 👇
Explore Real-time Analytics
When Is the Peak Season for Airbnb in Belize City?
Belize City's peak Airbnb season falls in January, February, August, while the softest stretch is May, September, November. Overall, the market shows moderate seasonality with distinct peak and low periods, which should guide pricing, minimum stays, and cash-flow planning.
Peak Season (January, February, August)
- Revenue averages $1,791 per month
- Occupancy rates average 41.1%
- Daily rates average $157
Shoulder Season
- Revenue averages $1,589 per month
- Occupancy maintains around 34.5%
- Daily rates hold near $158
Low Season (May, September, November)
- Revenue drops to average $1,191 per month
- Occupancy decreases to average 32.5%
- Daily rates adjust to average $158
Seasonality Insights for Belize City
- The Airbnb seasonality pattern in Belize City shows moderate seasonality with distinct peak and low periods. While the sections above show seasonal averages, it is also insightful to look at the extremes:
- During the high season, the absolute peak month showcases Belize City's highest earning potential, with monthly revenues climbing to $1,840, occupancy reaching 43.6%, and ADRs peaking at $160.
- Conversely, the slowest single month marks the market's lowest point — revenue may dip to $1,042, occupancy could drop to 29.2%, and ADRs may adjust to $156.
- Lower occupancy paired with meaningful seasonality means hosts in Belize City need to maximize every peak-season booking and seriously consider whether off-season pricing adjustments or minimum-stay changes can capture incremental revenue.
Seasonal Strategies for Maximizing Profit
- Peak Season: Maximize revenue through premium pricing and potentially longer minimum stays. Ensure high availability and consider tightening cancellation policies to reduce last-minute gaps.
- Low Season: Offer competitive pricing, extended-stay discounts, and flexible cancellation policies. Target off-season travelers like remote workers, budget-conscious guests, and travelers with flexible schedules.
- Shoulder Seasons: Implement dynamic pricing that bridges peak and low rates. Target weekend travelers, local events, and business visitors. Slightly more flexible terms than peak season can help maintain occupancy without deep discounting.
- Regularly analyze your own performance against these Belize City seasonality benchmarks and adjust your pricing and availability strategy accordingly.
Do You Need a License for Airbnb in Belize City?
Low regulation and minimal registration activity in Belize City, Belize City, Belize point to an operator-friendly environment. That said, even low-regulation markets may have tax collection requirements, safety standards, or HOA rules that affect short-term rental operations. Always verify the latest short-term rental regulations and Airbnb license requirements directly with local government authorities for Belize City to ensure full compliance before hosting.
(Source: AirROI data, 2026, based on 2% licensed listings)
What Are the Best Neighborhoods for Airbnb in Belize City?
Belize City is a smaller vacation rental market where a handful of neighborhoods drive most of the booking activity. Choosing the right area is especially important in boutique markets — there is less room for a mediocre location to succeed on volume alone. The areas below highlight where short-term rental demand is strongest and why.
| Neighborhood / Area | Why Host Here? (Target Guests & Appeal) | Key Attractions & Landmarks |
|---|---|---|
| Downtown Belize City | The central hub of Belize City, offering easy access to attractions, restaurants, and the waterfront. Ideal for tourists looking for convenience and local experiences. | Belize Museum, St. John's Cathedral, The Fort George, Belize City Swing Bridge, The Baron Bliss Lighthouse |
| Coney Drive | A popular street known for its beachfront restaurants, bars, and vibrant nightlife. Perfect for visitors wanting to enjoy the sea and local cuisine. | The Split, The Image Factory, Caye Caulker, Snorkeling tours, Beaches and water sports |
| Historic Belize City | Rich in history and colonial architecture, this area attracts those interested in the cultural heritage of Belize. A unique selling point for heritage tourism. | The Old Belize, The Anglican Cathedral, The House of Culture, Government House, Historic rural Belize tours |
| Southside | Known for its authentic local culture and close-knit communities. This area offers a less touristy experience and is great for immersion into local life. | Local markets, Community festivals, Cultural events, Art galleries, Street food tours |
| Fort George | Home to many hotels and tourist establishments, offering a stunning view of the Caribbean Sea while being close to key services and attractions. | Belize City Harbor, Casino Day, Fort Street, Seasport Belize, Educational tours |
| Ladyville | Located just outside Belize City, it offers a quieter atmosphere while still being accessible to the city, ideal for families and long-term visitors. | Community parks, Family-friendly activities, Local shopping, Nature walks, Cultural diversity |
| Belama | An up-and-coming residential area with many new developments. Attractive for those looking for a modern, comfortable stay. | Nearby nature reserves, Community sports facilities, Gated communities, Local dining options |
| Corozal | A small town within reach of Belize City, ideal for those wanting a peaceful getaway close to cenotes and nature. | Cenotes, Local beaches, Corozal Bay, Mayan ruins, Community events |
With 8 distinct neighborhoods showing meaningful short-term rental activity, Belize City offers diversification within a single market. Investors can tailor their strategy — from high-turnover tourist zones to quieter residential areas that attract longer stays and remote workers.
What Types of Properties Are on Airbnb in Belize City?
Room Type Distribution
Property Type Distribution
Market Composition Insights for Belize City
- The Belize City Airbnb market composition is heavily skewed towards Entire Home/Apt listings, which make up 55.1% of the 167 active rentals. This indicates strong guest preference for privacy and space.
- However, a notable 41.9% share for Private Rooms suggests opportunities for budget-conscious travelers or hosts renting out spare rooms.
- Looking at the property type distribution in Belize City, Apartment/Condo properties are the most common (38.3%), reflecting the local real estate landscape.
- Houses represent a significant 19.2% portion, catering likely to families or larger groups.
- The presence of 37.1% Hotel/Boutique listings indicates integration with traditional hospitality.
- Smaller segments like unique stays, outdoor/unique (combined 5.4%) offer potential for unique stay experiences.
Belize City Airbnb Room Capacity Analysis (2026): Bedroom Distribution
Distribution of Listings by Number of Bedrooms
Room Capacity Insights for Belize City
- The dominant room capacity in Belize City is 1 bedroom listings, making up 57.5% of the market. This suggests a strong demand for properties suitable for couples or solo travelers.
- Together, 1 bedroom and 2 bedrooms properties represent 74.3% of the active Airbnb listings in Belize City, indicating a high concentration in these sizes.
- With over half the market (57.5%) consisting of studios or 1-bedroom units, Belize City is particularly well-suited for individuals or couples.
Belize City Vacation Rental Guest Capacity Trends (2026)
Distribution of Listings by Guest Capacity
Guest Capacity Insights for Belize City
- The most common guest capacity trend in Belize City vacation rentals is listings accommodating 2 guests (41.9%). This suggests the primary traveler segment is likely couples or solo travelers.
- Properties designed for 2 guests and 4 guests dominate the Belize City STR market, accounting for 66.5% of listings.
- A significant 42.5% of listings cater specifically to 1-2 guests, highlighting strong demand from couples and solo travelers in Belize City.
- 13.2% of properties accommodate 6+ guests, serving the market segment for larger families or group travel in Belize City.
- On average, properties in Belize City are equipped to host 3.2 guests.
What Amenities Do Airbnb Guests Expect in Belize City?
Amenity Prevalence
Amenity Insights for Belize City
- Essential amenities in Belize City that guests expect include: Wifi, Air conditioning, TV. Lacking these (any) could significantly impact bookings.
- Popular amenities like Free parking on premises, Essentials, Fire extinguisher are common but not universal. Offering these can provide a competitive edge.
Recommendations for Hosts
- Ensure your listing includes all essential amenities for Belize City: Wifi, Air conditioning, TV.
- Prioritize adding missing essentials: Wifi, Air conditioning, TV.
- Consider adding popular differentiators like Free parking on premises or Essentials to increase appeal.
- Highlight unique or less common amenities you offer (e.g., hot tub, dedicated workspace, EV charger) in your listing description and photos.
- Regularly check competitor amenities in Belize City to stay competitive.
Dive Deeper: Advanced Belize City STR Market Data (2026)
Ready to unlock more insights? AirROI provides access to advanced metrics and comprehensive Airbnb data for Belize City. Explore detailed analytics beyond this report to refine your investment strategy, optimize pricing, and maximize your vacation rental profits.
Explore Advanced MetricsBelize City Airbnb Guest Demographics & Profile Analysis (2026)
Guest Profile Summary for Belize City
- The typical guest profile for Airbnb in Belize City consists of predominantly international visitors (95%), with top international origins including Canada, typically belonging to the Post-2000s (Gen Z/Alpha) group (50%), primarily speaking English or Spanish.
- Domestic travelers account for 5.2% of guests.
- Key international markets include United States (68.9%) and Canada (6.5%).
- Top languages spoken are English (58.9%) followed by Spanish (20.2%).
- A significant demographic segment is the Post-2000s (Gen Z/Alpha) group, representing 50% of guests.
Recommendations for Hosts
- Focus marketing internationally, particularly towards travelers from Canada.
- Tailor amenities and listing descriptions to appeal to the dominant Post-2000s (Gen Z/Alpha) demographic (e.g., highlight fast WiFi, smart home features, local guides).
- Highlight unique local experiences or amenities relevant to the primary guest profile.
- Consider seasonal promotions aligned with peak travel times for key origin markets.
Belize City Airbnb Booking Patterns (2026): Available vs. Booked Days
Available Days Distribution
Booked Days Distribution
Booking Pattern Insights for Belize City
- The most common availability pattern in Belize City falls within the 271-366 days range, representing 55.7% of listings. This suggests many properties have significant open periods on their calendars.
- Approximately 88.6% of listings show high availability (181+ days open annually), indicating potential for increased bookings or specific owner usage patterns.
- For booked days, the 31-90 days range is most frequent in Belize City (35.3%), reflecting common guest stay durations or potential owner blocking patterns.
- A notable 11.4% of properties secure long booking periods (181+ days booked per year), highlighting successful long-term rental strategies or significant owner usage.
How Far in Advance Do Guests Book Airbnb in Belize City?
Average Booking Lead Time by Month
Booking Lead Time Insights for Belize City
- The overall average booking lead time for vacation rentals in Belize City is 45 days.
- Guests book furthest in advance for stays during June (average 54 days), likely coinciding with peak travel demand or local events.
- The shortest booking windows occur for stays in August (average 34 days), indicating more last-minute travel plans during this time.
- Seasonally, Winter (47 days avg.) sees the longest lead times, while Spring (44 days avg.) has the shortest, reflecting typical travel planning cycles.
Recommendations for Hosts
- Use the overall average lead time (45 days) as a baseline for your pricing and availability strategy in Belize City.
- Target marketing efforts for the Winter season well in advance (at least 47 days) to capture early planners.
- Monitor your own booking lead times against these Belize City averages to identify opportunities for dynamic pricing adjustments.
Belize City Airbnb Minimum Stay Requirements Analysis
Distribution of Listings by Minimum Night Requirement
1 Night
126 listings
77.8% of total
2 Nights
18 listings
11.1% of total
3 Nights
8 listings
4.9% of total
4-6 Nights
3 listings
1.9% of total
30+ Nights
7 listings
4.3% of total
Key Insights
- The most prevalent minimum stay requirement in Belize City is 1 Night, adopted by 77.8% of listings. This highlights the market's preference for shorter, flexible bookings.
- A strong majority (88.9%) of the Belize City Airbnb data shows acceptance of very short stays (1-2 nights), indicating a dynamic, high-turnover market.
Recommendations
- Align with the market by considering a 1 Night minimum stay, as 77.8% of Belize City hosts use this setting.
- Adjust minimum nights based on seasonality – potentially shorter during low season and longer during peak demand periods in Belize City.
Belize City Airbnb Cancellation Policy Trends Analysis (2026)
Super Strict 30 Days
1 listings
0.6% of total
Flexible
18 listings
11.7% of total
Moderate
46 listings
29.9% of total
Firm
14 listings
9.1% of total
Strict
75 listings
48.7% of total
Cancellation Policy Insights for Belize City
- The prevailing Airbnb cancellation policy trend in Belize City is Strict, used by 48.7% of listings.
- A majority (57.8%) of hosts in Belize City utilize Firm or Strict policies, indicating a market where hosts prioritize booking security.
Recommendations for Hosts
- Consider adopting a Strict policy to align with the 48.7% market standard in Belize City.
- With 48.7% using Strict terms, this is a viable option in Belize City, particularly for high-value properties or during peak demand periods.
- Regularly review your cancellation policy against competitors and market demand shifts in Belize City.
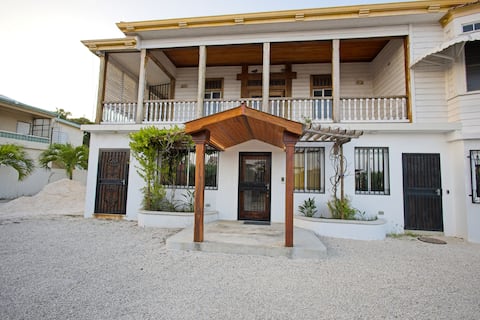
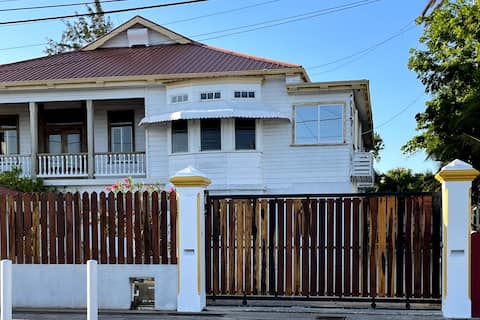
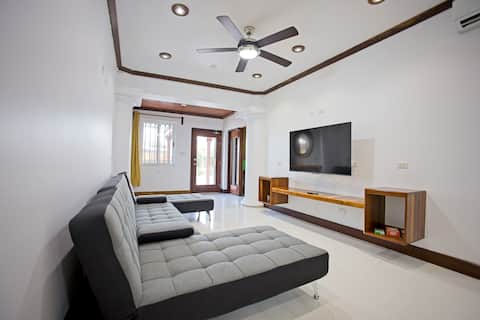
What Do the Top Airbnb Listings in Belize City Look Like?
Benchmark your potential! Explore examples of top-performing Airbnb properties in Belize Citybased on Trailing Twelve Month (TTM) revenue. Analyze their characteristics, revenue, occupancy rate, and ADR to understand what drives success in this market.

Casa Al Mar, Belize, All-Inclusive Vacation Rental
Entire Place • 6 bedrooms
SeaView 7 Bed 7 Bath Apartment in Belize City
Entire Place • 7 bedrooms

Therapy, Entire Property
Entire Place • 4 bedrooms
Seaview 4 Bed 4 Bath Apartment in Belize City
Entire Place • 4 bedrooms

Therapy - Cabin 1 at St. George's Caye
Entire Place • 2 bedrooms
SeaView 3 Bed 3 Bath Apartment in Belize City
Entire Place • 3 bedrooms
Note: Performance varies based on location, size, amenities, seasonality, and management quality. Data reflects the past 12 months.
Who Are the Top Airbnb Hosts in Belize City?
Learn from the best! This table showcases top-performing Airbnb hosts in Belize City based on the number of properties managed and estimated total revenue over the past year. Analyze their scale and performance metrics.
| Host Name | Properties | Grossing Revenue | Stay Reviews | Avg Rating |
|---|---|---|---|---|
| Ricky | 11 | $183,509 | 591 | 4.83/5.0 |
| Hipolito | 4 | $173,227 | 89 | 4.90/5.0 |
| Michelle | 15 | $167,316 | 404 | 4.82/5.0 |
| Lynn & Althea | 4 | $149,157 | 145 | 4.98/5.0 |
| Kirsten | 14 | $119,939 | 505 | 4.76/5.0 |
| Tiana | 4 | $102,048 | 616 | 4.93/5.0 |
| Host #494574985 | 1 | $100,871 | 0 | Not Rated |
| David | 20 | $94,589 | 388 | 4.52/5.0 |
| Carolyn | 5 | $94,431 | 257 | 4.89/5.0 |
| Carmen | 4 | $90,869 | 287 | 4.87/5.0 |
Analyzing the strategies of top hosts, such as their property selection, pricing, and guest communication, can offer valuable lessons for optimizing your own Airbnb operations in Belize City.
How Does Belize City's Airbnb Market Compare to Nearby Cities?
How does the Belize City Airbnb market stack up against its neighbors? Compare key performance metrics like average monthly revenue, ADR, and occupancy rates in surrounding areas to understand the broader regional STR landscape.
Compared with Kate Subdivision, Belize City has 14 percentage points lower occupancy and about $159 lower ADR. That helps frame whether this market is winning more on demand, pricing, or both.
| Market | Active Properties | Monthly Revenue | Daily Rate | Avg. Occupancy |
|---|---|---|---|---|
| Kate Subdivision | 10 | $3,841 | $305.16 | 47% |
| Maya Beach | 79 | $3,243 | $399.76 | 36% |
| Hopkins Village | 53 | $3,164 | $322.00 | 39% |
| San Pedro Town | 651 | $3,097 | $309.63 | 41% |
| Caribbean Way | 25 | $2,939 | $321.88 | 40% |
| Placencia | 262 | $2,553 | $281.53 | 38% |
| Seine Bight | 26 | $2,484 | $417.95 | 39% |
| San Pedro | 39 | $2,316 | $336.11 | 33% |
| Caye Caulker Village | 357 | $2,050 | $170.81 | 45% |
| San Pedro | 73 | $2,040 | $280.40 | 33% |
Frequently Asked Questions About Airbnb in Belize City
These quick answers summarize the most common investor and operator questions using AirROI's latest market data for Belize City.
How much do Airbnb hosts make in Belize City?
Belize City hosts earn about $12,187 per year on average, with an average nightly rate of $146 and RevPAR of N/A. Those figures describe the typical revenue environment for active listings in Belize City, Belize City, not the ceiling for the best operators. Source: AirROI 2025 data, Belize City market, June 2024 to May 2025.
What is the average Airbnb occupancy rate in Belize City?
The average Airbnb occupancy rate in Belize City is 33.4%. January is the strongest month and November is the softest, so hosts should expect demand to move meaningfully throughout the year rather than stay flat.
What is the average Airbnb daily rate in Belize City?
Listings in Belize City average $146 per night. The broader pricing spread also matters: lower-performing listings cluster closer to the lower quartiles, while premium homes can price materially above the city average when demand spikes or listing quality stands out.
How many Airbnb listings are active in Belize City?
Belize City currently has about 167 active Airbnb listings in AirROI's market dataset. That supply count helps explain how competitive the market is, how much depth there is for benchmarking, and whether the market behaves like a niche destination or a scaled urban market.
How strict are short-term rental regulations in Belize City?
AirROI currently classifies the short-term rental regulation level in Belize City as Low. The dataset also shows about 1.8% of listings with registration evidence. That is a market signal, not legal advice, so hosts should still confirm current licensing and compliance rules locally before listing.
What is the RevPAR for Airbnb in Belize City?
RevPAR in Belize City is about N/A. That metric combines pricing and occupancy into one efficiency number, so it is often a better quick benchmark than ADR alone when investors want to compare how well listings convert nightly rates into realized revenue.
Is Airbnb profitable in Belize City?
Occupancy of 33.4% means Belize City is a more selective market. Profitability is achievable but requires careful cost management, premium positioning, or targeting longer stays to reduce turnover. Average annual revenue is $12,187, but individual returns depend on property type, location within the city, and the host's operating efficiency.
How far in advance do guests book Airbnb in Belize City?
The average booking lead time in Belize City is about 45 days — a moderate lead time that gives hosts planning visibility while still benefiting from last-minute bookings. Hosts who understand their market's booking cadence can adjust minimum stays and pricing windows accordingly.
What are the best neighborhoods for Airbnb in Belize City?
Based on AirROI's analysis, some of the top neighborhoods for short-term rentals in Belize City include Downtown Belize City, Coney Drive, Historic Belize City. Each area attracts different guest profiles — from business travelers to leisure visitors — so the best location depends on the property type and target audience a host is aiming for. See the full neighborhood breakdown above.
What type of property performs best on Airbnb in Belize City?
entire_home listings make up 55.1% of the active supply in Belize City. The most common configuration does not always mean the most profitable — operators who identify underserved property types or bedroom counts can sometimes outperform the market average by filling a gap in local supply.
How does Belize City compare to nearby Airbnb markets?
Among neighboring markets, Kate Subdivision posts $46,091 in average annual revenue with 46.6% occupancy, compared to Belize City's $12,187 and 33.4%. Comparing nearby markets helps investors understand whether a destination's performance reflects local demand or broader regional trends.
When is the peak season for Airbnb in Belize City?
January is the highest-revenue month in Belize City, while November is the softest. The revenue spread between them indicates moderate seasonality with a clear peak period, giving hosts opportunities to maximize rates during high demand without facing dramatic off-season drops.
About AirROI Market Data
AirROI tracks over 20 million properties across 190+ countries and maintains 15+ years of historical performance data, making it one of the deepest Airbnb and STR intelligence platforms available. The analytics pipeline aggregates listing-level data monthly — revenue, occupancy, nightly rates, RevPAR, guest demographics, booking patterns, and competitive supply — so investors and operators can benchmark any market against its own history and against neighboring destinations.
Real estate investors, property managers, financial institutions, hedge funds, tourism boards, hospitality consultants, tech platforms, and academic researchers rely on AirROI data to underwrite acquisitions, optimize pricing, model macro trends, and conduct peer-reviewed research. Data is available through in-depth market reports like this one and the Airbnb API with 22 endpoints and an Airbnb MCP Server for AI agents.
AirROI proprietary analytics as of 2025-05-31. Metrics reflect trailing twelve-month aggregates from active listings. Revenue figures are market averages, not projections. Neighborhood descriptions are AI-generated and reviewed for accuracy. For full methodology, see the data methodology page.