North Coast, Alexandria Governorate Airbnb Market Data 2025: STR Report & Statistics
How much can you earn on Airbnb in North Coast, Alexandria Governorate? Based on AirROI's 2025 dataset (June 2024 – May 2025), the short answer is $6,171 per year — at a $297 nightly rate, 16.9% occupancy, and a N/A RevPAR.
With just 27 active listings, North Coast is a micro-market where selective demand that rewards strong listing quality and pricing strategy. Supply grew 2600.0% over the past year, yet revenue and nightly rates both trended upward — a signal that traveler demand is outpacing new inventory rather than being diluted by it. For hosts, pricing power remains intact even as competition increases.
Regulation is low with minimal registration requirements, pointing to an operator-friendly environment. In a market this size, differentiated listings with strong reviews can capture outsized returns relative to the competition.

Table of Contents [hide] [show]
What Are the Key Airbnb Metrics in North Coast?
In North Coast, the headline Airbnb metrics are $6,171 in average annual revenue,16.9% occupancy, $297 ADR, and $0 in RevPAR, and guests book about 9 days in advance.
How Much Do Airbnb Hosts Earn Monthly in North Coast?
Understanding the monthly revenue variations for Airbnb listings in North Coast is key to maximizing your short term rental income potential. Seasonality significantly impacts earnings. Our analysis, based on data from the past 12 months, shows that the peak revenue month for STRs in North Coast is typically August, while October often presents the lowest earnings, highlighting opportunities for strategic pricing adjustments during shoulder and low seasons. Explore the typical Airbnb income in North Coast across different performance tiers:
- Best-in-class properties (Top 10%) achieve $2,571+ monthly, often utilizing dynamic pricing and superior guest experiences.
- Strong performing properties (Top 25%) earn $2,185 or more, indicating effective management and desirable locations/amenities.
- Typical properties (Median) generate around $1,675 per month, representing the average market performance.
- Entry-level properties (Bottom 25%) see earnings around $1,248, often with potential for optimization.
Average Monthly Airbnb Earnings Trend in North Coast
What Is the Monthly Airbnb Occupancy Rate in North Coast?
Maximize your bookings by understanding the North Coast STR occupancy trends. Seasonal demand shifts significantly influence how often properties are booked. Typically, Februarysees the highest demand (peak season occupancy), while October experiences the lowest (low season). Effective strategies, like adjusting minimum stays or offering promotions, can boost occupancy during slower periods. Here's how different property tiers perform in North Coast:
- Best-in-class properties (Top 10%) achieve 26%+ occupancy, indicating high desirability and potentially optimized availability.
- Strong performing properties (Top 25%) maintain 23% or higher occupancy, suggesting good market fit and guest satisfaction.
- Typical properties (Median) have an occupancy rate around 19%.
- Entry-level properties (Bottom 25%) average 15% occupancy, potentially facing higher vacancy.
Average Monthly Occupancy Rate Trend in North Coast
What Is the Average Airbnb Nightly Rate in North Coast?
Effective short term rental pricing strategy in North Coast involves understanding monthly ADR fluctuations. The Average Daily Rate (ADR) for Airbnb in North Coast typically peaks in August and dips lowest during April. Leveraging Airbnb dynamic pricing tools or strategies based on this seasonality can significantly boost revenue. Here's a look at the typical nightly rates achieved:
- Best-in-class properties (Top 10%) command rates of $318+ per night, often due to premium features or locations.
- Strong performing properties (Top 25%) achieve nightly rates of $308 or more.
- Typical properties (Median) charge around $303 per night.
- Entry-level properties (Bottom 25%) earn around $280 per night.
Average Daily Rate (ADR) Trend by Month in North Coast
What Is the RevPAR for Airbnb in North Coast?
RevPAR in North Coast is currently N/A. Because RevPAR combines nightly rates with realized occupancy, it is one of the cleanest ways to compare how efficiently listings turn demand into revenue across the market.
- Entry-level properties (Bottom 25%) see N/A RevPAR.
- Typical properties (Median) generate N/A RevPAR.
- Strong performers (Top 25%) earn N/A RevPAR.
- Best-in-class (Top 10%) achieve N/A RevPAR.
Average Monthly RevPAR Trend in North Coast
RevPAR Insights for North Coast
- RevPAR peaks in Jan and bottoms out in Jan, mirroring the broader seasonal demand pattern and suggesting opportunities for dynamic pricing.
Recommendations for Hosts
- Track your own RevPAR monthly against these North Coast benchmarks. If your RevPAR falls below the median of N/A, examine whether low occupancy or low ADR is the primary drag.
- Use RevPAR rather than revenue alone when comparing properties of different sizes — it normalizes for available nights and gives a more accurate picture of performance.
Get Live North Coast Market Intelligence 👇
Explore Real-time Analytics
When Is the Peak Season for Airbnb in North Coast?
North Coast's peak Airbnb season falls in August, July, February, while the softest stretch is June, November, December. Overall, the market shows highly seasonal trends requiring careful strategy, which should guide pricing, minimum stays, and cash-flow planning.
Peak Season (August, July, February)
- Revenue averages $2,284 per month
- Occupancy rates average 25.4%
- Daily rates average $317
Shoulder Season
- Revenue averages $325 per month
- Occupancy maintains around 3.5%
- Daily rates hold near $277
Low Season (June, November, December)
- Revenue drops to average $0 per month
- Occupancy decreases to average 0.0%
- Daily rates adjust to average $310
Seasonality Insights for North Coast
- Airbnb seasonality in North Coast is pronounced. Revenue swings sharply between peak and low months, which means pricing strategy, minimum-stay settings, and cash reserves all need to account for extended slower periods.
- During the high season, the absolute peak month showcases North Coast's highest earning potential, with monthly revenues climbing to $2,479, occupancy reaching 32.1%, and ADRs peaking at $356.
- Conversely, the slowest single month marks the market's lowest point — revenue may dip to $0, occupancy could drop to 0.0%, and ADRs may adjust to $256.
- Lower occupancy paired with meaningful seasonality means hosts in North Coast need to maximize every peak-season booking and seriously consider whether off-season pricing adjustments or minimum-stay changes can capture incremental revenue.
Seasonal Strategies for Maximizing Profit
- Peak Season: Maximize revenue through premium pricing and potentially longer minimum stays. Ensure high availability and consider tightening cancellation policies to reduce last-minute gaps.
- Low Season: Offer competitive pricing, extended-stay discounts, and flexible cancellation policies. Target off-season travelers like remote workers, budget-conscious guests, and travelers with flexible schedules.
- Shoulder Seasons: Implement dynamic pricing that bridges peak and low rates. Target weekend travelers, local events, and business visitors. Slightly more flexible terms than peak season can help maintain occupancy without deep discounting.
- In a highly seasonal market like North Coast, building a cash reserve during the top months is essential for covering fixed costs during the slow period. Automated pricing tools can help capture demand shifts in real time.
Do You Need a License for Airbnb in North Coast?
Low regulation and minimal registration activity in North Coast, Alexandria Governorate, Egypt point to an operator-friendly environment. That said, even low-regulation markets may have tax collection requirements, safety standards, or HOA rules that affect short-term rental operations. Always verify the latest short-term rental regulations and Airbnb license requirements directly with local government authorities for North Coast to ensure full compliance before hosting.
(Source: AirROI data, 2026, finding no licensed listings among those analyzed)
What Are the Best Neighborhoods for Airbnb in North Coast?
With a compact short-term rental market, North Coast gives early-mover hosts an advantage in the right neighborhoods. The areas listed below are where guest demand and local attractions converge — a useful lens for investors evaluating whether to enter this market and where to position their listing.
| Neighborhood / Area | Why Host Here? (Target Guests & Appeal) | Key Attractions & Landmarks |
|---|---|---|
| Mamoura Beach | Popular beach destination with sandy shores and family-friendly atmosphere. Ideal for vacationers seeking relaxation and water sports. | Mamoura Beach, El Montazah Palace, Montazah Gardens, Alexandria Aquarium, Sharm El Luli |
| Agamy | A vibrant coastal area known for its lively beaches and nightlife. Attracts young tourists and families looking for a fun getaway. | Agamy Beach, Kafr Abdo Beach, The Happy Land, Al Noor Mosque, Local markets |
| Stanley Bridge | Iconic landmark area known for its stunning views and proximity to the Mediterranean Sea. A popular spot for couples and photography enthusiasts. | Stanley Bridge, Stanley Beach, Cafes and restaurants, Corniche promenade, Al Mazhar Mall |
| Sidi Bishr | A bustling neighborhood that combines local culture with beach access. Popular with both locals and tourists for its vibrant atmosphere. | Sidi Bishr Beach, Local cafes and eateries, Sidi Bishr Market, Historical buildings, Beaches and resorts |
| East Alexandria | A developing area with beautiful beaches and ample recreational facilities. Increasingly popular among tourists looking for a quieter experience. | Maamoura Beach, Aida Beach, Local parks, Alexandria Golf Club, Water sports activities |
| King Mariout | Known for its serene lakes and spacious resorts, this area is perfect for travelers looking for relaxation away from the city bustle. | Lake Mariout, Resorts and health spas, Fishing spots, Cultural experiences, Nature walks |
| Al Montazah | Famous for its beautiful parks and historical sites along the coastline. Attracts families and history buffs alike. | Montazah Palace, Montazah Gardens, Cafes along the beach, Family amusement parks, Cultural events |
| Borg El Arab | A growing area with a mix of seaside attractions and industrial zones, appealing for both business and leisure travelers. | Borg El Arab Airport, Local resorts, Seaside promenades, Fishing areas, Proximity to Alexandria |
With 8 distinct neighborhoods showing meaningful short-term rental activity, North Coast offers diversification within a single market. Investors can tailor their strategy — from high-turnover tourist zones to quieter residential areas that attract longer stays and remote workers.
What Types of Properties Are on Airbnb in North Coast?
Room Type Distribution
Property Type Distribution
Market Composition Insights for North Coast
- The North Coast Airbnb market composition is heavily skewed towards Entire Home/Apt listings, which make up 100% of the 27 active rentals. This indicates strong guest preference for privacy and space.
- Looking at the property type distribution in North Coast, Outdoor/Unique properties are the most common (66.7%), reflecting the local real estate landscape.
North Coast Airbnb Room Capacity Analysis (2026): Bedroom Distribution
Distribution of Listings by Number of Bedrooms
Room Capacity Insights for North Coast
- The dominant room capacity in North Coast is 1 bedroom listings, making up 96.3% of the market. This suggests a strong demand for properties suitable for couples or solo travelers.
- With over half the market (96.3%) consisting of studios or 1-bedroom units, North Coast is particularly well-suited for individuals or couples.
North Coast Vacation Rental Guest Capacity Trends (2026)
Distribution of Listings by Guest Capacity
Guest Capacity Insights for North Coast
- The most common guest capacity trend in North Coast vacation rentals is listings accommodating 3 guests (59.3%). This suggests the primary traveler segment is likely small families or groups.
- Properties designed for 3 guests and 2 guests dominate the North Coast STR market, accounting for 100.0% of listings.
- A significant 40.7% of listings cater specifically to 1-2 guests, highlighting strong demand from couples and solo travelers in North Coast.
- On average, properties in North Coast are equipped to host 2.6 guests.
What Amenities Do Airbnb Guests Expect in North Coast?
Amenity Prevalence
No amenities with partial availability (less than 100%) were found to display in the chart. All essential amenities might be present in all listings. Check insights below.
Amenity Insights for North Coast
- Essential amenities in North Coast that guests expect include: Shampoo, Heating, Hot water, Waterfront, Pool, Hot water kettle, Dryer, First aid kit, Beach essentials, Fire extinguisher. Lacking these (any) could significantly impact bookings.
Recommendations for Hosts
- Ensure your listing includes all essential amenities for North Coast: Shampoo, Heating, Hot water, Waterfront, Pool, Hot water kettle, Dryer, First aid kit, Beach essentials, Fire extinguisher.
- Highlight unique or less common amenities you offer (e.g., hot tub, dedicated workspace, EV charger) in your listing description and photos.
- Regularly check competitor amenities in North Coast to stay competitive.
Dive Deeper: Advanced North Coast STR Market Data (2026)
Ready to unlock more insights? AirROI provides access to advanced metrics and comprehensive Airbnb data for North Coast. Explore detailed analytics beyond this report to refine your investment strategy, optimize pricing, and maximize your vacation rental profits.
Explore Advanced MetricsNorth Coast Airbnb Guest Demographics & Profile (2026)
Traveler profile data is currently unavailable for North Coast.
North Coast Airbnb Booking Patterns (2026): Available vs. Booked Days
Available Days Distribution
Booked Days Distribution
Booking Pattern Insights for North Coast
- The most common availability pattern in North Coast falls within the 271-366 days range, representing 100% of listings. This suggests many properties have significant open periods on their calendars.
- Approximately 100.0% of listings show high availability (181+ days open annually), indicating potential for increased bookings or specific owner usage patterns.
- For booked days, the 1-30 days range is most frequent in North Coast (100%), reflecting common guest stay durations or potential owner blocking patterns.
How Far in Advance Do Guests Book Airbnb in North Coast?
Average Booking Lead Time by Month
Booking Lead Time Insights for North Coast
- The overall average booking lead time for vacation rentals in North Coast is 9 days.
- Guests book furthest in advance for stays during September (average 18 days), likely coinciding with peak travel demand or local events.
- The shortest booking windows occur for stays in December (average 0 days), indicating more last-minute travel plans during this time.
- Seasonally, Fall (7 days avg.) sees the longest lead times, while Spring (0 days avg.) has the shortest, reflecting typical travel planning cycles.
Recommendations for Hosts
- Use the overall average lead time (9 days) as a baseline for your pricing and availability strategy in North Coast.
- During December, focus on last-minute booking availability and promotions, as guests book with very short notice (0 days avg.).
- Target marketing efforts for the Fall season well in advance (at least 7 days) to capture early planners.
- Monitor your own booking lead times against these North Coast averages to identify opportunities for dynamic pricing adjustments.
North Coast Airbnb Minimum Stay Requirements Analysis
Distribution of Listings by Minimum Night Requirement
1 Night
1 listings
3.7% of total
2 Nights
26 listings
96.3% of total
Key Insights
- The most prevalent minimum stay requirement in North Coast is 2 Nights, adopted by 96.3% of listings. This highlights the market's preference for shorter, flexible bookings.
- A strong majority (100.0%) of the North Coast Airbnb data shows acceptance of very short stays (1-2 nights), indicating a dynamic, high-turnover market.
Recommendations
- Align with the market by considering a 2 Nights minimum stay, as 96.3% of North Coast hosts use this setting.
- If feasible, allowing 1-night stays, especially midweek or during low season, could capture last-minute bookings, as only 3.7% currently do.
- A 2-night minimum appears standard (96.3%). Consider this for weekends or peak periods.
- Adjust minimum nights based on seasonality – potentially shorter during low season and longer during peak demand periods in North Coast.
North Coast Airbnb Cancellation Policy Trends Analysis (2026)
Moderate
1 listings
100% of total
Cancellation Policy Insights for North Coast
- The prevailing Airbnb cancellation policy trend in North Coast is Moderate, used by 100% of listings.
- The market strongly favors guest-friendly terms, with 100.0% of listings offering Flexible or Moderate policies. This suggests guests in North Coast may expect booking flexibility.
Recommendations for Hosts
- Consider adopting a Moderate policy to align with the 100% market standard in North Coast.
- Regularly review your cancellation policy against competitors and market demand shifts in North Coast.
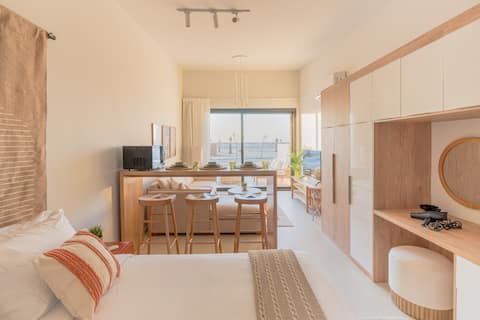
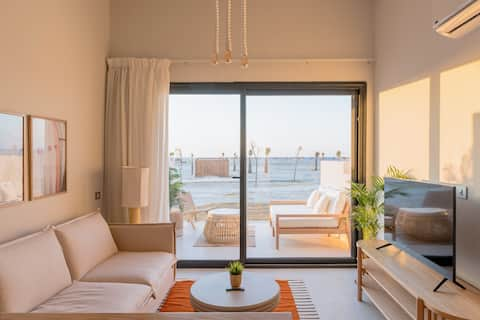
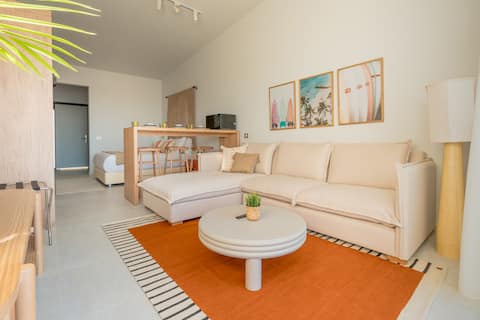
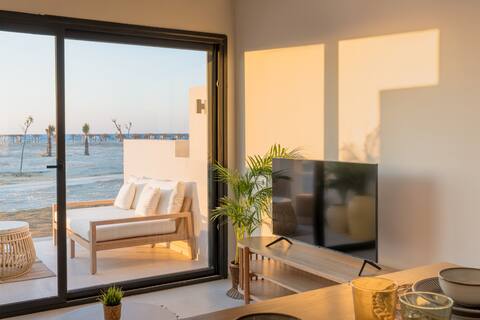
What Do the Top Airbnb Listings in North Coast Look Like?
Benchmark your potential! Explore examples of top-performing Airbnb properties in North Coastbased on Trailing Twelve Month (TTM) revenue. Analyze their characteristics, revenue, occupancy rate, and ADR to understand what drives success in this market.

Lemon Spaces Light Seaview Cabin
Entire Place • N/A
Lemon Spaces Light Seaview Cabin
Entire Place • N/A

Lemon Spaces Light Beach-Front Cabin
Entire Place • N/A
Lemon Spaces Light Seaview Cabin
Entire Place • N/A
Lemon Spaces Light Beach-Front Cabin
Entire Place • N/A
Lemon Spaces Light Beach-Front Cabin
Entire Place • N/A
Note: Performance varies based on location, size, amenities, seasonality, and management quality. Data reflects the past 12 months.
Who Are the Top Airbnb Hosts in North Coast?
Learn from the best! This table showcases top-performing Airbnb hosts in North Coast based on the number of properties managed and estimated total revenue over the past year. Analyze their scale and performance metrics.
| Host Name | Properties | Grossing Revenue | Stay Reviews | Avg Rating |
|---|---|---|---|---|
| LemonSpaces | 27 | $166,629 | 14 | 4.00/5.0 |
Analyzing the strategies of top hosts, such as their property selection, pricing, and guest communication, can offer valuable lessons for optimizing your own Airbnb operations in North Coast.
How Does North Coast's Airbnb Market Compare to Nearby Cities?
How does the North Coast Airbnb market stack up against its neighbors? Compare key performance metrics like average monthly revenue, ADR, and occupancy rates in surrounding areas to understand the broader regional STR landscape.
Compared with Seashell, North Coast has 17 percentage points lower occupancy and about $0 higher ADR. That helps frame whether this market is winning more on demand, pricing, or both.
| Market | Active Properties | Monthly Revenue | Daily Rate | Avg. Occupancy |
|---|---|---|---|---|
| Seashell | 17 | $1,042 | $296.33 | 34% |
| قسم مرسى مطروح | 10 | $951 | $312.43 | 33% |
| La Hacienda Bay - Sidi AbdelRahman | 28 | $843 | $306.73 | 26% |
| Orchidia | 11 | $804 | $328.58 | 29% |
| مراسي | 228 | $782 | $379.24 | 28% |
| Mountainview Ras El Hekma | 19 | $696 | $304.41 | 34% |
| Fuka | 10 | $681 | $361.40 | 23% |
| La Vista | 11 | $671 | $246.00 | 26% |
| Mersa Matruh | 55 | $658 | $299.18 | 24% |
| Matrouh Governorate | 12 | $644 | $219.84 | 30% |
Frequently Asked Questions About Airbnb in North Coast
These quick answers summarize the most common investor and operator questions using AirROI's latest market data for North Coast.
How much do Airbnb hosts make in North Coast?
North Coast hosts earn about $6,171 per year on average, with an average nightly rate of $297 and RevPAR of N/A. Those figures describe the typical revenue environment for active listings in North Coast, Alexandria Governorate, not the ceiling for the best operators. Source: AirROI 2025 data, North Coast market, June 2024 to May 2025.
What is the average Airbnb occupancy rate in North Coast?
The average Airbnb occupancy rate in North Coast is 16.9%. August is the strongest month and October is the softest, so hosts should expect demand to move meaningfully throughout the year rather than stay flat.
What is the average Airbnb daily rate in North Coast?
Listings in North Coast average $297 per night. The broader pricing spread also matters: lower-performing listings cluster closer to the lower quartiles, while premium homes can price materially above the city average when demand spikes or listing quality stands out.
How many Airbnb listings are active in North Coast?
North Coast currently has about 27 active Airbnb listings in AirROI's market dataset. That supply count helps explain how competitive the market is, how much depth there is for benchmarking, and whether the market behaves like a niche destination or a scaled urban market.
How strict are short-term rental regulations in North Coast?
AirROI currently classifies the short-term rental regulation level in North Coast as Low. The dataset also shows about 0.0% of listings with registration evidence. That is a market signal, not legal advice, so hosts should still confirm current licensing and compliance rules locally before listing.
What is the RevPAR for Airbnb in North Coast?
RevPAR in North Coast is about N/A. That metric combines pricing and occupancy into one efficiency number, so it is often a better quick benchmark than ADR alone when investors want to compare how well listings convert nightly rates into realized revenue.
Is Airbnb profitable in North Coast?
Occupancy of 16.9% means North Coast is a more selective market. Profitability is achievable but requires careful cost management, premium positioning, or targeting longer stays to reduce turnover. Average annual revenue is $6,171, but individual returns depend on property type, location within the city, and the host's operating efficiency.
How far in advance do guests book Airbnb in North Coast?
The average booking lead time in North Coast is about 9 days — a relatively short booking window, meaning most guests decide within a few weeks of their trip — dynamic pricing can capture late demand. Hosts who understand their market's booking cadence can adjust minimum stays and pricing windows accordingly.
What are the best neighborhoods for Airbnb in North Coast?
Based on AirROI's analysis, some of the top neighborhoods for short-term rentals in North Coast include Mamoura Beach, Agamy, Stanley Bridge. Each area attracts different guest profiles — from business travelers to leisure visitors — so the best location depends on the property type and target audience a host is aiming for. See the full neighborhood breakdown above.
What type of property performs best on Airbnb in North Coast?
entire_home listings make up 100.0% of the active supply in North Coast. The most common configuration does not always mean the most profitable — operators who identify underserved property types or bedroom counts can sometimes outperform the market average by filling a gap in local supply.
How does North Coast compare to nearby Airbnb markets?
Among neighboring markets, Seashell posts $12,505 in average annual revenue with 33.6% occupancy, compared to North Coast's $6,171 and 16.9%. Comparing nearby markets helps investors understand whether a destination's performance reflects local demand or broader regional trends.
About AirROI Market Data
AirROI tracks over 20 million properties across 190+ countries and maintains 15+ years of historical performance data, making it one of the deepest Airbnb and STR intelligence platforms available. The analytics pipeline aggregates listing-level data monthly — revenue, occupancy, nightly rates, RevPAR, guest demographics, booking patterns, and competitive supply — so investors and operators can benchmark any market against its own history and against neighboring destinations.
Real estate investors, property managers, financial institutions, hedge funds, tourism boards, hospitality consultants, tech platforms, and academic researchers rely on AirROI data to underwrite acquisitions, optimize pricing, model macro trends, and conduct peer-reviewed research. Data is available through in-depth market reports like this one and the Airbnb API with 22 endpoints and an Airbnb MCP Server for AI agents.
AirROI proprietary analytics as of 2025-05-31. Metrics reflect trailing twelve-month aggregates from active listings. Revenue figures are market averages, not projections. Neighborhood descriptions are AI-generated and reviewed for accuracy. For full methodology, see the data methodology page.